

Abstract
Background
We identified risk factors, derived and validated a prognostic score for poor neurological outcome and death for use in cerebral venous thrombosis (CVT).
Methods
We performed an international multicenter retrospective study including consecutive patients with CVT from January 2015 to December 2020. Demographic, clinical, and radiographic characteristics were collected. Univariable and multivariable logistic regressions were conducted to determine risk factors for poor outcome, mRS 3-6. A prognostic score was derived and validated.
Results
A total of 1,025 patients were analyzed with median 375 days (interquartile range [IQR], 180 to 747) of follow-up. The median age was 44 (IQR, 32 to 58) and 62.7% were female. Multivariable analysis revealed the following factors were associated with poor outcome at 90- day follow-up: active cancer (odds ratio [OR], 11.20; 95% confidence interval [CI], 4.62 to 27.14; P<0.001), age (OR, 1.02 per year; 95% CI, 1.00 to 1.04; P=0.039), Black race (OR, 2.17; 95% CI, 1.10 to 4.27; P=0.025), encephalopathy or coma on presentation (OR, 2.71; 95% CI, 1.39 to 5.30; P=0.004), decreased hemoglobin (OR, 1.16 per g/dL; 95% CI, 1.03 to 1.31; P=0.014), higher NIHSS on presentation (OR, 1.07 per point; 95% CI, 1.02 to 1.11; P=0.002), and substance use (OR, 2.34; 95% CI, 1.16 to 4.71; P=0.017). The derived IN-REvASC score outperformed ISCVT-RS for the prediction of poor outcome at 90-day follow-up (area under the curve [AUC], 0.84 [95% CI, 0.79 to 0.87] vs. AUC, 0.71 [95% CI, 0.66 to 0.76], χ2 P<0.001) and mortality (AUC, 0.84 [95% CI, 0.78 to 0.90] vs. AUC, 0.72 [95% CI, 0.66 to 0.79], χ2 P=0.03).
Conclusions
Seven factors were associated with poor neurological outcome following CVT. The INREvASC score increased prognostic accuracy compared to ISCVT-RS. Determining patients at highest risk of poor outcome in CVT could help in clinical decision making and identify patients for targeted therapy in future clinical trials.
Keywords: Stroke; Sinus thrombosis, intracranial; Prognosis
Introduction
Cerebral venous thrombosis (CVT) is a rare cause of stroke, with an estimated incidence of approximately 1.5 per 100,000 person-years [1,2]. The condition is more common in young patients, especially young women. CVT involves thrombus formation in the venous system of the brain including the deep veins, superficial veins, and sinuses. Occlusions may result in venous infarct, intracranial hemorrhage, and cerebral edema. Overall mortality is low with a case fatality rate of 5% to 10% [3-5]. In accordance with its rarity, CVT is less well understood than other major causes of stroke.
Prior studies of CVT have identified a number of factors associated with poor neurological outcome or disability including coma, cerebral edema, focal deficit, and thrombosis of the deep cerebral vessels [3,5-9]. However, many of these studies have been small and limited in the variables under study. To date, the most influential study of CVT patients is the International Study on Cerebral Vein and Dural Sinus Thrombosis (ISCVT) published in 2004 [5]. From this cohort, the ISCVT risk score (ISCVT-RS) for poor neurological outcome was derived and validated, and has subsequently seen more widespread use than similar scores [10-14]. Since the publication of ISCVT, there have been advances in the diagnosis and treatment of CVT patients [15-18]. However, it remains unclear whether these advances have impacted outcomes of CVT patients. Risk stratification of patients may help with clinical decision making and identify those who could benefit from further treatment and study.
In this large observational study, we sought to identify clinical, laboratory, and imaging factors associated with poor neurological outcome, modified Rankin Scale (mRS) 3–6, and to derive and validate a prognostic score for poor neurological outcome at 90 days following a diagnosis of CVT.
Methods
Institutional Review Board approval was obtained from each participating center to conduct the study. Written informed consent by the patients was waived due to the retrospective nature of this study. De-identified data are available upon reasonable request to the corresponding author. This study followed the TRIPOD reporting guidelines (Supplementary Table 1).
Patient population
The Anticoagulation in the Treatment of Cerebral Venous Thrombosis (ACTION-CVT) study was a large multicenter international retrospective cohort study that enrolled consecutive patients with a confirmed diagnosis of CVT from January 2015 through December 2020 [17,19,20]. Patients were included from 27 centers in the United States, Europe, and New Zealand. Participating centers were tertiary care academic medical centers spanning multiple national models of care delivery.
Outcomes
A single primary outcome and a single secondary outcome were defined a priori. The primary outcome was presence of poor neurological outcome, defined as mRS 3–6, at 90-day follow-up. The secondary outcome was all-cause mortality.
Inclusion criteria
A total of 1,025 patients were enrolled in ACTION-CVT. Potential patients were identified using previously validated International Classification of Diseases, ninth revision (ICD-9; 325.0, 437.6, and 671.5) and ICD-10 codes (I67.6) with appropriate sensitivity and specificity for CVT [21,22]. The diagnosis of CVT was confirmed by review of the patient’s medical record and imaging studies by participating sites. Inclusion for each analysis was based on the presence of the required outcome variables at the specified time point.
Collected variables
Demographic factors, in-hospital treatments, follow-up variables, clinical, imaging, and laboratory factors were collected. All variables were collected via manual chart abstraction by investigators at participating sites. Standardized variable definitions were used. Substance use was defined as active smoking or non-medical use of drugs other than alcohol and tobacco. Hypercoagulable factors were defined as one or more antiphospholipid antibodies, protein C <65, protein S <70, antithrombin <80, factor V Leiden mutation, or prothrombin gene mutation. Collected variables are further described in a previous publication [17].
Statistical analysis
To ensure data integrity and consistency, data verification was conducted with queries sent to participating sites. Death was carried forward to future timepoints. Missing data were not imputed. Patients were included in the analysis for each outcome if the required outcome variables were available at the specified time point.
Factors included in the univariable analysis were selected based on previously shown associations with CVT outcomes or based on biological plausibility. Factors with low prognostic value (e.g., tracheostomy during hospitalization), a lack of biological plausibility (e.g., coronavirus disease 2019 [COVID-19] testing), or reflective of clinician treatment decisions (e.g., neurosurgical treatment), were not included. Demographic variables were also included in the univariable analysis due to previously identified disparities in CVT and other forms of stroke [5,23]. Univariable analysis of focal deficit was performed in patients without global deficit (i.e., encephalopathy and coma). Colinear factors were dichotomized, discarded, or combined as appropriate. Odds ratios (ORs) for continuous variables were calculated as ratio per unit.
For both univariable and multivariable analyses, outcomes were dichotomized based upon mRS score at the specified time point for each outcome. Between-group univariable comparisons were done by two-sided t-test, chi-square test, Fisher’s exact test, or rank sum test as appropriate. The univariable analysis was carried out only based on the primary outcome. Factors found to be associated in univariable analysis were fed into the multivariable analysis. Statistical significance for all analyses was set at α=0.05.
A risk scoring model was generated based upon the results of the multivariable analysis. A nomogram was generated based on the multivariable regression result of all potential prognostic factors (P<0.20) from the multivariable analysis. This variable filtering step increases the number of events per predictor variable, reducing the likelihood of model overfitting. The National Institutes of Health Stroke Scale (NIHSS) was divided into five discrete categories. The Liu method for cut-point estimation [24] was used for dichotomization: age was dichotomized at 50 years, creatinine was dichotomized at >1.0 mg/dL, and hemoglobin was dichotomized at ≥12.0 g/dL. Nomogram generated point values were rounded to the nearest integer to create the IN-REvASC score model containing nine factors: intracranial hemorrhage, NIHSS, Black race, encephalopathy or coma on presentation, age, anemia, substance use, creatinine, and active cancer (Figure 1). The previously described ISCVT-RS model score was calculated [10]. The prognostic value of both models was tested using a receiver operating characteristic curve under non-parametric assumptions. The area under the curve (AUC) was used to determine prognostic accuracy. Internal validation of models was performed using the bootstrap method with 100 iterations. Models were compared using the chi-square test. All data analyses were carried out using Stata version 15.1 (StataCorp., College Station, TX, USA).
Figure 1.

Prognostic models for poor outcome at 90-day follow-up. AUC, area under the curve; ISCVT-RS, International Study on Cerebral Vein and Dural Sinus Thrombosis risk score.
Results
Data were collected on 1,025 patients with CVT from 27 sites in the United States, Europe, and New Zealand. Baseline characteristics of the cohort are summarized in Table 1. The median age of included subjects was 44 years (interquartile range [IQR], 32 to 58), 62.7% (640) were women, and 15.7% (160) were Black. The median length of follow-up was 375 days (IQR, 180 to 747). Endovascular therapy was performed in 8.7% (89) of patients and 87.8% (900) patients were treated with oral anticoagulation [17]. There were 649 patients included in the primary analysis and 101 had poor outcome (Figure 2). In the univariable analysis, 11 factors were associated with poor outcome at 90 days and two factors were inversely associated with poor outcome at 90 days. These 13 factors were fed into the multivariable analyses (Table 2).
Table 1.
Demographic and baseline clinical characteristics of the ACTION-CVT study population
| Factor | No./total no. (%) | Median (IQR) |
|---|---|---|
| Age (yr) | 44 (32–58) | |
| Race | ||
| White | 710/1,018 (69.7) | |
| Black | 160/1,018 (15.7) | |
| Asian | 40/1,018 (3.9) | |
| Other | 108/1,018 (10.6) | |
| Ethnicity | ||
| Hispanic | 102/1,014 (10.1) | |
| Sex | ||
| Female | 643/1,025 (62.7) | |
| BMI (kg/m2) | 28.00 (23.88–33.10) | |
| Medical history | ||
| Chronic kidney disease | 39/1,023 (3.8) | |
| Active cancer | 67/1,023 (6.5) | |
| Prior DVT | 101/1,024 (9.9) | |
| Prior PE | 57/1,023 (5.6) | |
| Antiphospholipid syndrome | 11/1,001 (1.1) | |
| COVID-19 tested | 148/1,025 (14.4) | |
| COVID-19 positive | 8/148 (5.4) | |
| 12 Weeks postpartum | 38/1,016 (3.7) | |
| Recent mastoiditis or sinusitis | 89/1,025 (8.7) | |
| Recent lumbar puncture | 46/1,025 (4.5) | |
| Recent head trauma | 89/1,024 (8.7) | |
| Smoking | 146/1,019 (14.3) | |
| Alcohol abuse | 84/1,019 (8.2) | |
| Substance use | 59/1,019 (5.8) | |
| Family history of VTE | 101/1,018 (9.9) | |
| Medications | ||
| Antiplatelet | 104/1,024 (10.2) | |
| Warfarin | 39/1,025 (3.8) | |
| DOAC | 32/1,025 (3.1) | |
| Birth control | 235/1,007 (23.3) | |
| Days from symptoms to diagnosis | 4 (1–10) | |
| Previously discharged from ED with missed diagnosis | 157/1,024 (15.3) | |
| Symptoms | ||
| Headache | 762/1,023 (74.5) | |
| Focal deficit | 401/1,024 (39.2) | |
| Seizure | 243/1,024 (23.7) | |
| Encephalopathy | 209/1,024 (20.4) | |
| Coma | 29/1,024 (2.8) | |
| Papilledema | 100/958 (10.4) | |
| NIHSS | 0.00 (0.00–3.00) | |
| Imaging features | ||
| Venous infarct | 273/1,025 (26.6) | |
| Edema | 318/1,025 (31.0) | |
| Any hemorrhage | 390/1,025 (38.0) | |
| CVT location | ||
| Superficial veins | 745/1,023 (72.8) | |
| Deep veins | 118/1,023 (11.5) | |
| Cortical vein only | 30/1,023 (2.9) | |
| Both superficial and deep veins | 130/1,023 (12.7) | |
| Laboratory features | ||
| 1+ Antiphospholipid antibody positive | 82/839 (9.8) | |
| Protein C <65 | 60/571 (10.5) | |
| Protein S <70 | 120/559 (21.5) | |
| Antithrombin <80 | 82/572 (14.3) | |
| Factor V mutation | 47/679 (6.9) | |
| Prothrombin mutation | 32/635 (5.0) | |
| White blood count (103/mL) | 9.60 (7.40–12.50) | |
| Hemoglobin (g/dL) | 13.30 (11.70–14.70) | |
| Platelet count (103/mL) | 247.00 (200.00–309.00) | |
| Creatinine (mg/dL) | 0.80 (0.69–0.95) |
ACTION-CVT, Anticoagulation in the Treatment of Cerebral Venous Thrombosis; IQR, interquartile range; BMI, body mass index; DVT, deep vein thrombosis; PE, pulmonary embolism; COVID-19, coronavirus disease 2019; VTE, venous thromboembolism; DOAC, direct oral anticoagulation; ED, emergency department; NIHSS, National Institutes of Health Stroke Scale; CVT, cerebral venous thrombosis.
Figure 2.
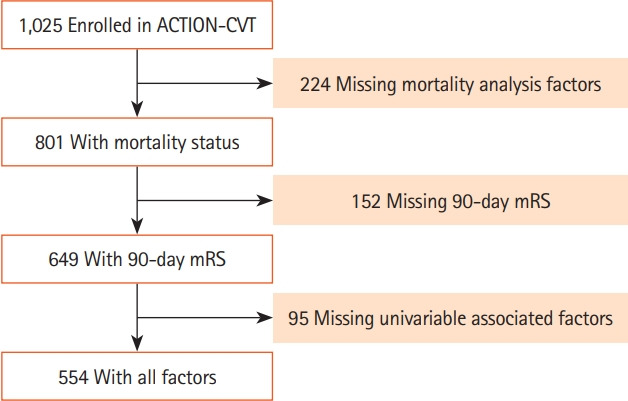
Study flow chart. ACTION-CVT, Anticoagulation in the Treatment of Cerebral Venous Thrombosis; mRS, modified Rankin Scale.
Table 2.
Univariable prognostic factors of poor neurological outcome at 90-day follow-up
| Factor | mRS 0–2 | mRS 3–6 | OR | 95% CI | P |
|---|---|---|---|---|---|
| Age (yr) | 43.95±16.0 | 51.95±16.79 | 1.03 | 1.02–1.04 | <0.001 |
| Race | |||||
| White | 393/546 (72.0) | 54/99 (54.5) | 0.47 | 0.30–0.72 | 0.001 |
| Black | 83/546 (15.2) | 29/99 (29.3) | 2.31 | 1.41–3.78 | 0.001 |
| Asian | 21/546 (3.8) | 2/99 (2.0) | 0.52 | 0.12–2.23 | 0.557 |
| Other | 49/546 (9.0) | 14/99 (14.1) | 1.67 | 0.88–3.16 | 0.111 |
| Ethnicity | |||||
| Hispanic | 61/547 (11.2) | 6/98 (6.1) | 0.52 | 0.22–1.24 | 0.133 |
| Sex | |||||
| Female | 352/548 (64.2) | 58/101 (57.4) | 0.75 | 0.49–1.16 | 0.192 |
| Medical history | |||||
| Active cancer | 15/548 (2.7) | 23/100 (23.0) | 10.61 | 5.31–21.22 | <0.001 |
| Prior VTE | 58/548 (10.6) | 18/101 (17.8) | 1.83 | 1.03–3.27 | 0.038 |
| Antiphospholipid syndrome | 7/548 (1.3) | 2/97 (2.1) | 1.63 | 0.33–7.95 | 0.631 |
| COVID-19 positive | 2/72 (2.8) | 2/20 (10.0) | 3.89 | 0.51–29.53 | 0.205 |
| 12 Weeks postpartum | 20/539 (3.7) | 2/101 (2.0) | 0.52 | 0.12–2.28 | 0.555 |
| Recent mastoiditis or sinusitis | 47/548 (8.6) | 10/101 (9.9) | 1.17 | 0.57–2.40 | 0.666 |
| Recent lumbar puncture | 24/548 (4.4) | 6/101 (5.9) | 1.38 | 0.55–3.46 | 0.492 |
| Recent head trauma | 52/548 (9.5) | 15/101 (14.9) | 1.66 | 0.90–3.09 | 0.104 |
| Substance use | 77/542 (14.2) | 25/100 (25.0) | 2.01 | 1.21–3.36 | 0.007 |
| Family history of VTE | 66/543 (12.2) | 6/100 (6.0) | 0.46 | 0.19–1.10 | 0.073 |
| Medications | |||||
| Warfarin | 14/548 (2.6) | 3/101 (3.0) | 1.17 | 0.33–4.14 | 0.737 |
| DOAC | 14/548 (2.6) | 4/101 (4.0) | 1.57 | 0.51–4.88 | 0.504 |
| Birth control | 138/534 (25.8) | 12/101 (11.9) | 0.39 | 0.21–0.73 | 0.002 |
| Days from symptoms to diagnosis | 4 (1–10) | 3 (0–8) | 1.00 | 0.99–1.01 | 0.055 |
| Previously discharged from ED with missed diagnosis | 85/548 (15.5) | 13/101 (12.9) | 0.81 | 0.43–1.51 | 0.496 |
| Symptoms | |||||
| Focal deficit | 147/450 (32.7) | 14/43 (32.6) | 1.00 | 0.51–1.94 | 0.988 |
| Seizure | 135/548 (24.6) | 28/101 (27.7) | 1.17 | 0.73–1.89 | 0.511 |
| Encephalopathy or coma | 98/548 (17.9) | 58/101 (57.4) | 6.19 | 3.95–9.72 | <0.001 |
| NIHSS | 0 (0–2) | 3.5 (1–12) | 1.11 | 1.07–1.14 | <0.001 |
| Imaging features | |||||
| Venous infarct | 145/548 (26.5) | 28/101 (27.7) | 1.07 | 0.66–1.72 | 0.792 |
| Edema | 161/548 (29.4) | 46/101 (45.5) | 2.01 | 1.30–3.10 | 0.001 |
| Any hemorrhage | 207/548 (37.8) | 52/101 (51.5) | 1.75 | 1.14–2.68 | 0.010 |
| CVT location | |||||
| Superficial veins | 385/547 (70.4) | 73/101 (72.3) | 1.10 | 0.68–1.76 | 0.701 |
| Deep veins | 71/547 (13.0) | 12/101 (11.9) | 0.90 | 0.47–1.74 | 0.761 |
| Cortical vein only | 14/547 (2.6) | 2/101 (2.0) | 0.77 | 0.17–3.44 | 1.000 |
| Both superficial and deep veins | 77/547 (14.1) | 14/101 (13.9) | 0.98 | 0.53–1.81 | 0.954 |
| Laboratory features | |||||
| 1+ Hypercoagulable factor | 198/548 (36.1) | 22/101 (21.8) | 0.49 | 0.30–0.82 | 0.005 |
| White blood count (103/mL) | 10.04±3.97 | 10.77±4.66 | 1.04 | 0.99–1.10 | 0.103 |
| Hemoglobin (g/dL) | 13.06±2.35 | 12.08±2.52 | 0.85 | 0.78–0.93 | <0.001 |
| Platelet count (103/mL) | 269.12±102.14 | 255.45±117.82 | 1.00 | 1.00–1.00 | 0.234 |
| PTT (sec) | 30.41±21.07 | 28.65±9.92 | 0.99 | 0.98–1.01 | 0.430 |
| Creatinine (mg/dL) | 0.84±0.26 | 0.9±0.37 | 1.95 | 1.00–3.81 | 0.048 |
Values are presented as mean±standard deviation or number/total number (%).
mRS, modified Rankin Scale; OR, odds ratio; CI, confidence interval; VTE, venous thromboembolism; COVID-19, coronavirus disease 2019; DOAC, direct oral anticoagulation; ED, emergency department; NIHSS, National Institutes of Health Stroke Scale; CVT, cerebral venous thrombosis; PTT, partial thromboplastin time.
Poor outcome at 90-day follow-up
At 90-day follow-up, 15.6% (101/649) of patients had poor outcome, mRS 3–6. Active cancer (OR, 11.20; 95% confidence interval [CI], 4.62 to 27.14; P<0.001), age (OR, 1.02 per year; 95% CI, 1.00 to 1.04; P=0.039), Black race (OR, 2.17; 95% CI, 1.10 to 4.27; P=0.025), encephalopathy or coma on presentation (OR, 2.71; 95% CI, 1.39 to 5.30; P=0.004), decreased hemoglobin (OR, 1.16 per g/dL; 95% CI, 1.03 to 1.31; P=0.014), higher NIHSS on presentation (OR, 1.07 per point; 95% CI, 1.02 to 1.11; P=0.002), and substance use (OR, 2.34; 95% CI, 1.16 to 4.71; P=0.017) were associated with poor outcome at 90 days follow-up (Table 3). Among patients with zero prognostic factors, 2.9% (7/239) had poor outcome at 90 days. Poor outcome at 90 days was present in 12.9% (31/240), 26.1% (29/111), and 57.6% (28/59) of patients with 1, 2, or 3+ prognostic factors, respectively.
Table 3.
Multivariable prognostic factors of poor outcome at 90-day follow-up and mortality
| Factor | Poor outcome |
Mortality |
||||
|---|---|---|---|---|---|---|
| OR | 95% CI | P | OR | 95% CI | P | |
| Active cancer | 11.20 | 4.62–27.14 | <0.001 | 12.17 | 5.45–27.16 | <0.001 |
| Age | 1.02 | 1.00–1.04 | 0.039 | 1.02 | 1.00–1.04 | 0.083 |
| Birth control | 1.17 | 0.52–2.65 | 0.700 | 0.32 | 0.07–1.47 | 0.143 |
| Black race | 2.17 | 1.10–4.27 | 0.025 | 2.62 | 1.20–5.69 | 0.015 |
| Creatinine | 1.97 | 0.72–5.33 | 0.185 | 1.40 | 0.68–2.86 | 0.361 |
| Encephalopathy or coma | 2.71 | 1.39–5.30 | 0.004 | 1.72 | 0.79–3.76 | 0.170 |
| Hemoglobin | 0.86 | 0.77–0.97 | 0.014 | 0.97 | 0.85–1.10 | 0.618 |
| 1+ Hypercoagulable factor | 0.88 | 0.46–1.69 | 0.694 | 0.93 | 0.40–2.14 | 0.857 |
| Cerebral edema on imaging | 0.89 | 0.46–1.72 | 0.726 | 0.90 | 0.41–1.96 | 0.789 |
| Hemorrhage on imaging | 1.62 | 0.85–3.09 | 0.145 | 1.73 | 0.79–3.78 | 0.171 |
| NIHSS | 1.07 | 1.02–1.11 | 0.002 | 1.02 | 0.98–1.07 | 0.338 |
| Prior VTE | 1.64 | 0.71–3.77 | 0.246 | 0.91 | 0.35–2.36 | 0.845 |
| Substance use | 2.34 | 1.16–4.71 | 0.017 | 2.17 | 1.03–4.60 | 0.042 |
OR, odds ratio; CI, confidence interval; NIHSS, National Institutes of Health Stroke Scale; VTE, venous thromboembolism.
Mortality
Mortality in the cohort was 6.6% (43/649) at 90-day follow-up and the in-hospital mortality was 3.9% (25/649) during this time period. Mortality was 6.8% (70/1,025) at last follow-up (median 375 days [IQR, 180 to 747]). The incidence rate for mortality was 5.13 per 100 person-years with a median follow-up of 375 days. Active cancer (OR, 12.17; 95% CI, 5.45 to 27.16; P<0.001), Black race (OR, 2.62; 95% CI, 1.20 to 5.69; P=0.015), and substance use (OR, 2.17; 95% CI, 1.03 to 4.60; P=0.042) were associated with mortality (Table 3).
IN-REvASC score
The IN-REvASC score used nine factors simplified from a nomogram regression: Intracranial hemorrhage, NIHSS, Black Race, Encephalopathy or coma at admission, Age, Anemia, Substance use, Creatinine, and active Cancer. Intracranial hemorrhage was assigned one point. Anemia, defined as hemoglobin less than 12.0 mg/dL, and creatinine greater than 1.0 mg/dL were assigned two points. Black race and age greater than 50 were assigned three points. Encephalopathy or coma on presentation and substance use were assigned four points. NIHSS of 1–10 was assigned two points, 11–20 was assigned four points, 21–30 was assigned six points, and greater than 30 was assigned eight points. Active cancer was assigned 10 points (Figure 1).
The IN-REvASC (AUC, 0.84; 95% CI, 0.78 to 0.89) score outperformed ISCVT-RS (AUC, 0.71; 95% CI, 0.66 to 0.77; χ2 P<0.001) for the prediction of poor outcome at 90-day follow-up. The probability of poor outcome in those with a low risk, IN-REvASC <10, was 5.1% (23/447) (Figure 1). For those with a moderate risk, IN-REvASC ≥10 to <20, the probability was 38.8% (40/103). For those with a high risk, IN-REvASC ≥20, the probability was 90.0% (9/10) (Figure 3).
Figure 3.
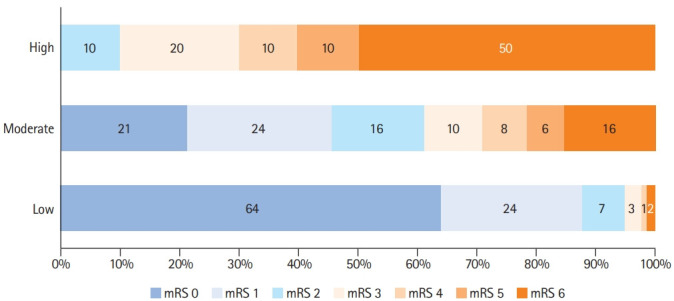
Distribution of scores on the modified Rankin Scale (mRS) at 90 days according to IN-REvASC risk groups.
The IN-REvASC score (AUC, 0.84; 95% CI, 0.78 to 0.90) outperformed ISCVT-RS (AUC, 0.72; 95% CI, 0.66 to 0.79; χ2 P=0.03) for the prediction of mortality. For those in the low (IN-REvASC <10), moderate (IN-REvASC ≥10 to <20), and high (IN-REvASC ≥20) risk categories, the mortality risks were 1.9% (12/642), 15.3% (24/157), and 37.5% (6/16), respectively.
Losses to follow-up
Of the total study population, 16.3% (167/1025) were lost to follow-up prior to 90 days. Those lost to follow-up were less likely to be female, more likely to have substance use, and had higher median NIHSS on presentation compared to those with 90-day or greater follow-up. However, there were no differences in rates of in-hospital interventions (intubation, neurosurgical treatment, percutaneous endoscopic gastrostomy placement, tracheostomy) suggesting a similar clinical course as those with follow-up (Table 4).
Table 4.
Comparison of patients with and without 90-day follow-up
| Factor | <90-day follow-up | ≥90-day follow-up | P |
|---|---|---|---|
| Age (yr) | 47.19±17.77 | 45.19±16.64 | 0.163 |
| Race | |||
| White | 109/165 (66.1) | 577/812 (71.1) | 0.201 |
| Black | 23/165 (13.9) | 126/812 (15.5) | 0.607 |
| Asian | 10/165 (6.1) | 29/812 (3.6) | 0.136 |
| Other | 23/165 (13.9) | 80/812 (9.9) | 0.119 |
| Ethnicity | |||
| Hispanic | 19/162 (11.7) | 83/811 (10.2) | 0.571 |
| Sex | |||
| Female | 94/167 (56.3) | 531/817 (65.0) | 0.033 |
| BMI (kg/m2) | 28.17±6.76 | 29.64±7.72 | 0.024 |
| Medical history | |||
| Chronic kidney disease | 11/167 (6.6) | 25/815 (3.1) | 0.027 |
| Active cancer | 13/167 (7.8) | 38/815 (4.7) | 0.098 |
| Prior VTE | 18/167 (10.8) | 96/817 (11.8) | 0.721 |
| Antiphospholipid syndrome | 1/158 (0.6) | 10/805 (1.2) | 1.000 |
| COVID-19 tested | 40/167 (24.0) | 98/817 (12.0) | 0.000 |
| COVID-19 positive | 2/40 (5.0) | 4/98 (4.1) | 1.000 |
| 12 Weeks postpartum | 8/165 (4.8) | 28/810 (3.5) | 0.388 |
| Recent mastoiditis or sinusitis | 19/167 (11.4) | 68/817 (8.3) | 0.205 |
| Recent lumbar puncture | 10/167 (6.0) | 34/817 (4.2) | 0.298 |
| Recent head trauma | 16/167 (9.6) | 67/816 (8.2) | 0.562 |
| Smoking | 35/167 (21.0) | 102/811 (12.6) | 0.004 |
| Alcohol abuse | 21/167 (12.6) | 58/811 (7.2) | 0.019 |
| Substance use | 40/167 (24.0) | 120/810 (14.8) | 0.016 |
| Family history of VTE | 13/167 (7.8) | 87/810 (10.7) | 0.251 |
| Medications | |||
| Antiplatelet | 13/167 (7.8) | 85/816 (10.4) | 0.301 |
| Warfarin | 10/167 (6.0) | 28/817 (3.4) | 0.118 |
| DOAC | 5/167 (3.0) | 25/817 (3.1) | 1.000 |
| Birth control | 40/163 (24.5) | 192/803 (23.9) | 0.864 |
| Days from symptoms to diagnosis | 3.0 (1.0–7.0) | 4.0 (1.0–10.0) | 0.029 |
| Previously discharged from ED with missed diagnosis | 27/167 (16.2) | 126/816 (15.4) | 0.813 |
| Symptoms | |||
| Focal deficit | 42/127 (33.1) | 230/657 (35.0) | 0.675 |
| Seizure | 39/167 (23.4) | 198/816 (24.3) | 0.802 |
| Encephalopathy or coma | 40/167 (24.0) | 159/816 (19.5) | 0.191 |
| Papilledema | 7/154 (4.5) | 88/766 (11.5) | 0.010 |
| NIHSS | 1.0 (0.0–4.0) | 0.0 (0.0–2.0) | 0.004 |
| Imaging features | |||
| Venous infarct | 47/167 (28.1) | 214/817 (26.2) | 0.603 |
| Edema | 54/167 (32.3) | 247/817 (30.2) | 0.591 |
| Any hemorrhage | 62/167 (37.1) | 309/817 (37.8) | 0.866 |
| CVT location | |||
| Superficial veins | 125/167 (74.9) | 587/815 (72.0) | 0.456 |
| Deep veins | 19/167 (11.4) | 93/815 (11.4) | 0.990 |
| Cortical vein only | 5/167 (3.0) | 25/815 (3.1) | 1.000 |
| Both superficial and deep veins | 18/167 (10.8) | 110/815 (13.5) | 0.342 |
| Laboratory features | |||
| 1+ Antiphospholipid antibody positive | 8/123 (6.5) | 72/690 (10.4) | 0.178 |
| Protein C <65 | 10/67 (14.9) | 48/492 (9.8) | 0.193 |
| Protein S <70 | 15/64 (23.4) | 103/484 (21.3) | 0.693 |
| Antithrombin <80 | 11/66 (16.7) | 69/498 (13.9) | 0.538 |
| Factor V mutation | 5/94 (5.3) | 42/571 (7.4) | 0.663 |
| Prothrombin mutation | 2/87 (2.3) | 30/535 (5.6) | 0.294 |
| 1+ Hypercoagulable factor | 37/167 (22.2) | 277/817 (33.9) | 0.003 |
| White blood count (103/mL) | 10.72±4.12 | 10.05±4.12 | 0.059 |
| Hemoglobin (g/dL) | 13.07±2.38 | 13.02±2.42 | 0.842 |
| Platelet count (103/mL) | 259.88±95.19 | 266.32±103.66 | 0.463 |
| Creatinine (mg/dL) | 0.94±0.81 | 0.85±0.33 | 0.025 |
| Hospital course | |||
| Intubation | 20/167 (12.0) | 90/816 (11.0) | 0.724 |
| Tracheostomy | 2/167 (1.2) | 21/817 (2.6) | 0.403 |
| PEG tube insertion | 6/167 (3.6) | 25/817 (3.1) | 0.719 |
| Neurosurgical treatment | 6/167 (3.6) | 45/817 (5.5) | 0.309 |
Values are presented as mean±standard deviation, number/total number (%), or median (interquartile range).
BMI, body mass index; DVT, deep vein thrombosis; COVID-19, coronavirus disease 2019; DOAC, direct oral anticoagulation; ED, emergency department; NIHSS, National Institutes of Health Stroke Scale; CVT, cerebral venous thrombosis; PEG, percutaneous endoscopic gastrostomy.
Discussion
In this large, multicenter, international cohort study, we found that in patients with CVT, active cancer, age, Black race, encephalopathy or coma on presentation, decreased hemoglobin, higher NIHSS on presentation, and substance use were associated with poor outcome, defined as mRS 3–6, at 90 days. In contrast to prior reports, sex, clot location, and birth control [3,5] use were not associated with poor outcomes in this study.
Two prognostic score models were tested in our cohort: IN-REvASC and ISCVT-RS. In line with previous publications, ISCVT-RS achieved an AUC of 0.71 for poor 90-day outcome and 0.72 for mortality when tested in our cohort. However, three of the six scoring factors used in ISCVT-RS, male gender, parenchymal hemorrhage, and deep thrombus location, were not associated with poor outcome in our study. Compared to ISCVT-RS, the IN-REvASC score offers increased ease of use and improvement in prognostic accuracy with an AUC of 0.84 for poor 90-day outcome and 0.84 for mortality. The IN-REvASC score uses a series of factors associated with poor outcome and readily available clinical data in usual clinical practice increasing the ease of use. The nomogram scoring method used to generate IN-REvASC allows for the evaluation of a complex regression without any calculation required. IN-REvASC score cutoffs stratify patients into low, moderate, and high-risk groups for both poor outcome at 90-day follow-up and mortality. For those in the low-risk group, the probability of poor outcome was 5.1% (23/447) and the probability of mortality was 1.9% (12/642). For the moderate-risk group, these probabilities were 38.8% (40/103) and 15.3% (24/157). For the high-risk group, these probabilities were 90.0% (9/10) and 37.5% (6/16).
Prior studies have demonstrated that the presence of neurological symptoms is associated with worse outcome following CVT [3,5,7,25,26]. This study more specifically characterizes the association, demonstrating that increasing severity of neurological symptoms, as measured by NIHSS, is associated with higher odds of poor neurological outcome at 90 days. Encephalopathy or coma on presentation were also associated with poor 90-day outcome suggesting that both the overall severity of neurological symptoms as well as their localization are important.
In this study, we noted that Black race was associated with poor outcomes following CVT. Specifically, Black race was associated with an increased rate of poor neurologic outcome at 90 days (OR, 2.17) and increased mortality (OR, 2.62). In prior ischemic stroke literature, Black race was also associated with poor outcomes indicating that this racial disparity in outcomes is present across multiple forms of stroke [23]. Additionally, the incidence of CVT has been observed to be significantly higher in Black populations [27]. Taken together, Black patients are disproportionately more likely to experience CVT and more likely to experience poor outcomes. This disparity is likely the result of differences in social determinants of health, inequities in healthcare access, and experiences of structural racism between racial groups [28-32]. Importantly, the inclusion of race as a factor in the IN-REvASC score is an acknowledgement of an observed disparity only, not a statement of an intrinsic biological difference in CVT between racial groups. Caution should be taken when using these results to inform the care of individual patients and when enrolling patients in future studies. Future research is essential to identify and address the factors leading to these disparities.
Active cancer was associated with poor outcome at 90-day follow-up and mortality, and was the strongest prognostic factor for both outcomes, in agreement with previous literature [5,6]. Anemia has been previously identified as a risk factor for poor outcome following both ischemic stoke [33] and CVT [34] and, in our study, decreased hemoglobin was associated with poor outcome at 90-day follow-up. Serum creatinine greater than 1.0 mg/dL was also associated with poor outcome implicating poor renal function or hydration status in recovery after CVT, the latter of which has been previously suggested as a driver of poor outcome in CVT patients [35].
Evidence for the role of sex in CVT outcomes is mixed. The ISCVT study noted a disparity in outcomes by sex, explained by the presence of sex-specific risk factors such as pregnancy and oral contraceptives, while multiple other studies failed to show this disparity [3,7,36,37]. In this study, no difference in 90-day outcome was observed by sex or by peripartum status, and the use of birth control was not associated with poor outcome at 90-day follow-up or mortality in the multivariable analyses. Thus, providers should not assume a better or worse prognosis following CVT provoked by sex-specific risk factors.
Mortality in the ACTION-CVT cohort was lower than in previous studies. Compared to ISCVT, baseline patient characteristics were similar, and the rate of poor neurological outcome was similar between the studies. However, death during follow-up was less frequent at a rate of 5.12 per 100 person-years in ACTION-CVT, compared to 5.38 per 100 person-years in ISCVT [5]. This mortality reduction may be due to improvements in stroke care and CVT diagnosis since the publication of ISCVT.
The prognostic factors identified in this study stratify patients into risk groups for poor outcome. The presence of zero risk factors identifies 36.8% (239/649) of the cohort with a much lower risk of poor outcome compared with the overall cohort (2.9% vs. 15.6%; 7/239 vs. 101/649; OR, 0.19). Meanwhile, the presence of three or more risk factors identifies a small subset of the cohort with a much higher risk of poor outcome compared with the overall cohort (57.6% vs. 15.6%; 28/59 vs. 101/649; OR, 3.70).
Risk stratification using the prognostic scores generated here may identify a group of patients with higher severity of illness who may benefit from new therapies, such as endovascular clot retrieval, in future trials. The recent Thrombolysis or Anti-coagulation for Cerebral Venous Thrombosis (TO-ACT) trial was stopped early as it was unable to meet its primary endpoint, despite an absolute reduction in the proportion of patients with a poor outcome at follow-up [38]. However, future trials may show a benefit with endovascular therapy if conducted in patients at the highest risk of poor outcome.
While this work represents the largest study of patients with CVT to date, it is limited due to its observational, retrospective design. Bias may exist in this data due to the lack of standardized treatment protocol and observed differences may be due to a treatment effect rather than the variable under study. Allcause mortality was used in this study and deaths observed may not have been due to CVT directly, especially in patients with comorbidities such as active cancer. However, in comparison to disease-specific mortality, all-cause mortality is not susceptible to misclassification bias. Standardized training for the assessment of mRS was not provided to participating centers. Although the mRS scores were generated by either the treating clinician or experienced researchers and stroke coordinators, previous research has noted only moderate inter-rater reliability of mRS scores, potentially decreasing statistical power [39]. Patients lost to follow-up prior to 90-day were a substantial minority of the study population. Based upon available data, those lost to follow-up likely had a similar clinical course as those with follow-up. The higher rate of substance use and higher median NIHSS would contribute a bias towards the null for an effect of these variables on both poor outcome and mortality. This study was conducted prior to the introduction of COVID-19 vaccinations, as a result, CVT cases caused by vaccine induced thrombotic thrombocytopenia were not captured. Although internal validation of models was conducted using the bootstrap method, the prognostic model of this study should be interpreted with caution. External validation of the IN-REvASC model is important for future study. It is unknown whether this score is generalizable to populations with substantially different patient characteristics or healthcare settings. Finally, the primary outcome of this study, mRS 3–6 at 90-day follow-up, was low at 15.6%. While this is consistent with prior studies [5,40], it is possible that other factors such as concomitant COVID-19 infection [41,42] are relevant in the prognostication of CVT but were undetected in this study due to a small effect size.
Conclusions
Active cancer, age, Black race, encephalopathy or coma on presentation, decreased hemoglobin, higher NIHSS on presentation, and substance use were associated with poor outcome at 90-day follow-up following CVT. Active cancer, Black race, and substance use were also associated with mortality. The racial disparity in CVT outcomes, while in alignment with other types of stroke, requires further study. In contrast to previous literature, sex, clot location, and birth control use were not associated with any primary or secondary outcome in this study. These factors may not confer as high prognostic value to CVT as previously thought. The derived IN-REvASC model offers increased prognostic accuracy for the prediction of poor outcome at 90- day follow-up and mortality, compared to ISCVT-RS. IN-REvASC score cutoffs stratified patients into groups with significantly different outcomes at 90-day follow-up. Improved prognostication may aid in clinical decision making and allow for identification of patients with the possibility of benefit in future clinical trials.
Acknowledgments
This work has been partially supported by the Italian Ministry of Health Ricerca Corrente–IRCCS Multimedica. The complete list of members and affiliations can be found in Appendix 1.
Appendix 1. The ACTION-CVT study group
| Author | Affiliation |
|---|---|
| Ekaterina Bakradze | Department of Neurology, University of Alabama at Birmingham, Birmingham, Alabama, USA |
| James A. Giles | Department of Neurology, Washington University, Saint Louis, MO, USA |
| Jordan Y. Amar | Department of Neurology, Washington University, Saint Louis, MO, USA |
| Nils Henninger | Department of Neurology, University of Massachusetts, Worcester, MA, USA; Department of Psychiatry, University of Massachusetts, Worcester, MA, USA |
| Marwa Elnazeir | Department of Neurology, University of Massachusetts, Worcester, MA, USA |
| Ava L. Liberman | Department of Neurology, Weill Cornell Medical Center, New York, NY, USA |
| Khadean Moncrieffe | Department of Neurology, Montefiore Medical Center, New York, NY, USA |
| Jenny Lu | Department of Neurology, Montefiore Medical Center, New York, NY, USA |
| Richa Sharma | Department of Neurology, Yale University, New Haven, CT, USA |
| Yee Cheng | Department of Neurology, Yale University, New Haven, CT, USA |
| Adeel S. Zubair | Department of Neurology, Yale University, New Haven, CT, USA |
| Grace T. Li | Department of Neurology, University of Florida, Gainesville, FL, USA |
| Justin Chi Kung | Department of Neurology, University of Florida, Gainesville, FL, USA |
| Dezaray Perez | Department of Neurology, University of Florida, Gainesville, FL, USA |
| Adrian Scutelnic | Department of Neurology, Inselspital Universitätsspital, Bern, Switzerland |
| David Seiffge | Department of Neurology, Inselspital Universitätsspital, Bern, Switzerland |
| Bernhard Siepen | Department of Neurology, Inselspital Universitätsspital, Bern, Switzerland |
| Aaron Rothstein | Department of Neurology, University of Pennsylvania, Philadelphia, PA, USA |
| Ossama Khazaal | Department of Neurology, University of Pennsylvania, Philadelphia, PA, USA |
| David Do | Department of Neurology, University of Pennsylvania, Philadelphia, PA, USA |
| Sami Al Kasab | Department of Neurology, Medical University of South Carolina, Charleston, SC, USA; Department of Neurosurgery, Medical University of South Carolina, Charleston, SC, USA |
| Line Abdul Rahman | Department of Neurology, Medical University of South Carolina, Charleston, SC, USA |
| Eva A. Mistry | Department of Neurology and Rehabilitation Medicine, University of Cincinnati College of Medicine, Cincinnati, OH, USA |
| Deborah Kerrigan | Department of Neurology, Vanderbilt University, Nashville, TN, USA |
| Hayden Lafever | Department of Neurology, Vanderbilt University, Nashville, TN, USA |
| Jennifer Frontera | Department of Neurology, New York University, New York, NY, USA |
| Lindsey Kuohn | Department of Neurology, New York University, New York, NY, USA |
| Shashank Agarwal | Department of Neurology, New York University, New York, NY, USA |
| Christoph Stretz | Department of Neurology, Brown University, Providence, RI, USA |
| Narendra Kala | Department of Neurology, Brown University, Providence, RI, USA |
| Sleiman El Jamal | Department of Neurology, Brown University, Providence, RI, USA |
| Alison Chang | Department of Neurology, Brown University, Providence, RI, USA |
| Shawna Cutting | Department of Neurology, Brown University, Providence, RI, USA |
| Han Xiao | Department of Biostatistics, University of California Santa Barbara, Santa Barbara, CA, USA |
| Varsha Muddasani | Department of Neurology, University of Utah, Salt Lake City, UT, USA |
| Teddy Wu | Department of Neurology, Christchurch Hospital, Christchurch, New Zealand |
| Duncan Wilson | Department of Neurology, Christchurch Hospital, Christchurch, New Zealand |
| Amre Nouh | Department of Neurology, Hartford Hospital, Hartford, CT, USA |
| Syed Daniyal Assad | Department of Neurology, Hartford Hospital, Hartford, CT, USA |
| Abid Qureshi | Department of Neurology, University of Kansas, Kansas City, KS, USA |
| Justin Moore | Department of Neurology, University of Kansas, Kansas City, KS, USA |
| Pooja Khatri | Department of Neurology and Rehabilitation Medicine, University of Cincinnati College of Medicine, Cincinnati, OH, USA |
| Yasmin Aziz | Department of Neurology and Rehabilitation Medicine, University of Cincinnati College of Medicine, Cincinnati, OH, USA |
| Bryce Casteigne | Department of Neurology and Rehabilitation Medicine, University of Cincinnati College of Medicine, Cincinnati, OH, USA |
| Muhib Khan | Department of Neurology, Spectrum Health, Michigan State University, Grand Rapids, MI, USA |
| Yao Cheng | Department of Neurology, Spectrum Health, Michigan State University, Grand Rapids, MI, USA |
| Brian Mac Grory | Department of Neurology, Duke University, Durham, NC, USA |
| Martin Weiss | Department of Neurology, Duke University, Durham, NC, USA |
| Dylan Ryan | Department of Neurology, Duke University, Durham, NC, USA |
| Scott Kamen | Department of Neurology, Cooper University, Camden, NJ, USA |
| Siyuan Yu | Department of Neurology, Cooper University, Camden, NJ, USA |
| Christopher R. Leon Guerrero | Department of Neurology, George Washington University, District of Columbia, USA |
| Eugenie Atallah | Department of Neurology, George Washington University, District of Columbia, USA |
| Gian Marco De Marchis | Department of Neurology, University Hospital Basel and University of Basel, Basel, Switzerland |
| Alex Brehm | Department of interventional and diagnostic Neuroradiology, Clinic of Radiology and Nuclear Medicine, University Hospital Basel and University of Basel, Basel, Switzerland |
| Tolga Dittrich | Department of Neurology, University Hospital Basel and University of Basel, Basel, Switzerland |
| Ronald Alvarado-Dyer | Department of Neurology, University of Chicago, Chicago, IL, USA |
| Tareq Kass-Hout | Department of Neurology, University of Chicago, Chicago, IL, USA |
| Shyam Prabhakaran | Department of Neurology, University of Chicago, Chicago, IL, USA |
| Tristan Honda | Department of Neurology, University of California at Los Angeles, Los Angeles, CA, USA |
| Karen Furie | Department of Neurology, Brown University, Providence, RI, USA |
Footnotes
Disclosure
Thanh Nguyen reports research support from Medtronic and the Society of Vascular and Interventional Neurology. Maurizio Paciaroni reports speaker honoraria from Sanofi-Aventis; Boehringer-Ingelheim, Bayer, BMS, Daiichi-Sankyo, Pfizer. Diana Aguiar de Sousa reports speaker fees from Bayer, travel support from Boehringer Ingelheim, participating in an advisory board for AstraZeneca, and DSMB participation for the SECRET trial, outside the submitted work.
Supplementary materials
Supplementary materials related to this article can be found online at https://doi.org/10.5853/jos.2022.01606.
TRIPOD reporting guidelines checklist
References
- 1.Devasagayam S, Wyatt B, Leyden J, Kleinig T. Cerebral venous sinus thrombosis incidence is higher than previously thought: a retrospective population-based study. Stroke. 2016;47:2180–2182. doi: 10.1161/STROKEAHA.116.013617. [DOI] [PubMed] [Google Scholar]
- 2.Coutinho JM, Zuurbier SM, Aramideh M, Stam J. The incidence of cerebral venous thrombosis: a cross-sectional study. Stroke. 2012;43:3375–3377. doi: 10.1161/STROKEAHA.112.671453. [DOI] [PubMed] [Google Scholar]
- 3.Salottolo K, Wagner J, Frei DF, Loy D, Bellon RJ, McCarthy K, et al. Epidemiology, endovascular treatment, and prognosis of cerebral venous thrombosis: US center study of 152 patients. J Am Heart Assoc. 2017;6:e005480. doi: 10.1161/JAHA.117.005480. [DOI] [PMC free article] [PubMed] [Google Scholar]
- 4.Ropper AH, Klein JP. Cerebral venous thrombosis. N Engl J Med. 2021;385:59–64. doi: 10.1056/NEJMra2106545. [DOI] [PubMed] [Google Scholar]
- 5.Ferro JM, Canhão P, Stam J, Bousser MG, Barinagarrementeria F, ISCVT Investigators Prognosis of cerebral vein and dural sinus thrombosis: results of the International Study on Cerebral Vein and Dural Sinus Thrombosis (ISCVT) Stroke. 2004;35:664–670. doi: 10.1161/01.STR.0000117571.76197.26. [DOI] [PubMed] [Google Scholar]
- 6.Borhani Haghighi A, Edgell RC, Cruz-Flores S, Feen E, Piriyawat P, Vora N, et al. Mortality of cerebral venous-sinus thrombosis in a large national sample. Stroke. 2012;43:262–264. doi: 10.1161/STROKEAHA.111.635664. [DOI] [PubMed] [Google Scholar]
- 7.Korathanakhun P, Sathirapanya P, Geater SL, Petpichetchian W. Predictors of hospital outcome in patients with cerebral venous thrombosis. J Stroke Cerebrovasc Dis. 2014;23:2725–2729. doi: 10.1016/j.jstrokecerebrovasdis.2014.06.020. [DOI] [PubMed] [Google Scholar]
- 8.Duman T, Uluduz D, Midi I, Bektas H, Kablan Y, Goksel BK, et al. A multicenter study of 1144 patients with cerebral venous thrombosis: the VENOST Study. J Stroke Cerebrovasc Dis. 2017;26:1848–1857. doi: 10.1016/j.jstrokecerebrovasdis.2017.04.020. [DOI] [PubMed] [Google Scholar]
- 9.Wasay M, Kaul S, Menon B, Dai AI, Saadatnia M, Malik A, et al. Asian study of cerebral venous thrombosis. J Stroke Cerebrovasc Dis. 2019;28:104247. doi: 10.1016/j.jstrokecerebrovasdis.2019.06.005. [DOI] [PubMed] [Google Scholar]
- 10.Ferro JM, Bacelar-Nicolau H, Rodrigues T, Bacelar-Nicolau L, Canhão P, Crassard I, et al. Risk score to predict the outcome of patients with cerebral vein and dural sinus thrombosis. Cerebrovasc Dis. 2009;28:39–44. doi: 10.1159/000215942. [DOI] [PubMed] [Google Scholar]
- 11.Barboza MA, Chiquete E, Arauz A, Merlos-Benitez M, Quiroz-Compeán A, Barinagarrementería F, et al. A practical score for prediction of outcome after cerebral venous thrombosis. Front Neurol. 2018;9:882. doi: 10.3389/fneur.2018.00882. [DOI] [PMC free article] [PubMed] [Google Scholar]
- 12.Poungvarin N, Prayoonwiwat N, Ratanakorn D, Towanabut S, Tantirittisak T, Suwanwela N, et al. Thai venous stroke prognostic score: TV-SPSS. J Med Assoc Thai. 2009;92:1413–1422. [PubMed] [Google Scholar]
- 13.Koopman K, Uyttenboogaart M, Vroomen PC, van der Meer J, De Keyser J, Luijckx GJ. Development and validation of a predictive outcome score of cerebral venous thrombosis. J Neurol Sci. 2009;276:66–68. doi: 10.1016/j.jns.2008.08.033. [DOI] [PubMed] [Google Scholar]
- 14.Barinagarrementeria F, Cantu C, Arredondo H. Aseptic cerebral venous thrombosis: proposed prognostic scale. J Stroke Cerebrovasc Dis. 1992;2:34–39. doi: 10.1016/S1052-3057(10)80032-1. [DOI] [PubMed] [Google Scholar]
- 15.Eskey CJ, Meyers PM, Nguyen TN, Ansari SA, Jayaraman M, McDougall CG, et al. Indications for the performance of intracranial endovascular neurointerventional procedures: a scientific statement from the American Heart Association. Circulation. 2018;137:e661–e689. doi: 10.1161/CIR.0000000000000567. [DOI] [PubMed] [Google Scholar]
- 16.Ferro JM, Coutinho JM, Dentali F, Kobayashi A, Alasheev A, Canhão P, et al. Safety and efficacy of dabigatran etexilate vs dose-adjusted warfarin in patients with cerebral venous thrombosis: a randomized clinical trial. JAMA Neurol. 2019;76:1457–1465. doi: 10.1001/jamaneurol.2019.2764. [DOI] [PMC free article] [PubMed] [Google Scholar]
- 17.Yaghi S, Shu L, Bakradze E, Salehi Omran S, Giles JA, Amar JY, et al. Direct oral anticoagulants versus warfarin in the treatment of cerebral venous thrombosis (ACTION-CVT): a multicenter international study. Stroke. 2022;53:728–738. doi: 10.1161/STROKEAHA.121.037541. [DOI] [PubMed] [Google Scholar]
- 18.Alimohammadi A, Kim DJ, Field TS. Updates in cerebral venous thrombosis. Curr Cardiol Rep. 2022;24:43–50. doi: 10.1007/s11886-021-01622-z. [DOI] [PMC free article] [PubMed] [Google Scholar]
- 19.Shu L, Bakradze E, Salehi Omran S, Giles JA, Amar JY, Henninger N, et al. Predictors of recurrent venous thrombosis after cerebral venous thrombosis: analysis of the ACTION-CVT Study. Neurology. doi: 10.1212/WNL.0000000000201122. 2022 Forthcoming. [DOI] [PMC free article] [PubMed] [Google Scholar]
- 20.Siegler JE, Shu L, Yaghi S, Salehi Omran S, Elnazeir M, Bakradze E, et al. Endovascular therapy for cerebral vein thrombosis: a propensity-matched analysis of anticoagulation in the treatment of cerebral venous thrombosis. Neurosurgery. 2022 Aug 23; doi: 10.1227/neu.0000000000002098. [Epub]. [DOI] [PubMed] [Google Scholar]
- 21.Liberman AL, Kamel H, Mullen MT, Messé SR. International Classification of Diseases, ninth revision (ICD-9) diagnosis codes can identify cerebral venous thrombosis in hospitalized adults. Neurohospitalist. 2016;6:147–150. doi: 10.1177/1941874416648198. [DOI] [PMC free article] [PubMed] [Google Scholar]
- 22.Handley JD, Emsley HC. Validation of ICD-10 codes shows intracranial venous thrombosis incidence to be higher than previously reported. Health Inf Manag. 2020;49:58–61. doi: 10.1177/1833358318819105. [DOI] [PubMed] [Google Scholar]
- 23.Burke JF, Freedman VA, Lisabeth LD, Brown DL, Haggins A, Skolarus LE. Racial differences in disability after stroke: results from a nationwide study. Neurology. 2014;83:390–397. doi: 10.1212/WNL.0000000000000640. [DOI] [PMC free article] [PubMed] [Google Scholar]
- 24.Clayton P. IDEAS; CUTPT: Stata module for empirical estimation of cutpoint for a diagnostic test. https://ideas.repec.org/c/boc/bocode/s457719.html. 2013. Accessed August 30, 2022. [Google Scholar]
- 25.Canhão P, Ferro JM, Lindgren AG, Bousser MG, Stam J, Barinagarrementeria F, et al. Causes and predictors of death in cerebral venous thrombosis. Stroke. 2005;36:1720–1725. doi: 10.1161/01.STR.0000173152.84438.1c. [DOI] [PubMed] [Google Scholar]
- 26.Girot M, Ferro JM, Canhão P, Stam J, Bousser MG, Barinagarrementeria F, et al. Predictors of outcome in patients with cerebral venous thrombosis and intracerebral hemorrhage. Stroke. 2007;38:337–342. doi: 10.1161/01.STR.0000254579.16319.35. [DOI] [PubMed] [Google Scholar]
- 27.Otite FO, Patel S, Sharma R, Khandwala P, Desai D, Latorre JG, et al. Trends in incidence and epidemiologic characteristics of cerebral venous thrombosis in the United States. Neurology. 2020;95:e2200–e2213. doi: 10.1212/WNL.0000000000010598. [DOI] [PMC free article] [PubMed] [Google Scholar]
- 28.Williams O, Ovbiagele B. Stroking out while Black: the complex role of racism. JAMA Neurol. 2020;77:1343–1344. doi: 10.1001/jamaneurol.2020.3510. [DOI] [PubMed] [Google Scholar]
- 29.Levine DA, Duncan PW, Nguyen-Huynh MN, Ogedegbe OG. Interventions targeting racial/ethnic disparities in stroke prevention and treatment. Stroke. 2020;51:3425–3432. doi: 10.1161/STROKEAHA.120.030427. [DOI] [PMC free article] [PubMed] [Google Scholar]
- 30.Churchwell K, Elkind MS, Benjamin RM, Carson AP, Chang EK, Lawrence W, et al. Call to action: structural racism as a fundamental driver of health disparities: a presidential advisory from the American Heart Association. Circulation. 2020;142:e454–e468. doi: 10.1161/CIR.0000000000000936. [DOI] [PubMed] [Google Scholar]
- 31.Skolarus LE, Sharrief A, Gardener H, Jenkins C, Boden-Albala B. Considerations in addressing social determinants of health to reduce racial/ethnic disparities in stroke outcomes in the United States. Stroke. 2020;51:3433–3439. doi: 10.1161/STROKEAHA.120.030426. [DOI] [PMC free article] [PubMed] [Google Scholar]
- 32.Magwood GS, Ellis C, Nichols M, Burns SP, Jenkins C, Woodbury M, et al. Barriers and facilitators of stroke recovery: perspectives from African Americans with stroke, caregivers and healthcare professionals. J Stroke Cerebrovasc Dis. 2019;28:2506–2516. doi: 10.1016/j.jstrokecerebrovasdis.2019.06.012. [DOI] [PMC free article] [PubMed] [Google Scholar]
- 33.Barlas RS, Honney K, Loke YK, McCall SJ, Bettencourt-Silva JH, Clark AB, et al. Impact of hemoglobin levels and anemia on mortality in acute stroke: analysis of UK regional registry data, systematic review, and meta-analysis. J Am Heart Assoc. 2016;5:e003019. doi: 10.1161/JAHA.115.003019. [DOI] [PMC free article] [PubMed] [Google Scholar]
- 34.Silvis SM, Reinstra E, Hiltunen S, Lindgren E, Heldner MR, Mansour M, et al. Anaemia at admission is associated with poor clinical outcome in cerebral venous thrombosis. Eur J Neurol. 2020;27:716–722. doi: 10.1111/ene.14148. [DOI] [PMC free article] [PubMed] [Google Scholar]
- 35.Liu K, Pei L, Gao Y, Zhao L, Fang H, Bunda B, et al. Dehydration status predicts short-term and long-term outcomes in patients with cerebral venous thrombosis. Neurocrit Care. 2019;30:478–483. doi: 10.1007/s12028-018-0628-3. [DOI] [PubMed] [Google Scholar]
- 36.Coutinho JM, Ferro JM, Canhão P, Barinagarrementeria F, Cantú C, Bousser MG, et al. Cerebral venous and sinus thrombosis in women. Stroke. 2009;40:2356–2361. doi: 10.1161/STROKEAHA.108.543884. [DOI] [PubMed] [Google Scholar]
- 37.Ruiz-Sandoval JL, Chiquete E, Bañuelos-Becerra LJ, Torres-Anguiano C, González-Padilla C, Arauz A, et al. Cerebral venous thrombosis in a Mexican multicenter registry of acute cerebrovascular disease: the RENAMEVASC study. J Stroke Cerebrovasc Dis. 2012;21:395–400. doi: 10.1016/j.jstrokecerebrovasdis.2011.01.001. [DOI] [PubMed] [Google Scholar]
- 38.Coutinho JM, Zuurbier SM, Bousser MG, Ji X, Canhão P, Roos YB, et al. Effect of endovascular treatment with medical management vs standard care on severe cerebral venous thrombosis: the TO-ACT Randomized Clinical Trial. JAMA Neurol. 2020;77:966–973. doi: 10.1001/jamaneurol.2020.1022. [DOI] [PMC free article] [PubMed] [Google Scholar]
- 39.Quinn TJ, Dawson J, Walters MR, Lees KR. Reliability of the modified Rankin Scale: a systematic review. Stroke. 2009;40:3393–3395. doi: 10.1161/STROKEAHA.109.557256. [DOI] [PubMed] [Google Scholar]
- 40.Dentali F, Poli D, Scoditti U, Di Minno MN, De Stefano V, Siragusa S, et al. Long-term outcomes of patients with cerebral vein thrombosis: a multicenter study. J Thromb Haemost. 2012;10:1297–1302. doi: 10.1111/j.1538-7836.2012.04774.x. [DOI] [PubMed] [Google Scholar]
- 41.Nguyen TN, Qureshi MM, Klein P, Yamagami H, Abdalkader M, Mikulik R, et al. Global impact of the COVID-19 pandemic on cerebral venous thrombosis and mortality. J Stroke. 2022;24:256–265. doi: 10.5853/jos.2022.00752. [DOI] [PMC free article] [PubMed] [Google Scholar]
- 42.Siegler JE, Abdalkader M, Michel P, Nguyen TN. Therapeutic trends of cerebrovascular disease during the COVID-19 pandemic and future perspectives. J Stroke. 2022;24:179–188. doi: 10.5853/jos.2022.00843. [DOI] [PMC free article] [PubMed] [Google Scholar]
Associated Data
This section collects any data citations, data availability statements, or supplementary materials included in this article.
Supplementary Materials
TRIPOD reporting guidelines checklist