Figure 6.
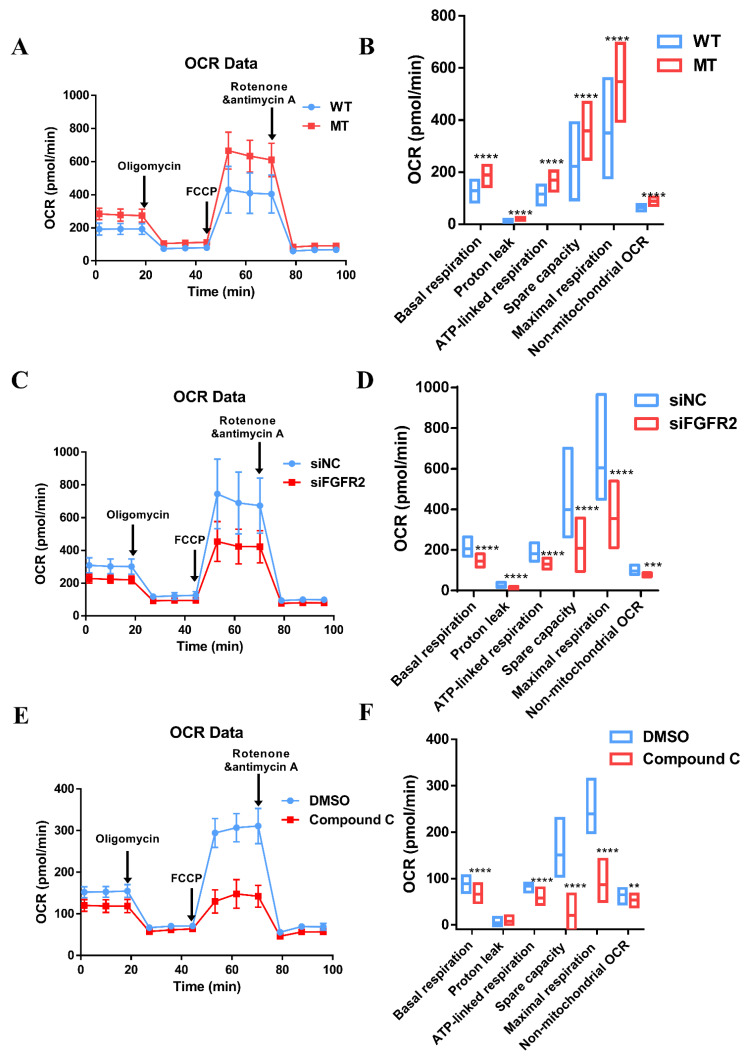
Mitochondria respiratory dysfunction influenced by the FGFR/FGFR2-AMPK pathway: (A) Traces of OCR in the WT group and MT group, respectively, in response to oligomycin, FCCP, and rotenone and antimycin A. (B) All parameters of cell respiratory function in the MT group were enhanced to varying degrees. The maximal respiratory capacity was significantly higher in the MT group than that in the WT group—547.61 ± 87.60 pmol/min vs. 350.64 ± 109.08 pmol/min, respectively. The same was true for spare capacity, with 358.39 ± 64.05 pmol/min in the MT group and 222.63 ± 84.41 pmol/min in the WT group. (C) Traces of OCR in the siNC group and siFGFR2 group. (D) After the knockdown of FGFR2, a completely opposite trend revealed itself. The maximal respiration (354.50 ± 95.67 pmol/min) and spare capacity (209.24 ± 78.07 pmol/min) were about the half of maximal respiration (605.74 ± 161.03 pmol/min) and spare capacity (398.69 ± 135.26 pmol/min) in the siNC group. (E) OCR traces were then treated with Compound C, an AMPK inhibitor. DMSO was added as the control. (F) Indicators of cell respiratory function were decayed, especially maximal OCR (20.70 ± 20.95 pmol/min) and spare respiratory capacity (86.59 ± 21.92 pmol/min), compared to 150.93 ± 32.84 pmol/min of maximal OCR and 239.42 ± 35.41 pmol/min of spare respiratory capacity in the control. p values were significant at ** p < 0.01, *** p < 0.001 and **** p < 0.0001.

