Abstract
With an increasing number of blockbuster drugs being recombinant mammalian proteins, protein production platforms that focus on mammalian proteins have had a profound impact in many areas of basic and applied research. Many groups, both academic and industrial, have been focusing on developing cost-effective methods to improve the production of mammalian proteins that would support potential therapeutic applications. As it stands, while a wide range of platforms have been successfully developed for laboratory use, the majority of biologicals are still produced in mammalian cell lines due to the requirement for posttranslational modification and the biosynthetic complexity of target proteins. An unbiased high-throughput RNAi screening approach can be an efficient tool to identify target genes involved in recombinant protein production. Here we describe the process of optimizing the transfection conditions, performing the genome-wide siRNA screen, the activity and cell viability assays and the validation transfection to identify genes involved with protein expression.
Keywords: siRNA, Protein production, HEK 293, Screen
1. Introduction
Recombinant proteins are produced for purposes such as biotechnology research and medicine, the protein products include antibodies, growth factors, membrane products, and vaccines, among others [1-3]. Common mammalian hosts for recombinant protein expression include Chinese hamster ovary cells (CHO) and human embryonic kidney (HEK) 293 cells. The former are more commonly used industrially due to their ability to produce high quality protein with post-translational modifications that are similar to those of human proteins. CHO cells also grow in chemically defined media in suspension and are resistant to viral infection [4]. Sometimes HEK 293 cells are preferred when CHO cells are not able to produce the required proteins, for example, in the case of some growth factors where proper glycosylation and protein folding is required [5]. The impressive success associated with using CHO cell lines to produce recombinant protein has to do with their unparalleled adaptability that allows these cells to grow uniformly in suspension cultures and adapt to serum-free conditions. However, this adaptability has its drawbacks. Phenotypic drift between CHO production clones is not uncommon, making it a challenge to produce recombinant proteins in a reproducible manner. While CHO cell lines were the workhouse of recombinant protein production, especially antibodies, the HEK 293 cell line has come to the forefront of recombinant protein production because proteins produced in HEK cells are a much closer match to naturally occurring proteins in terms of function and posttranslational modifications. The use of human cell lines also allows for the use of tools such as RNAi, which can target the whole human genome [6, 7].
The 2006 Nobel Prize in Physiology or Medicine went to Andrew Fire and Craig Mello for their discovery of RNA interference (RNAi), which was first identified in Caenorhabditis elegans and is found in almost all eukaryotes [8, 9]. It regulates gene expression at the mRNA level by suppressing transcription or triggering RNA degradation [10]. Small interfering RNAs (siRNAs) are 21- and 22- nucleotide sequence specific mediators of RNA inference [11]. As noncoding RNA, both endogenous and synthetic exogenous siRNA have the potential to be manipulated for use in biomedical research, drug development, and treatment [12, 13].
RNAi screening has proved useful for identifying genes and gene networks that are involved in various biological processes, diseases, and responses of host cells to pathogens and drugs [14]. Multiple types of RNAi screening are available including siRNA, enzymatically generated siRNA (esiRNA), small hairpin RNA (shRNA), and microRNA (miRNA) screenings. These are arranged as pools or individual arrays looking for a positive or negative phenotype. Each screen type has its own advantages and disadvantages [7, 15].
Using a high-throughput genome-wide siRNA screen, our laboratory identified antizyme 1 (OAZ1) as a target for improving luciferase expression in HEK 293 cells without affecting transcription. From the human genome screen, 56 genes were identified for a validation screen with three additional genes. Then, ten genes were identified for follow-up using three additional reporter proteins. OAZ1 was found to consistently improve the expression of a cytosolic, a secreted and a membrane protein in HEK 293 cells with minimal effect on cell growth [16].
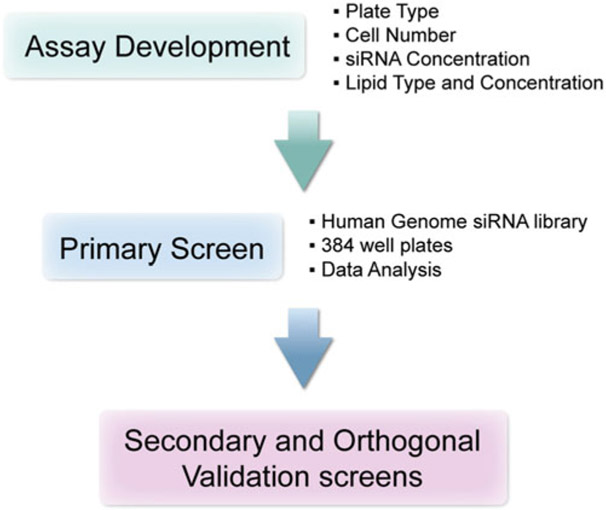
Here, we present a method for performing a genome-wide siRNA screen for identifying genes involved in recombinant protein production using the Photinus pyralis (firefly) luciferase as a reporter protein. An initial assay development is followed by the primary screen, in which 21,585 genes are individually knocked down with three unique siRNAs per target in a high-throughput format. This is followed by a validation screen to confirm the top genes as shown in Fig. 1. We have expanded the section on assay optimization and development to include many parameters that should be taken into consideration when designing a high-throughput RNAi screen to identify genes that may have been outside the scope of this luciferase based readout. We hope that the methods presented here serve as a platform for anyone designing a high-throughput genome-wide, functional genomics screen to identify genes involved in production of proteins.
Fig. 1.
Work flow for genome-wide RNAi screening
2. Materials
2.1. Cells and Media
HEK-CMV-Luc2-Hygro cell line constitutively expressing P. pyralis luciferase pGL4.50 (luc2/CMV/Hygro vector) (Promega) [16] (see Note 1).
HEK-GPC3-hFc cell line constitutively secreting glypican-3 hFc-fusion protein [17], inducible T-Rex-SERT-GFP cell line [18], and T-Rex-NTSR1-GFP cell line [19] (nonscreening cell lines for orthogonal validation) [16] (see Note 2).
Dulbecco’s Modified Eagle’s Medium (DMEM) with high glucose, pyruvate.
Fetal Bovine Serum (FBS).
2.2. Transfection Reagents and Instrumentation
Silencer select negative control #2 (Ambion® Silencer® Select, Thermo Fisher Scientific, Waltham, MA) and siPLK control (Ambion® Silencer® Select, Thermo Fisher Scientific).
Silencer select Human Genome siRNA library (Thermo Fisher Scientific).
384-well white solid bottom tissue culture plates (Corning, Corning, NY).
Lipofectamine TM RNAiMAX (Thermo Fisher Scientific).
Agilent robotic system.
Silencer1 siRNAs (Thermo Fisher Scientific).
Humidified sterile incubator maintained at 37 °C, 5% CO2.
Hoechst dye (Thermo Fisher Scientific).
Image Xpress, (Molecular Devices, San Jose, CA).
Pipettes.
Eppendorf tubes.
2.3. Luciferase Assay
OneGlo™ Reagent Luminescent Cell Luciferase Assay (Promega, Madison, WI).
Cell Titer Glo™ (CTG; Promega).
EnVision Multilabel plate reader (PerkinElmer, Waltham, MA).
2.4. Data Visualization
R computational environment (https://www.R-project.org/) [20].
Spotfire (Perkin Elmer) (see Note 3).
3. Methods
3.1. Assay Optimization and Development
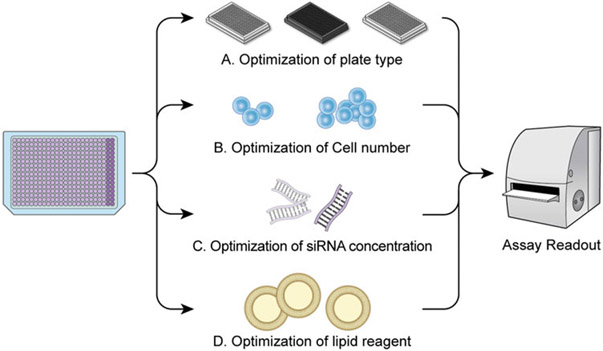
Assay development includes experimental design, optimization, miniaturization, validation, and, if necessary, small-scale pilot screens to assess the assay performance and to identify lead candidates and genes/controls. The plate type, cell number, siRNA concentration, and lipid reagent and concentration optimization are all part of assay development as shown in Fig. 2.
Fig. 2.
Assay development strategies
3.1.1. Cell Number Optimization and Plate Selection
Seed HEK 293 cells in DMEM with 10% FBS in a 384-well plate at densities ranging from 250 cells/well to 5000 cells/well to assess growth for 72–96 h, using 3–4 columns of wells per cell density. The goal is to have cells that are no more than 80–85% confluent at the time of endpoint measurement.
Growth is usually assessed by either staining with Hoechst dye for nuclear number (ImageXpress) or by using a luminescence based readout (EnVision) for cell viability. This is done to negate the effects on viability and cell number that might come into play due to cell overcrowding, contact inhibition, and other factors.
While determining cell number, if necessary, assess different multiwell plates with different growth surfaces (for finicky cells) in order to optimize cell growth and assay read out (see Note 4).
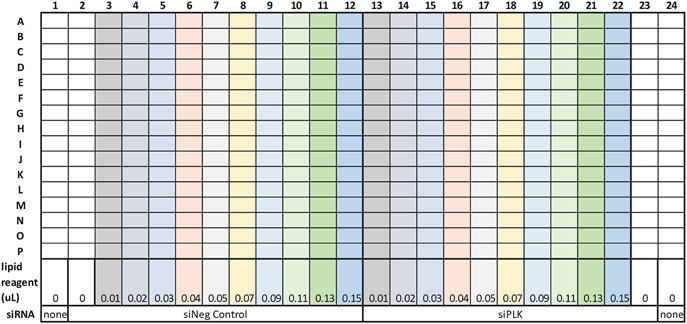
Once the optimum number of cells has been determined, the next step is to access the transfection efficiency. There are two components for assessing the transfection efficiency: (1) choice and concentration of transfection reagent; and (2) concentration and suitability of transfection controls. The assay is experimentally designed for calculating the transfection efficiency between positive and negative siRNA control using a concentration of lipid reagent that causes the least amount of transfection-mediated cytotoxicity. Figure 3 shows a sample plate layout for the transfection efficiency assessment (see Note 5).
Fig. 3.
Sample plate layout for transfection efficiency assessment
3.1.2. Transfection Efficiency Assessment
Transfer 2 μL of 400 nM stocks, (0.8 pmol) of 1) the non-targeting control (Silencer® Select Negative Control No. 2 siRNA, siNC) and 2) the positive control (siPLK1) into a 384-well plate with a multichannel pipette (see Note 6).
Dilute different amounts of RNAiMAX (0–0.15 μL per well) in screening media (20 μL per well of DMEM with no FBS or 6penicillin/streptomycin), add to the wells with a multichannel pipette, and incubate for at least 30 min at room temperature (RT) (see Note 7).
While the plates are incubating, centrifuge HEK 293 cells at 200 × g for 8 min and resuspend in DMEM containing 20% FBS to the concentration required to achieve the previously determined cell number in 20 μL of cell suspension.
Seed 20 μL of the cell suspension in the wells already containing the siRNAs plus the lipofection reagent with a multichannel pipette. These experiments are performed in replicates.
Incubate the plates at 37 °C, 5% CO2 and humidified air.
After 72 h of incubation, add 20 μL of OneGlo™ with a multichannel pipette to the wells of one replicate set to get an overall luciferase yield.
To the wells in the second replicate set, add 30 μL of CTG with a multichannel pipette to get a read for total cell viability.
Incubate the plates for 20 min at RT to stabilize the luminescent signal and then collect the luminescence readouts with the EnVision multilabel reader.
Assess transfection efficiency with the fold change in the viability and the luciferase yield, separately, between the positive and negative transfection controls.
The lipid reagent concentration, siRNA concentration and cell number that give the best transfection efficiency with the least associated cytotoxicity are then chosen for the primary screening (see Subheading 3.2) (see Note 8).
3.2. Primary Screen
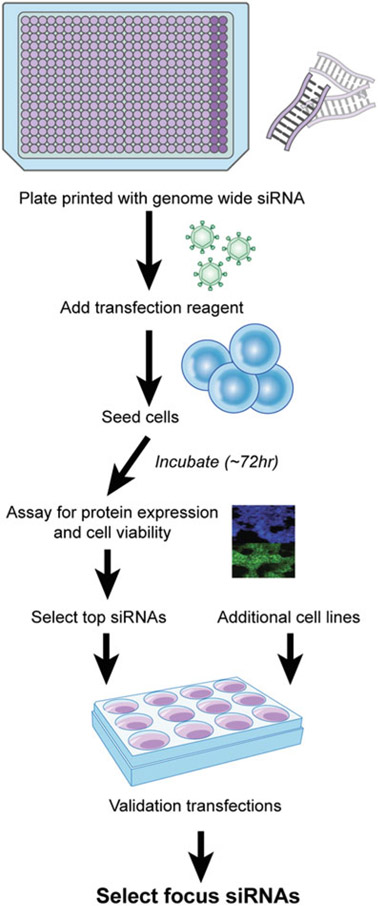
The Silencer Select Human genome siRNA library, which targets 21,585 human genes with three siRNAs per gene, is used for primary screening. A workflow for the primary and secondary screens can be seen in Fig. 4 (see Note 9).
Fig. 4.
Work flow for primary and secondary validation screen. Note, the additional cell lines step is to ensure the selected genes focus on recombinant protein production and are not specific to one protein
Each siRNA is arrayed in an individual well. All plates have a full column (16 wells) of Silencer Select Negative Control #2 for data normalization, and a full column of siPLK1 used as on-plate reference for transfection efficiency.
Each transfection is done in duplicate. Using the Agilent Robotic system, 0.8 pmol of each siRNA is spotted to a different well of a 384-well plate, and 20 μL of serum-free DMEM containing 0.07 μL of RNAiMAX is then added to each well (see Note 10).
This lipid-siRNA mixture is incubated at ambient temperature for 30 min prior to addition of 4000 cells in 20 μL of DMEM containing 20% FBS (see Note 11).
After incubating the transfected cells at 37 °C in 5% CO2 for 72 h, 20 μL of OneGlo™ is added to one set of replicates for quantification of “overall luciferase yield” and 30 μL of CTG is added to the second set of replicates for measurement of “viable cell density” with the Agilent Robotic system.
All plates are incubated at room temperature for 20 min to stabilize the luminescent signal and then measured with the EnVision plate reader.
Both controls, Silencer Select Negative Control #2 and siPLK1, are used in all validation transfections. The genes that are targeted by at least two independent siRNAs (out of three) resulting in enhanced luciferase production with median absolute deviation (MAD)-based z-score > 3 from the primary screen are then subjected to validation screens using three additional Silencer1 siRNAs with different sequences from those used in the primary screen.
Gene candidates for further downstream orthogonal follow-up are selected based on the criteria that three out of the six siRNAs displayed a MAD-based z-score > 3. The transfection and assay processes are the same as in the primary genome-wide screen.
Data visualization is performed in R computational environment. The screen generates end-point data for “overall luciferase yield” and “viable cell density” in each well. For each plate, the median value of the negative control wells is set as 100% and is used to normalize corresponding sample wells. The “overall luciferase yield” and “viable cell density” are exported as the percentage of the negative control, and the MAD-based z-score was calculated for each sample [23].
3.3. Secondary and Orthogonal Validation Screens
Genes with at least two siRNAs that are in the range of >3 MAD for enhanced luciferase expression are selected for validation transfections.
Three additional Silencer1 siRNAs with different sequences from those used in the primary screen are used in the secondary screen with the same assay conditions as the primary screen.
The data are analyzed together with the primary screen and candidates with MAD-based z-score > 3 for at least 4 out of 6 siRNA sequences (combining the primary and secondary screen data) are selected.
The selected SiRNA are then funneled through orthogonal lower throughput assays or performed for different cell lines in the same assay to focus on genes that are important for the production of recombinant proteins.
4. Notes
Other cell lines can be used but should have an assay that is measurable on a high-throughput scale such as a GFP-based reporter protein.
Other cell lines can be used for orthogonal assays. These additional cell lines ensure the selected genes are focused to recombinant protein production and are not specific to one protein.
Use “hexabin” and “ggplot2” or Spotfire.
Typically, for imaging-based screens, black clear bottom TC-treated 384-well plates are used. White opaque bottom plates are used for assays that have a luminescence-based readout while black opaque bottom plates are used in cases where the readout is total fluorescence. During the assay optimization steps, white and black clear bottom plates are used to assess cell health and morphology while determining optimum assay readouts.
The sample plate layout is only for reference; many plate layouts are possible depending on individual experimental needs.
The initial stages of transfection efficiency are assessed with a final concentration of 20 nM siRNA per well. However, if this siRNA concentration is not sufficient to suitably transfect the cells, a concentration response of siRNA is performed to determine the siRNA concentration required for reliable knockdown of the target genes (controls). Knockdown efficiency is also assessed by measuring mRNA transcript levels post knockdown in addition to the phenotypic effect.
Typically, the first reagent tested for transfection efficiency is a Lipofectamine derivative, RNAiMAX. In the event that RNAi-MaX does not work to suitably transfect the cell line of choice, other lipid reagents are used in the assay optimization. These include, but are not limited to, Dharmafect (1–4), DNAIn, CRISPR Max, and Transit.
For assays that employ the use of GFP or other reporters, an siRNA to that reporter gene can also be used to assess transfection efficiency. Furthermore, known biological controls for the phenotype of interest are also tested to serve as good biological assay controls. Depending on the physiological complexity of the assay, anything from a tenfold difference (viability from an Adenosine TriPhosphate (ATP) luciferase-based read out) to a robust, reproducible twofold difference with Z factors above 0.5 in more complex image-based or HTRF assays is considered a screenable assay. The process of assay development usually involves running a small pilot screen, to assess data quality and robustness of the assay. This pilot screen is typically done in duplicate and if the correlation between pilot screens is good, the primary screen is then embarked upon.
The conditions listed in this section are based on the results of our assay development for the HEK-CMV-Luc2-Hygro cell line.
Prepare enough Lipofectamine RNAiMax/serum-free media for all wells plus some extra.
Prepare enough cells in DMEM with 20% FBS for all wells plus some extra. Cell concentration = (4000 cells/well)/(20 μL/well)*(1000 μL/mL) = 2 × 10⁵ cell/mL.
Acknowledgments
The research of the authors was supported by the Intramural Research Program of the National Institutes of Health (National Institute of Diabetes and Digestive and Kidney Disease).
References
- 1.Andersen DC, Krummen L (2002) Recombinant protein expression for therapeutic applications. Curr Opin Biotechnol 13(2):117–123 [DOI] [PubMed] [Google Scholar]
- 2.Coroadinha AS, Gama-Norton L, Amaral AI, Hauser H, Alves PM, Cruz PE (2010) Production of retroviral vectors: review. Curr Gene Ther 10(6):456–473 [DOI] [PubMed] [Google Scholar]
- 3.Kunert R, Reinhart D (2016) Advances in recombinant antibody manufacturing. Appl Microbiol Biotechnol 100(8):3451–3461 [DOI] [PMC free article] [PubMed] [Google Scholar]
- 4.Kim JY, Kim YG, Lee GM (2012) CHO cells in biotechnology for production of recombinant proteins: current state and further potential. Appl Microbiol Biotechnol 93(3):917–930 [DOI] [PubMed] [Google Scholar]
- 5.Thomas P, Smart TG (2005) HEK293 cell line: a vehicle for the expression of recombinant proteins. J Pharmacol Toxicol Methods 51(3):187–200 [DOI] [PubMed] [Google Scholar]
- 6.Jadhav V, Hackl M, Druz A, Shridhar S, Chung CY, Heffner KM, Kreil DP, Betenbaugh M, Shiloach J, Barron N, Grillari J, Borth N (2013) CHO microRNA engineering is growing up: recent successes and future challenges. Biotechnol Adv 31(8):1501–1513 [DOI] [PMC free article] [PubMed] [Google Scholar]
- 7.Echeverri CJ, Perrimon N (2006) High-throughput RNAi screening in cultured cells: a user’s guide. Nat Rev Genet 7(5):373–384 [DOI] [PubMed] [Google Scholar]
- 8.The Nobel Prize in Physiology or Medicine 2006. 2014. 13 Oct 2017. ]; Available from: <http://www.nobelprize.org/nobel_prizes/medicine/laureates/2006/> [Google Scholar]
- 9.Fire A, Xu S, Montgomery MK, Kostas SA, Driver SE, Mello CC (1998) Potent and specific genetic interference by double-stranded RNA in Caenorhabditis elegans. Nature 391(6669):806–811 [DOI] [PubMed] [Google Scholar]
- 10.Agrawal N, Dasaradhi PV, Mohmmed A, Malhotra P, Bhatnagar RK, Mukherjee SK (2003) RNA interference: biology, mechanism, and applications. Microbiol Mol Biol Rev 67(4):657–685 [DOI] [PMC free article] [PubMed] [Google Scholar]
- 11.Elbashir SM, Harborth J, Lendeckel W, Yalcin A, Weber K, Tuschl T (2001) Duplexes of 21-nucleotide RNAs mediate RNA interference in cultured mammalian cells. Nature 411(6836):494–498 [DOI] [PubMed] [Google Scholar]
- 12.Tabernero J, Shapiro GI, LoRusso PM, Cervantes A, Schwartz GK, Weiss GJ, Paz-Ares L, Cho DC, Infante JR, Alsina M, Gounder MM, Falzone R, Harrop J, White AC, Toudjarska I, Bumcrot D, Meyers RE, Hinkle G, Svrzikapa N, Hutabarat RM, Clausen VA, Cehelsky J, Nochur SV, Gamba-Vitalo C, Vaishnaw AK, Sah DW, Gollob JA, Burris HA 3rd (2013) First-in-humans trial of an RNA interference therapeutic targeting VEGF and KSP in Cancer patients with liver involvement. Cancer Discov 3(4):406–417 [DOI] [PubMed] [Google Scholar]
- 13.Gomes MJ, Dreier J, Brewer J, Martins S, Brandl M, Sarmento B (2016) A new approach for a blood-brain barrier model based on phospholipid vesicles: membrane development and siRNA-loaded nanoparticles permeability. J Memb Sci 503:8–15 [Google Scholar]
- 14.Mohr SE, Smith JA, Shamu CE, Neumüller RA, Perrimon N (2014) RNAi screening comes of age: improved techniques and complementary approaches. Nat Rev Mol Cell Biol 15(9):591–600 [DOI] [PMC free article] [PubMed] [Google Scholar]
- 15.Campeau E, Gobeil S (2011) RNA interference in mammals: behind the screen. Brief Funct Genomics 10(4):215–226 [DOI] [PubMed] [Google Scholar]
- 16.Xiao S, Chen YC, Buehler E, Mandal S, Mandal A, Betenbaugh M, Park MH, Martin S, Shiloach J (2016) Genome-scale RNA interference screen identifies antizyme 1 (OAZ1) as a target for improvement of recombinant protein production in mammalian cells. Biotechnol Bioeng 113:2403–2415 [DOI] [PMC free article] [PubMed] [Google Scholar]
- 17.Feng M, Gao W, Wang R, Chen W, Man YG, Figg WD, Wang XW, Dimitrov DS, Ho M (2013) Therapeutically targeting glypican-3 via a conformation-specific single-domain antibody in hepatocellular carcinoma. Proc Natl Acad Sci U S A 110(12):E1083–E1091 [DOI] [PMC free article] [PubMed] [Google Scholar]
- 18.Abdul-Hussein S, Andrell J, Tate CG (2013) Thermostabilisation of the serotonin transporter in a cocaine-bound conformation. J Mol Biol 425(12):2198–2207 [DOI] [PMC free article] [PubMed] [Google Scholar]
- 19.Xiao S, Shiloach J, Grisshammer R (2015) Construction of recombinant HEK293 cell lines for the expression of the Neurotensin receptor NTSR1. Methods Mol Biol 1272:51–64 [DOI] [PubMed] [Google Scholar]
- 20.R Core Team (2014) R: a language and environment for statistical computing. R foundation for statistical computing, Vienna. http://www.R-project.org/ [Google Scholar]
- 21.Carr D (2015) Package hexbin: hexagonal binning routines [Google Scholar]
- 22.Wickham H (2009) ggplot2: elegant graphics for data analysis. Springer-Verlag, New York. 10.1007/978-0-387-98141-3 [DOI] [Google Scholar]
- 23.Chung N, Zhang XD, Kreamer A, Locco L, Kuan PF, Bartz S, Linsley PS, Ferrer M, Strulovici B (2008) Median absolute deviation to improve hit selection for genome-scale RNAi screens. J Biomol Screen 13(2):149–158 [DOI] [PubMed] [Google Scholar]


