

Abstract
Non-invasive small-animal imaging technologies, such as optical imaging, magnetic resonance imaging and x-ray computed tomography, have enabled researchers to study normal biological phenomena or disease progression in their native conditions. However, existing small-animal imaging technologies often lack either the penetration capability for interrogating deep tissues (e.g., optical microscopy), or the functional and molecular sensitivity for tracking specific activities (e.g., magnetic resonance imaging). To achieve functional and molecular imaging in deep tissues, we have developed an integrated photoacoustic, ultrasound and acoustic angiographic tomography (PAUSAT) system by seamlessly combining light and ultrasound. PAUSAT can perform three imaging modes simultaneously with complementary contrast: high-frequency B-mode ultrasound imaging of tissue morphology, microbubble-enabled acoustic angiography of tissue vasculature, and multi-spectral photoacoustic imaging of molecular probes. PAUSAT can provide three-dimensional (3D) multi-contrast images that are co-registered, with high spatial resolutions at large depths. Using PAUSAT, we performed proof-of-concept in vivo experiments on various small animal models: monitoring longitudinal development of placenta and embryo during mouse pregnancy, tracking biodistribution and metabolism of near-infrared organic dye on the whole-body scale, and detecting breast tumor expressing genetically-encoded photoswitchable phytochromes. These results have collectively demonstrated that PAUSAT has broad applicability in biomedical research, providing comprehensive structural, functional, and molecular imaging of small animal models.
Keywords: deep-tissue imaging, photoacoustic imaging, ultrasound imaging, acoustic angiography, functional imaging, molecular imaging, photoswitchable protein
I. Introduction
Non-invasive small-animal imaging technologies have evolved rapidly over the past decades with increasingly broad applications, enabling researchers to study the progression of biological events, evaluate the progression of various diseases, and monitor responses to treatment [1], [2]. All major medical imaging techniques such as x-ray computed tomography (CT), positron emission tomography (PET) and magnetic resonance imaging (MRI), have been adapted for in vivo small-animal imaging, usually with smaller formfactors and improved spatial resolutions compared with their clinical counterparts [3]–[8]. Based on different contrasts, small-animal imaging modalities can provide complementary information of the biological tissues. For example, small-animal PET/CT maps tissue’s morphology and metabolic activities with deep penetration, but both PET and CT employ ionizing radiation, in addition to the poor soft tissue contrast in CT and complicated workflow in PET, which hinders longitudinal studies [9]–[12]. Small-animal MRI uses nonionizing radiofrequency waves to map soft tissue information with excellent contrast and spatial resolution but suffers from a low imaging speed and high cost that hamper some in vivo applications and limit throughput [1], [13]. To overcome the above limitations, there need to be new imaging modalities that can provide non-ionizing functional and molecular imaging in deep tissues.
While light is usually non-ionizing and intrinsically sensitive to tissue’s functional and molecular contrast, high-resolution optical imaging technologies such as multi-photon microscopy often lack the penetration depth for deep tissue studies [14], [15]. Bioluminescence and fluorescence imaging have also been widely applied for monitoring tumor development with high sensitivity and contrast, but they suffer from poor spatial resolution at depths [16],[17]. Ultrasound tomography (UST), on the other hand, can provide deep tissue information with high spatial and temporal resolutions, but so far still lacks molecular sensitivity [18]–[23]. Seamlessly combining the rich optical absorption contrast and the deep ultrasound penetration, photoacoustic tomography (PAT) is the promising optical imaging modality that can achieve functional and molecular imaging at large depths with high spatial resolutions [24]–[26]. In PAT, the energy of incident photons is absorbed by tissue chromophores and is partially or completely converted into ultrasonic waves via non-radiative relaxation. The ultrasonic waves are subsequently detected to reconstruct tomographic images of the original optical energy deposition in tissue [27],[28]. Because ultrasound waves are only weakly scattered in soft tissues, PAT can achieve high spatial resolution at depths larger than 10 mm, far beyond the optical diffusion limit. Moreover, due to optical absorption contrast, PAT has intrinsic functional and molecular sensitivity, which is highly desired for preclinical research on small animal models. We have previously demonstrated deep-tissue photoacoustic imaging of cancer metastasis with high sensitivity, using near-infrared photoswitchable phytochromes [29]. Nevertheless, due to the lack of endogenous contrast in the extravascular space, PAT typically cannot provide morphological information of the soft tissue. Moreover, due to partial acoustic detection coverage and/or sparse spatial sampling, PAT often suffers from streaking artifacts and missing structures.
High-performance small animal imaging needs high spatial resolution, high temporal resolution, deep penetration, high structural fidelity, high throughput, and functional and molecular sensitivity, all in the same system. None of the above imaging technologies can meet this need alone, given their respective shortcomings. Therefore, it is most logical to integrate multiple imaging modalities with complementary contrast mechanisms, compatible system configurations, and comparable length scales. In this work, we report a technical advance in small animal imaging: the integrated photoacoustic, ultrasound and angiographic tomography (PAUSAT) platform. As a single imaging system, PAUSAT can provide comprehensive information about organ structures via ultrasound imaging (US), vascular morphology via acoustic angiography (AA), and molecular composition via photoacoustic imaging (PA) [30], [31]. All three imaging modes were engineered to function in the same system with shared scanning mechanisms, synchronized controlling, and parallel signal detection. More importantly, the three imaging modes share the same field of view and the images are automatically co-registered. We have thoroughly characterized the performance of PAUSAT, and demonstrated its non-invasive structural, functional, and molecular imaging with sub-millimeter resolutions at depths beyond 10 mm. PAUSAT has enabled multiple comprehensive small animal studies that are not feasible by individual imaging modes, including longitudinal monitoring of placenta and embryo development during mouse pregnancy, continuous tracking of biodistribution and metabolism of a second near-infrared window (1000 nm-1700 nm) organic dye on the whole-body scale, and highly-sensitive detection of breast cancer expressing genetically-encoded photoswitchable phytochrome. All these results have collectively demonstrated that PAUSAT is a powerful imaging tool and will find a broad range of biomedical applications.
II. Method
A. Configuration of the PAUSAT System
The schematic and working principle of the PAUSAT system is shown in Figs. 1a–c. PAUSAT was implemented on a Vega robotic imaging system (SonoVol, Inc., Durham, NC), which employs two ultrasound transducers to achieve the three imaging modes (Fig. 1c). The first transducer is a customized dual-element focused wobbler, with a high-frequency inner element (15–35 MHz) and a low-frequency outer element (2 MHz). The inner element of the wobbler is made of polyvinylidene fluoride (PVDF), and the outer element is made of lead zirconate titanate (PZT). The two elements are concentrically aligned with a shared focal length. The second transducer is a 128-elememnt linear array (5 MHz) (L7–4, Philips, USA). The dual-element focused transducer is used for US and AA imaging, providing high-resolution images of mouse organ structures and vasculature perfusion at deep regions of interest. The US mode uses the inner element for both high-frequency signal transmission and receiving. The AA mode uses the outer element to burst microbubbles flowing in blood vessels and uses the inner element to receive superharmonic bubble bursting signals, resulting in high-contrast vasculature images [32]. The linear array, coupled with a dual-branch optical fiber bundle flanking its lateral sides, is used for the PA imaging to achieve high-speed molecular imaging with large penetration depth. The excitation light source for the PA imaging is a pulsed Nd: YAG laser (Q-smart 850, Quantel Laser, USA; 1064 nm; pulse reptation rate: 10 Hz).
Fig. 1. Integrated photoacoustic, ultrasound and angiographic tomography (PAUSAT).

(a) Schematic of the PAUSAT system, showing the key acoustic, optical and mechanical components. The green lines show the trigger signals. The gray box at the right bottom corner shows the relative positions of the linear array and the wobbler. (b) Assembly of the linear array for the PA mode and the wobbler for the US and AA mode. (c) Imaging principles of the PA, US, and AA modes. In the PA mode, the pulsed laser light is delivered by the optical fiber bundle and the resultant acoustic waves are detected by the linear transducer array; In the US mode, the high-frequency inner-element of the focused wobbler transducer transmits the acoustic waves and detects the reflected echo signals; In the AA mode, the low-frequency outer-element of the wobbler transmits a strong acoustic pulse to burst the flowing microbubbles in the blood vessels, and the high-frequency inner-elements detects the bursting signals from the bubbles. (d) Spatial resolution measurement of the PA mode. (e) Spatial resolution measurement of the US mode. (f) Comparison of the penetration depth of the US mode at three different frequencies. (g) Penetration depth of the PA mode.
A FPGA based control box is programmed to synchronize the laser firing, motor stage motion, and PA/US data acquisition. The US and AA signals are acquired by a single-channel high-speed DAQ card. The PA signals are acquired by a programmable ultrasound scanner (Vantage 256, Verasonics, USA). While the linear array provides axial cross-sectional images for the PA mode with back-projection-based image reconstruction, the fast-scanning of the wobbler provides axial cross-sectional images for the US and AA mode (Supplementary Video 1, all the supplementary materials are available in the supplementary files /multimedia tab). The two transducers are mounted on a robotically actuated carriage with their relative positions fixed. The relative distances of the two transducers are shown in Fig. 1a. The carriage moves along a two-dimensional (2D) motorized stage for acquiring 3D images with a large field of view [32]. The 2D motorized stage is programed to move the transducers to the same location for imaging the same target. The key acoustic, optical (except the laser), scanning, and electronical components are fully immersed in a hydrocarbon fluid filled reservoir, which improves the system’s lubrication, acoustic coupling, and heat dissipation. The fluid is optically transparent at 1064 nm and its sound speed is ~1402 m/s. The reservoir has an optically and acoustically transparent imaging window on the top.
B. PAUSAT Scanning Configuration
In the US and AA, a field of view of ~40 mm by 20 mm (lateral by elevational) was scanned by the wobbler with a scanning step size of 0.2 mm along the elevational dimension and the pixel size is 0.05 mm along the lateral dimension. The width of the wobbler field of view is ~17 mm and therefore 3 passes were taken and stitched to span 40 mm. In the AA mode, the lateral scanning was repeated 5 times and averaged to enhance the image quality. It took ~5 min to acquire a 3D volumetric US data and 30 min for a 3D AA data. The 3D volumes of US and AA images were generated from stacks of encoder-tracked 2D ultrasound frames using a pixel-based volume reconstruction algorithm (PLUS Toolkit) [33]. Briefly, the algorithm iterated through each 2D slice and inserted pixel values into the corresponding volume voxel on a regularized voxel grid. Options for reconstruction included linear interpolation (i.e., each pixel was distributed to its closest 8 volume voxels) as well as weighted compounding for overlapping data to achieve smoothness. In PA mode, the linear array was scanned elevationally with a step size of 0.2 mm and a scanning length of 40 mm. Five repeated frames are taken at each location for averaging. It took ~5 mins to acquire a 3D PA data. The optical pulse energy from the fiber output was ~20 mJ at 1064 nm, with a spot size of 10 mm by 40 mm on the sample surface. The axial cross-sectional PA images were reconstructed in real time and 3D rendering images were processed offline using Matlab. For the PA mode, the back-projection reconstruction method was performed for each cross-sectional image [34], [35]. Sound speed was corrected for the hydrocarbon fluid in the PA image reconstruction. In the in vivo studies, animals lay on the top of the imaging window in the prone position for stability and ventilation [36]. The time interval between each modality was short and no obvious motion artifacts were observed in our experiments.
C. Characterization of PAUSAT
The spatial resolutions and penetration depth of the PAUSAT system were characterized. For spatial resolution measurement, the cross-section of a carbon fiber (~7 μm in diameter), representing a line target, was imaged by the wobbler with the US mode and by the linear array with the PA mode. To measure the penetration depth of the wobbler, which can be operated at different frequencies, cross-sectional US images of a pregnant mouse were acquired at three transmission frequencies of 15 MHz, 25 MHz and 35 MHz. The PA mode was also applied to scan the same cross-section to characterize its penetration depth.
D. Validation of the PAUSAT System on Phantoms
The three imaging modes in PAUSAT provide complementary information of the same target. We first validated the imaging performance of PAUSAT by imaging a knot phantom made of a soft tube (inner diameter, 200 μm; outer diameter 300 μm) to mimic a blood vessel. The tube was perfused with water, microbubbles, or a lab-made NIR-II dye BIBDAH for the US [37], AA and PA mode, respectively. In the AA imaging, microbubbles (Sonovol, Inc.; Diameter: 5 μm) were infused into the plastic tube (inner diameter, 200 μm; outer diameter 300 μm) at the rate of 1 × 10⁸ bubbles/min continuously with a catheter, which was driven by an automatic syringe pump to mimic the blood circulation.
Although PA mode can be used for vascular imaging with hemoglobin as the endogenous contrast [38]–[40], AA mode can provide vascular images with better contrast and resolution. On the other hand, the PA mode has the unique molecular sensitivity with a variety of exogenous contrast agents [37], [41], [42], which cannot be provided by the US or AA mode. Here we tested the molecular imaging of the PA mode using an NIR-II BIBDAH dye that has strong optical absorption at 1064 nm. BIBDAH dye was prepared with four different concentrations (0.5 mg/mL, 0.2 mg/mL, 0.1 mg/mL, 0.05 mg/mL) diluted with PBS [37]. The dye solutions were injected into transparent plastic tubes (inner diameter: 200 μm; outer diameter: 300 μm). A fifth tube was filled with whole bovine blood (Quad Five, Inc.). The tubes were sandwiched by two pieces of thin agar sheets and placed on top of the imaging window of the PAUSAT system. The imaging window was then covered by a thin layer of distilled water as the ultrasound coupling medium.
E. PAUSAT Validation on Small Animals
To further validate the system for in vivo small animal studies, a mouse model was developed by subcutaneously implanting an artificial Matrigel “tumor” mixed with the BIBDAH dye (no tumor cells included) close to the liver cavity, mimicking the targeted exogenous PA contrast agents tagging tumor cells [43]. The PA, US, and AA modes were then used sequentially to scan the artificial tumor region. The protocol of all the animal experiments was proved by the institutional animal care and use committee of Duke University. Female BALB/c mice (8 weeks old; 20–30 grams in weight) were used for all experiments. The hair on the mouse chest, abdomen or back was shaved and depilated as needed. The mice were then anesthetized with 1.5% v/v isoflurane and placed on the imaging window of the PAUSAT system with a 1-mm-thick agar pad underneath. This agar pad served as a spacer to separate the PA and US signals from the mouse skin surface and the imaging window membrane. Water was used to couple the membrane, the agar pad and the mouse skin. A heating lamp was used to maintain mouse body temperature at 37°C. For all the AA imaging, a total of 200 μL microbubbles with the concentration of 2 × 10⁹ /ml were injected via the tail vein with a 27-gauge syringe. For the PA liver imaging, Matrigel mixed with the BIBDAH dye was implanted around the liver region subcutaneously to create an artificial tumor with a volume of 15 mm3.
F. Longitudinal Imaging of the Mouse Pregnancy
Non-invasive imaging of the developing embryo in vivo with normal pregnant conditions is highly desired for developmental biology and reproductive science. Traditional optical imaging cannot clearly visualize the deep-seated embryos without implanting intravital windows which are invasive and may lead to embryo death [44]. PAUSAT was then used for longitudinal non-invasive imaging of in vivo mouse pregnancy to solve this issue. In this experiment, the developing embryos and placenta were imaged by the US mode and the PA mode every two days from E9 to E17, and by the AA mode at E9, E13 and E17. CD-1 IGS mice of ~8 weeks old were used for timed breeding by checking vaginal plugs. Female mice at the proestrus phase were placed together with male mice for mating. The females were then checked in the following morning at 8–9 am for vaginal plug. When a plug was seen, they were separated and the day when the plug was found was considered as the first day of gestation. The embryos were also staged in days of gestation, and the morning when the vaginal plug was detected was defined as E0.5. The pregnant mice were imaged from E8.5.
G. Tracking the Biodistribution of an NIR-II Dye
It is critically important to monitor the biodistribution and metabolism of organic chemicals at the whole-body level for drug development and treatment evaluation. PAUSAT is fully capable of molecular imaging with high detection sensitivity. As a proof of concept, we demonstrated the application of PAUSAT for monitoring the metabolism of a BIBDAH dye in a mouse. 200 μL BIBDAH dye with the concentration of 0.5 mg/mL was injected via the tail vein of the mouse, and the PA imaging were performed every hour until 4 hours post-injection. The chest-liver area of the mouse was scanned with the linear transducer array for the PA mode, and the coronal-view PA image was acquired from the maximum amplitude projection along the depth. The PA signal dynamics from the major blood vessels in the skin and from the liver were compared.
H. Detecting Reversibly-Photoswitching Tumors
In addition to exogenous organic dyes, endogenous genetic reporters, such as reversibly photoswitchable phytochromes, have become increasingly popular in PA molecular imaging due to their high biocompatibility and enhanced detection sensitivity. One of these phytochrome proteins is Bphp1 that originates from rhodopseudomonas [29], [45]. As shown in Fig. 6a, the optical absorption spectra of BphP1, exhibits two switchable absorbing states: the Pfr state and the Pr state. The Pfr state is the ground state or ON state. With 730–790 nm optical illumination, BphP1 undergoes photoconversion to its Pr state or OFF state, at which the optical absorption is shifted to 630–690 nm. The molar extinction coefficient of Bphp1 at the ON state (at 750 nm) is ~70 times higher than that of oxygenated hemoglobin [29]. This photoswitching is reversible between the two states.
Fig. 6. Detecting reversibly photoswitching tumor in vivo.

(a) Molecular extinction coefficients of oxygenated hemoglobin (HbO2, red curve), deoxygenated hemoglobin (Hb, blue curve), ON state Bphp1 (orange curve) and OFF state Bphp1 (green curve) from 500 nm to 900 nm. (b) PA laser excitation sequence used for photoacoustic imaging and photoswitching Bphp1. The PA images were acquired at 750 nm. (c) Coronal-view US and AA images of the mouse tumor region. The circles indicate the positions of implanted tumors. (d) Axial cross-sectional PA images at the ON and OFF state of the Bphp1 tumor. The position of the cross-section is indicated in the US image in (c). (e) Differential PA image between the ON and OFF state, showing the tumor only. (f) The differential image overlayed with PA and US images. (g) PA signal changes from tumor and blood over multiple photoswitching cycles.
In this experiment, we implanted transgenic Bphp1-expressing 4T1 tumor cells into the mouse flanks and imaged the tumor regions after three weeks with US, AA, and PA modes. Bphp1-expressing 4T1 cells were grown in DMEM supplemented with 10% FBS and 1% penicillin-streptomycin mixture at 37 °C in 5% CO2 atmosphere. BphP1-expressing 4T1 cells (4 × 10⁴) were injected subcutaneously under the 4th mammary fat pad of the BALB/c mouse. The mouse was imaged when the tumor diameter was ~5 mm. A total of 8s of 635 nm CW light was used for switching on the Bphp1 protein, followed by 8s of 750nm pulse light for both PA imaging and switching off the protein (Fig. 6a). We acquired 24 switching cycles and averaged the images accordingly. Only one single cross-section at the mouse tumor region was imaged for the PA mode due to the long imaging time of the photoswitching process. Differential images were obtained by subtracting the OFF-state images from the ON-state images [29], [46].
III. Experimental Results
A. Characterization of PAUSAT
The schematic and working principle of the PAUSAT system is shown in Figs. 1a–c. We characterized the PAUSAT system’s spatial resolutions as shown in Figs. 1d–e. The lateral, axial and elevational resolutions of the PA mode at 25 mm from the linear array surface were 412.5 μm, 418.7 μm, and 1.73 mm respectively. The US mode had an axial resolution of 118.7 μm, lateral resolution of 206.9 μm and elevational resolution of 190.8 μm at 15MHz, which are close to the theoretical values. The spatial resolutions of the AA mode should be slightly worse than the US mode, since the same wobbler is used but the AA mode only involves one-way ultrasound focusing.
A pregnant mouse was used to measure the penetration depth of the wobbler and PA. The wobbler can be operated at different frequencies, resulting in different spatial resolutions and penetration depths, due to the frequency-dependent attenuation of ultrasound waves. As shown in Fig. 1e, cross-sectional US images of a pregnant mouse were acquired at three transmission frequencies of 15 MHz, 25 MHz and 35 MHz. High-frequency US images provide better spatial resolution but smaller penetration depth. In our studies, 15 MHz was used for animal studies to achieve a balanced US penetration depth and spatial resolution. The penetration depth of the PA mode is shown in Fig. 1g, and blood vessels located at ~9 mm beneath the skin were well imaged with an estimated optical fluence of 5 mJ/cm2 at 1064 nm on the skin surface.
B. Validation of the PAUSAT System on Phantoms
As shown in Fig. 2a, all three imaging modes were able to delineate the shape of the knot based on different contrasts. The US image provides a sharp image of the tube wall, however, also shows the imaging window membrane which the tube is resting on. AA mode displays similar resolution; however, it exhibits almost no background signal and, consequently, high contrast of the tube lumen. The PA mode has worse resolution than the US and AA mode, due to the weak elevational focusing of the linear array and lower ultrasonic center frequency.
Fig. 2. PAUSAT system validation on phantoms.
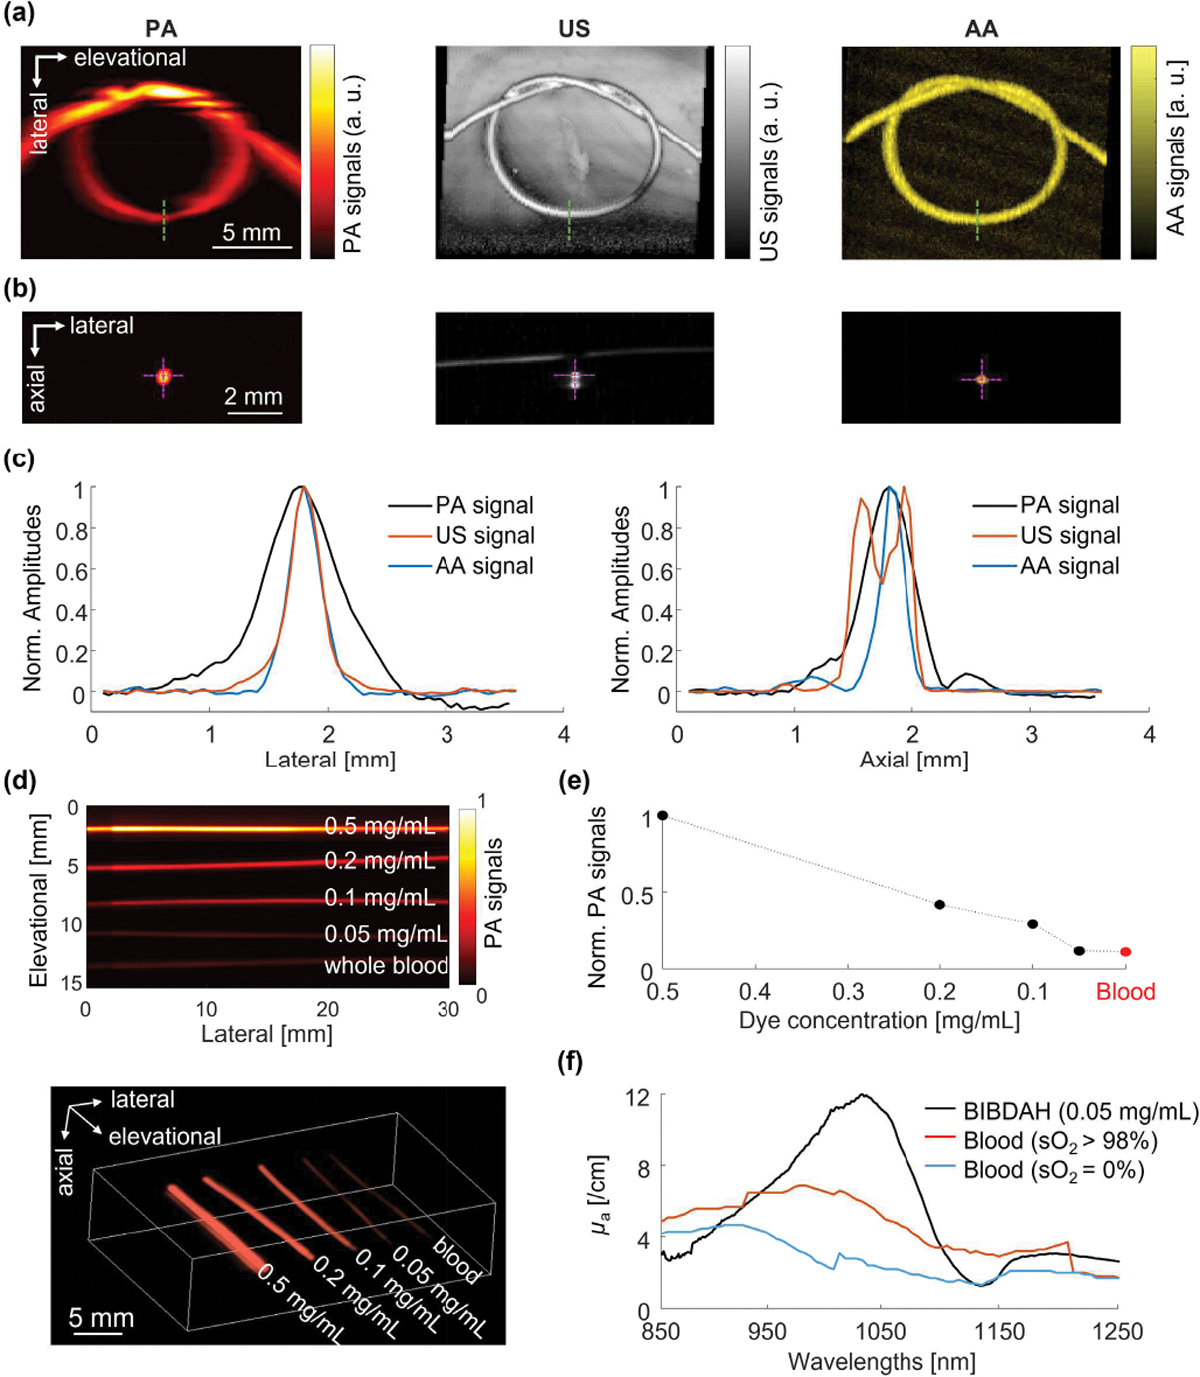
(a) Images of a tube knot filled with BIBDAH, water, and microbubbles with PA, US, and AA, respectively. (b) Cross-sectional images of the tube along the green-dotted lines in (a). (c) Lateral and axial signal profiles along the magenta dotted lines in (b). (d) Top-view projection PA image and 3D rendering of tubes filled with blood and BIBDAH dye at different concentrations. (e) Quantitative PA signals from blood and dyes. (f) Optical absorption spectra of BIBDAH at 50 μg/ml, oxygenated and deoxygenated blood.
The cross-sectional images are shown in Fig. 2b, with the axial and lateral profiles shown in Fig. 2c. In the axial direction, the US image shows both top and bottom walls of the tube, while the PA and AA images show the lumen of the tube. Figure 2d shows the PA images of BIBDAH-filled tubes with different concentrations. The quantitative results in Fig. 2e show that the PA signal amplitude is proportional to the dye concentration, which is the foundation for spectroscopic PA measurement. The PA signals of whole bovine blood were also acquired at 1064 nm, which were comparable to that of the BIBDAH dye with a 50 μg/mL concentration. The strong PA performance of the dye is consistent with the optical absorption spectra of the BIBDAH dye and blood in Fig. 2f [47].
C. PAUSAT Validation on Small Animals
The PAUSAT system is validated on small animal imaging. Figure 3b shows the maximum amplitude projection images along the elevational direction. The artificial tumor was clearly imaged by the US mode as a hypoechogenic mass with a contrast to noise ratio (CNR) of 3.01, since the Matrigel had low acoustic reflectivity [48]. The AA mode provided abundant vascular network around the tumor implant but was not able to clearly delineate the tumor region. The PA image highlighted the strongest BIBDAH signals from the tumor region with a CNR of 14.38, much better than the US image.
Fig. 3. PAUSAT system validation on small animals.

(a) The implantation position of the BIBDAH dye mixed Matrigel tumor. (b) Axial cross-sectional images of the mouse liver region by the PA, US, and AA mode. (c) Coronal images of the liver region by the PA, US, and AA mode. US shows one slice where the liver was located while AA and PA show the maximum amplitude projections. (d) Three-dimensional rendering of the superimposed PA (in hot color), US (in gray color), and AA (in yellow color) images. (e) Superimposed images of different imaging modes showing the relative positions of the targets.
The complementary nature of the three imaging modes can be more clearly visualized from the coronal cross-sectional images shown in Fig. 3c. The liver region was located by the US image, and the AA image provided the fine vascular architecture of the liver. The PA image highlighted the tumor implant. Figure 3d shows the 3D rendering of the merged images combining the three imaging modalities (Supplementary Video 2). Linear image interpolation was performed to generate consistent image pixel sizes before the image co-registration. Figure 3e further shows the superimposed images of the US, AA and PA modes, illustrating the relative positions of the liver, the hepatic blood vasculature and the artificial tumor.
D. Longitudinal Imaging of the Mouse Pregnancy
The developing embryos and placenta were imaged by the US mode (Fig. 4a) and the PA mode (Fig. 4d) every two days from E9 to E17, and by the AA mode (Fig. 4e) at E9, E13 and E17. A larger field of view for the US mode than the other two modes was used to find the region of interest. Multiple fetuses were identified by all three imaging modalities. The development of a representative embryo over the 9 days is shown in the close-up US images in Fig. 4b and Supplementary Video 3. The embryonic body part such as the head, the spinal cord and the tail were clearly resolved. The crown-rump length (CRL), which is the length of the embryo from the top of its head to the bottom torso, is an important clinical parameter to estimate the embryo’s gestation age (GA) [49]. We measured the CRL values of the visible embryos at each imaged gestation age from the US images (Fig. 4c). A linear fitting was performed to show the growth rate of the embryos. To verify the accuracy of the CRL measurements, we adapted a CRL prediction model describing the change of the CRL with GA as CRL = −9.42 + 1.09 (GA) + 0.0281 (GA)2 [49]. From both our US measurements and predictions model, it can be observed that CRL increased approximately linearly with the gestation age. Figure 4d and Supplementary Video 4 show the PA images of the mother mouse at the abdominal area. The green dotted lines indicate the same landmark blood vessels at different time o can then be located from the PA images based on the landmark vessels as indicated by the green rectangles. In the AA images in Fig. 4e and Supplementary Video 5, we can clearly visualize blood vessels in the maternal organs, as well as the placentas since E13. The embryos were not visible in the AA mode because the microbubbles could not pass the placental barrier [50]. The green boxes in Figs. 4d–e indicate the locations of the embryos shown in Fig. 4a. The cross-sectional projection of the AA signals at E13 is shown in Fig. 4f. In the AA mode, the blood vessels in the mouse skin were digitally removed to better present the embryo morphology (Fig. 4f). More blood vessels can be visualized in the all-depth projection image. The three-dimensional AA images are shown in Supplementary Video 6. In addition, since the placental size is an indicator of fetal development and pregnancy outcome, we measured placental diameter (PD) and placental thickness (PT) in the US and AA images for all the embryos at E11, E13 and E15 (Fig. 4g), where the placentas were well identified. The measured placental sizes at these gestation age agreed with the predicting models as PD = −11.96 + 2.09(GA) − 0.046(GA)2 − 0.0005(GA)3 and PT = 4.10 − 1.14(GA) + 0.115(GA)2 − 0.0031(GA)3 [49].
Fig. 4. Longitudinal imaging of mouse pregnancy by PAUSAT.

(a) Longitudinal US images of a pregnant mouse at E9, E11, E13, E15 and E17. (b) Close-up images of a single embryo from E9 to E17. (c) Embryo’s crown-rump length measured from the US images (black dots), the linear fitting (red dots), and the model prediction (blue curve). (d) Longitudinal PA images of the pregnant mouse. (e) Longitudinal AA images of the maternal vasculature and placentas. (f) Comparison of the top-view projected AA images with (all-depth projection) and without (white box projection) the skin layer. (g) Placental diameter (PD) and placental thickness (PT) measurements from the US and AA images for individual embryos (black dots), the averaged values (red dots), and the model prediction (blue curves). Green boxes in (a), (c) and (e) marks the position of the same embryo.
E. Tracking the Biodistribution of an NIR-II Dye
The coronal PA images of the mouse before and after administrating BIBDAH via the tail vein are shown in Fig. 5a. A clear increase in the PA signal strength was observed in the major blood vessels right after the dye injection. The PA signal of the dye at 0.1 mg/mL was ~5 times higher than that of the blood. The blood vessels imaged by the PA mode were mostly detected along the elevational direction, while much fewer vessels were detected along the lateral direction, since PA signals generated from blood vessels are strongly orientation dependent [51]. The PA signals from the lateral blood vessels were not detected by the full aperture of the linear transducer array, which resulted in their low visibility. Within 4 hours, the PA signals increased by 5 times in the liver, indicating that the dye was accumulated in the liver, consistent with previous results [37]. The molecular detection sensitivity of the dye can be estimated. The concentration of the BIBDAH dye in the blood stream was ~0.067 mg/mL. Given the signal to noise ratio of the dye image (~22.3), the estimated noise equivalent detection sensitivity is ~3 μg/mL. This sensitivity can be improved by increasing the optical fluence of the excitation light and performing signal averaging.
Fig. 5. Tracking the biodistribution of an NIR-II dye.

(a) PA images of the mouse liver region before and after the injection of an NIR-II dye BIBDAH. (b) Axial cross-sectional images of the liver region indicated by the white arrow in (a). (c) PA signal dynamics in the major blood vessels and in the liver region as indicated by the green square in (a). (d) 3D rendering of the superimposed US (shown in gray) and PA (shown in color) image of the mouse 4 hours post-injection.
Figure 5b shows representative cross-sectional images of the liver region acquired at three time points. The images are shown in a logarithmic scale to highlight deeper signals. These results show that the penetration depth of the PA mode was improved after injecting the dye, as marked by the white dotted circle. Figure 5c shows the PA signal dynamics from the major blood vessels in the skin and from the liver. The 3D superimposed PA and US image of the liver region is shown in Fig. 5d. The PA signals in the liver continuously increased over four hours, showing the accumulation of dye in the liver. By contrast, the PA signals in the skin blood vessels reached a plateau one hour after injection. The persistent dye signals in the blood vessels are due to the relatively high concentration of dye. The slow clearance of the dye from the blood stream to the liver did not affect the PA signals in the blood vessels.
F. Detecting Reversibly-Photoswitching Tumors
Axial-view US and AA images of the Bphp1-expressing tumor locations are shown in Fig. 6c, with the two tumor locations identified. The tumors showed low echogenicity in the US image, and no noticeable increase in blood perfusion was observed inside the tumors from the AA image. The PA images of the tumors acquired with BphP1 at the ON and OFF states were dominated by the background signals from hemoglobin (Fig. 6d). By contrast, the differential PA image between the ON and OFF state can clearly detect the tumor signals with the background hemoglobin signals effectively suppressed (Fig. 6e). The differential PA image was then compared with the US image (Fig. 6f), and the Bphp1-expressing tumor locations correspond well with the US-detected tumor positions. Representative PA signals from the tumor and background over several switching cycles are shown in Fig. 6g, in which repeatable photoswitching was observed from the tumors but not from the blood.
IV. Discussions
In this work, we have integrated three imaging modalities (PA, US and AA) into a single preclinical imaging platform by modifications of the commercial VEGA system, such as PA light delivery and acoustic detection, co-registered elevational scanning of the PA/US/AA modes, trigger synchronization, data acquisition and image registration. This platform has demonstrated the capability of providing complementary anatomical, functional and molecular information of the same target without transferring between different devices and the three imaging modes are automatically co-registered.
Compared with the US and AA mode that use high-frequency ultrasound, the PA mode has worse lateral and axial resolutions, which can be further improved by using an ultrasound array with a higher central frequency and broader bandwidth. The elevational resolution of the PA mode is limited by the elevational focusing, which can be improved by changing the scanning geometry or applying advanced 3D reconstruction algorithms [52]–[54]. The penetration depth of the US and AA mode is scalable, depending on the transmission ultrasound frequency. The penetration depth of the PA mode is fundamentally limited by the optical attenuation of the tissue, and can be improved by illuminating the mouse from multiple angles [55]. We can potentially use the wobbler to acquire PA images by incorporating a multi-mode optical fiber onto the wobbler, which, however, is challenging due to high-speed scanning of the wobbler.
Another limitation of the current PAUSAT system is that two ultrasound transducers are used for three imaging modes that have increased the complexity in the image co-registration and prevented acquiring all three images simultaneously. While the US and AA modes share the same ultrasound transducer and therefore are naturally registered, the PA mode needs to be co-registered with the US and AA mode using geometric information of the two transducers. Geometric registration works well given stationary of the imaging subject, however if the animal moves between scans (e.g., muscle spasm, incomplete anesthesia) registration fidelity may decrease. Another method to register images from different modalities is matching the blood vessels from both AA and PA images with non-rigid registration techniques [56]. Artificial markers attached to the animal that can be imaged by all three imaging modes could also be used to achieve more precise image registration.
The stock concentration of microbubble used in the AA mode is 2 × 10⁹ bubbles/ml. The relatively high microbubble concentration is necessary due to the passive bubble clearance in the blood stream and the active bubble bursting by the ultrasound pulses. Previous studies have shown that without active bursting, the lifetime of microbubbles in the blood stream depends on the bubble size. Microbubbles with a diameter of 1 μm can last for ~5 mins in the blood circulation before the bubble signals drop to the background level [57], [58]. In our study, we used a size-sorting process to produce larger microbubbles with a diameter of 5 μm that could last longer in the circulation system and thus allow a longer imaging time window [59]. Nevertheless, the AA mode actively burst the bubbles to generate high-frequency harmonic signals, which accelerates the bubble clearance rate. Also, in our current setting, the AA mode averages multiple repeated frames at each location in order to improve the contrast of the major blood vessels, which, can suppress the signals from small vessels, especially capillaries with low flow speed. This multiframe averaging further speeds up the microbubble clearance. Ultimately, we have an average microbubble lifetime of ~20 mins in the blood circulation, which is sufficient to cover a field of view of 20 mm by 40 mm. Reducing the frame averaging can prolong the bubble lifetime at the price of image contrast. An alternative approach to maintain a longer bubble circulation time is to use a continuous infusion pump by placing a catheter into the vein.
In the pregnant mouse imaging (Fig. 4), the major organs of the mouse embryos can be well resolved with the US mode and the maternal blood vasculature can be seen with the AA mode. While microbubbles are considered safe for in vivo imaging, the active bubble bursting may be a safety concern [60], [61]. The bubble busting may generate high-pressure micro-streams that can change the permeability of the syncytiotrophoblast, which is the maternal-embryo exchange interface and a protective barrier [50], [62]. Previous studies on the blood-brain barrier have shown that this bubble-induced effect on the barrier permeability is transient, if present [63]. In our experiments, we did not observe any adverse effects on the maternal and embryo functions over the gestation period after the start of imaging. The US images confirmed the normal progress of pregnancy up to the delivery. We also noticed that the embryos were generally invisible in the AA images, indicating that the microbubbles could not cross the placental barrier and therefore the risk of barrier permeability was low. The PA mode could not provide clear coronal images of the embryos because it was limited by the elevational resolution; however, PA mode may be used for other functional studies of mouse pregnancy, such as fetal oxygenation measurement and drug delivery monitoring [64]–[66].
From the US and AA images in Fig. 4, we can see half-moon-shaped organs close to the embryos while they were not visible in PA images before E11. Since mature mouse placentas are established around mid-gestation (~E10.5) [67], these observed organs are most likely decidua before E10.5 and placentas afterwards. While the US mode can image the structure of the embryo, the placenta and other attached organs, the PA mode images the blood vessels of these organs. On E9, the placenta vasculature was not well developed yet, so it was not visible by the PA mode. The basal decidua becomes progressively thinner over the pregnancy while placental villi within the labyrinth zones proliferate rapidly [68], [69]. The AA signals of the placenta were weaker at E17, probably because the placentas were pushed to deeper regions with the developing embryos. The imaging depth of the AA mode can be improved by using microbubbles with smaller diameters, which can lower the pressure threshold needed to burst the bubbles in deep tissues [70], [71]. The weaker placenta signals in PA images at E17 are likely due to the insufficient light penetration depth. Again, improving the light illumination geometry can help increase the imaging depth of the PA mode.
V. Conclusions
In this work, we have presented a 3D non-invasive small-animal imaging system that combines photoacoustic, ultrasound, and acoustic angiography imaging in a single device. PAUSAT can provide complementary information about biological tissues: structural information with US mode, vascular information with AA mode, and molecular information with PA mode. We performed in vitro studies to characterize the system and showed that high spatial resolutions are achieved by all three imaging modes for deep tissues. We also demonstrated the system’s in vivo performance in various proof-of-concept small animal studies, including longitudinal monitoring of mouse pregnancy, tracking the biodistribution of an NIR-II dye, and detecting reversible photoswitching tumors. All the results collectively show the flexibility and versatility of the PAUSAT system for small animal studies, and potential wide applicability in a variety of basic research.
Supplementary Material
Acknowledgment
The authors thank Dr. Caroline Connor for editing the manuscript and Kun Xiang for technical support and useful discussion on animal experiments.
This work was sponsored by National Institutes of Health (R01 EB028143, R01 NS111039, RF1 NS115581, R21 EB027304, R21EB027981, R43 CA243822, R43 CA239830, R44 HL138185); American Heart Association Collaborative Sciences Award (18CSA34080277); Chan Zuckerberg Initiative Grant on Deep Tissue Imaging 2020–226178 by Silicon Valley Community Foundation; All to J.Y.
Contributor Information
Mucong Li, Department of Biomedical Engineering, Duke University, Durham, NC 27708, USA.
Nathan Beaumont, SonoVol, Inc., Research Triangle Park, Durham, NC 27713, USA.
Chenshuo Ma, Department of Biomedical Engineering, Duke University, Durham, NC 27708, USA.
Juan Rojas, SonoVol, Inc., Research Triangle Park, Durham, NC 27713, USA.
Tri Vu, Department of Biomedical Engineering, Duke University, Durham, NC 27708, USA.
Max Harlacher, SonoVol, Inc., Research Triangle Park, Durham, NC 27713, USA.
Graeme O’Connell, SonoVol, Inc., Research Triangle Park, Durham, NC 27713, USA.
Ryan C. Gessner, SonoVol, Inc., Research Triangle Park, Durham, NC 27713, USA
Hailey Kilian, Department of Biomedical Engineering, University of Buffalo, State University of New York, Buffalo, NY 14260, USA.
Ludmila Kasatkina, Department of Anatomy and Structural Biology, and Gruss-Lipper Biophotonics Center, Albert Einstein College of Medicine, Bronx, NY 10461, USA.
Yong Chen, Department of Biomedical Engineering, Duke University, Durham, NC 27708, USA.
Qiang Huang, Department of Biomedical Engineering, Duke University, Durham, NC 27708, USA.
Xiling Shen, Department of Biomedical Engineering, Duke University, Durham, NC 27708, USA.
Jonathan F. Lovell, Department of Biomedical Engineering, University of Buffalo, State University of New York, Buffalo, NY 14260, USA
Vladislav V. Verkhusha, Department of Anatomy and Structural Biology, and Gruss-Lipper Biophotonics Center, Albert Einstein College of Medicine, Bronx, NY 10461, USA
Tomek Czernuszewicz, SonoVol, Inc., Research Triangle Park, Durham, NC 27713, USA.
Junjie Yao, Department of Biomedical Engineering, Duke University, Durham, NC 27708, USA.
References
- [1].Cunha L et al. , “Preclinical imaging: an essential ally in modern biosciences,” Mol Diagn Ther, vol. 18, no. 2, pp. 153–73, Apr 2014. [DOI] [PubMed] [Google Scholar]
- [2].Lewis JS, Achilefu S, Garbow JR, Laforest R, and Welch MJ, “Small animal imaging. current technology and perspectives for oncological imaging,” Eur J Cancer, vol. 38, no. 16, pp. 2173–88, Nov 2002. [DOI] [PubMed] [Google Scholar]
- [3].Pandit P, Johnston SM, Qi Y, Story J, Nelson R, and Johnson GA, “The utility of micro-CT and MRI in the assessment of longitudinal growth of liver metastases in a preclinical model of colon carcinoma,” Acad Radiol, vol. 20, no. 4, pp. 430–9, Apr 2013. [DOI] [PMC free article] [PubMed] [Google Scholar]
- [4].Vaquero JJ and Kinahan P, “Positron Emission Tomography: Current Challenges and Opportunities for Technological Advances in Clinical and Preclinical Imaging Systems,” Annu Rev Biomed Eng, vol. 17, pp. 385–414, 2015. [DOI] [PMC free article] [PubMed] [Google Scholar]
- [5].Hutchinson JC, Shelmerdine SC, Simcock IC, Sebire NJ, and Arthurs OJ, “Early clinical applications for imaging at microscopic detail: microfocus computed tomography (micro-CT),” (in English), British Journal of Radiology, vol. 90, no. 1075, 2017. [DOI] [PMC free article] [PubMed] [Google Scholar]
- [6].Jiang Y, Zhao J, White DL, and Genant HK, “Micro CT and Micro MR imaging of 3D architecture of animal skeleton,” J Musculoskelet Neuronal Interact, vol. 1, no. 1, pp. 45–51, Sep 2000. [PubMed] [Google Scholar]
- [7].Ashton JR, West JL, and Badea CT, “In vivo small animal micro-CT using nanoparticle contrast agents,” (in English), Frontiers in Pharmacology, vol. 6, Nov 4 2015. [DOI] [PMC free article] [PubMed] [Google Scholar]
- [8].Judenhofer MS and Cherry SR, “Applications for preclinical PET/MRI,” Semin Nucl Med, vol. 43, no. 1, pp. 19–29, Jan 2013. [DOI] [PubMed] [Google Scholar]
- [9].Lee CL et al. , “Assessing cardiac injury in mice with dual energy-microCT, 4D-microCT, and microSPECT imaging after partial heart irradiation,” Int J Radiat Oncol Biol Phys, vol. 88, no. 3, pp. 686–93, Mar 1 2014. [DOI] [PMC free article] [PubMed] [Google Scholar]
- [10].Clark DP and Badea CT, “Micro-CT of rodents: state-of-the-art and future perspectives,” Phys Med, vol. 30, no. 6, pp. 619–34, Sep 2014. [DOI] [PMC free article] [PubMed] [Google Scholar]
- [11].Cavanaugh D, Johnson E, Price RE, Kurie J, Travis EL, and Cody DD, “In vivo respiratory-gated micro-CT imaging in small-animal oncology models,” Mol Imaging, vol. 3, no. 1, pp. 55–62, Jan 2004. [DOI] [PubMed] [Google Scholar]
- [12].Ambrosini V et al. , “Small animal PET in oncology: the road from bench to bedside,” Cancer Biother Radiopharm, vol. 24, no. 2, pp. 277–85, Apr 2009. [DOI] [PubMed] [Google Scholar]
- [13].Hoyer C, Gass N, Weber-Fahr W, and Sartorius A, “Advantages and challenges of small animal magnetic resonance imaging as a translational tool,” Neuropsychobiology, vol. 69, no. 4, pp. 187–201, 2014. [DOI] [PubMed] [Google Scholar]
- [14].Darne C, Lu Y, and Sevick-Muraca EM, “Small animal fluorescence and bioluminescence tomography: a review of approaches, algorithms and technology update,” Phys Med Biol, vol. 59, no. 1, pp. R1–64, Jan 6 2014. [DOI] [PubMed] [Google Scholar]
- [15].Davis SC and Tichauer KM, “Small-Animal Imaging Using Diffuse Fluorescence Tomography,” Methods Mol Biol, vol. 1444, pp. 123–37, 2016. [DOI] [PubMed] [Google Scholar]
- [16].Henriquez NV et al. , “Advances in optical imaging and novel model systems for cancer metastasis research,” Clin Exp Metastasis, vol. 24, no. 8, pp. 699–705, 2007. [DOI] [PubMed] [Google Scholar]
- [17].Puaux AL et al. , “A comparison of imaging techniques to monitor tumor growth and cancer progression in living animals,” Int J Mol Imaging, vol. 2011, p. 321538, 2011. [DOI] [PMC free article] [PubMed] [Google Scholar]
- [18].Greco A et al. , “Ultrasound biomicroscopy in small animal research: applications in molecular and preclinical imaging,” J Biomed Biotechnol, vol. 2012, p. 519238, 2012. [DOI] [PMC free article] [PubMed] [Google Scholar]
- [19].Hyvelin JM et al. , “Use of ultrasound contrast agent microbubbles in preclinical research: recommendations for small animal imaging,” Invest Radiol, vol. 48, no. 8, pp. 570–83, Aug 2013. [DOI] [PubMed] [Google Scholar]
- [20].Sun L, Xu X, Richard WD, Feng C, Johnson JA, and Shung KK, “A high-frame rate duplex ultrasound biomicroscopy for small animal imaging in vivo,” IEEE Trans Biomed Eng, vol. 55, no. 8, pp. 2039–49, Aug 2008. [DOI] [PubMed] [Google Scholar]
- [21].Dayton PA et al. , “The implementation of acoustic angiography for microvascular and angiogenesis imaging,” Annu Int Conf IEEE Eng Med Biol Soc, vol. 2014, pp. 4283–5, 2014. [DOI] [PubMed] [Google Scholar]
- [22].Newsome IG and Dayton PA, “Visualization of Microvascular Angiogenesis Using Dual-Frequency Contrast-Enhanced Acoustic Angiography: A Review,” Ultrasound Med Biol, vol. 46, no. 10, pp. 2625–2635, Oct 2020. [DOI] [PMC free article] [PubMed] [Google Scholar]
- [23].Shelton SE, Lindsey BD, Tsuruta JK, Foster FS, and Dayton PA, “Molecular Acoustic Angiography: A New Technique for High-resolution Superharmonic Ultrasound Molecular Imaging,” Ultrasound Med Biol, vol. 42, no. 3, pp. 769–81, Mar 2016. [DOI] [PMC free article] [PubMed] [Google Scholar]
- [24].Wang LV and Hu S, “Photoacoustic tomography: in vivo imaging from organelles to organs,” Science, vol. 335, no. 6075, pp. 1458–62, Mar 23 2012. [DOI] [PMC free article] [PubMed] [Google Scholar]
- [25].Wang LV and Yao J, “A practical guide to photoacoustic tomography in the life sciences,” Nat Methods, vol. 13, no. 8, pp. 627–38, Jul 28 2016. [DOI] [PMC free article] [PubMed] [Google Scholar]
- [26].Beard P, “Biomedical photoacoustic imaging,” Interface Focus, vol. 1, no. 4, pp. 602–31, Aug 6 2011. [DOI] [PMC free article] [PubMed] [Google Scholar]
- [27].Li M, Tang Y, and Yao J, “Photoacoustic tomography of blood oxygenation: A mini review,” Photoacoustics, vol. 10, pp. 65–73, Jun 2018. [DOI] [PMC free article] [PubMed] [Google Scholar]
- [28].Li MC, Nyayapathi N, Kilian HI, Xia J, Lovell JF, and Yao JJ, “Sound Out the Deep Colors: Photoacoustic Molecular Imaging at New Depths,” (in English), Molecular Imaging, vol. 19, Dec 18 2020. [DOI] [PMC free article] [PubMed] [Google Scholar]
- [29].Yao JJ et al. , “Multiscale photoacoustic tomography using reversibly switchable bacterial phytochrome as a near-infrared photochromic probe,” (in English), Nature Methods, vol. 13, no. 1, pp. 67–+, Jan 2016. [DOI] [PMC free article] [PubMed] [Google Scholar]
- [30].Gessner RC, Frederick CB, Foster FS, and Dayton PA, “Acoustic angiography: a new imaging modality for assessing microvasculature architecture,” Int J Biomed Imaging, vol. 2013, p. 936593, 2013. [DOI] [PMC free article] [PubMed] [Google Scholar]
- [31].Gessner RC, Aylward SR, and Dayton PA, “Mapping Microvasculature with Acoustic Angiography Yields Quantifiable Differences between Healthy and Tumor-bearing Tissue Volumes in a Rodent Model,” (in English), Radiology, vol. 264, no. 3, pp. 733–740, Sep 2012. [DOI] [PMC free article] [PubMed] [Google Scholar]
- [32].Czernuszewicz TJ et al. , “A new preclinical ultrasound platform for widefield 3D imaging of rodents,” Rev Sci Instrum, vol. 89, no. 7, p. 075107, Jul 2018. [DOI] [PMC free article] [PubMed] [Google Scholar]
- [33].Lasso A, Heffter T, Rankin A, Pinter C, Ungi T, and Fichtinger G, “PLUS: open-source toolkit for ultrasound-guided intervention systems,” IEEE Trans Biomed Eng, vol. 61, no. 10, pp. 2527–37, Oct 2014. [DOI] [PMC free article] [PubMed] [Google Scholar]
- [34].Xu M and Wang LV, “Universal back-projection algorithm for photoacoustic computed tomography,” Phys Rev E Stat Nonlin Soft Matter Phys, vol. 71, no. 1 Pt 2, p. 016706, Jan 2005. [DOI] [PubMed] [Google Scholar]
- [35].Wang Z, Li J, and Wu R, “Time-delay- and time-reversal-based robust Capon beamformers for ultrasound imaging,” IEEE Trans Med Imaging, vol. 24, no. 10, pp. 1308–22, Oct 2005. [DOI] [PubMed] [Google Scholar]
- [36].Izumizaki M, Pokorski M, Ishihara Y, Iwase M, and Homma I, “Effect of body position on ventilatory responses in anaesthetised mice,” Comp Biochem Physiol A Mol Integr Physiol, vol. 141, no. 2, pp. 133–9, Jun 2005. [DOI] [PubMed] [Google Scholar]
- [37].Kilian HI et al. , “Facile formulation of a long-wavelength cyanine for optical imaging in the second near-infrared window,” Biomater Sci, vol. 8, no. 15, pp. 4199–4205, Aug 7 2020. [DOI] [PMC free article] [PubMed] [Google Scholar]
- [38].Nishiyama M, Namita T, Kondo K, Yamakawa M, and Shiina T, “Ring-array photoacoustic tomography for imaging human finger vasculature,” J Biomed Opt, vol. 24, no. 9, pp. 1–12, Sep 2019. [DOI] [PMC free article] [PubMed] [Google Scholar]
- [39].Laufer J, Zhang E, Raivich G, and Beard P, “Three-dimensional noninvasive imaging of the vasculature in the mouse brain using a high resolution photoacoustic scanner,” Appl Opt, vol. 48, no. 10, pp. D299–306, Apr 1 2009. [DOI] [PubMed] [Google Scholar]
- [40].Taruttis A, Timmermans AC, Wouters PC, Kacprowicz M, van Dam GM, and Ntziachristos V, “Optoacoustic Imaging of Human Vasculature: Feasibility by Using a Handheld Probe,” Radiology, vol. 281, no. 1, pp. 256–63, Oct 2016. [DOI] [PubMed] [Google Scholar]
- [41].Ku G and Wang LV, “Deeply penetrating photoacoustic tomography in biological tissues enhanced with an optical contrast agent,” Opt Lett, vol. 30, no. 5, pp. 507–9, Mar 1 2005. [DOI] [PubMed] [Google Scholar]
- [42].Zhang Q et al. , “Gold nanoparticles as a contrast agent for in vivo tumor imaging with photoacoustic tomography,” Nanotechnology, vol. 20, no. 39, p. 395102, Sep 30 2009. [DOI] [PubMed] [Google Scholar]
- [43].Luke GP, Yeager D, and Emelianov SY, “Biomedical applications of photoacoustic imaging with exogenous contrast agents,” Ann Biomed Eng, vol. 40, no. 2, pp. 422–37, Feb 2012. [DOI] [PubMed] [Google Scholar]
- [44].Huang Q et al. , “Intravital imaging of mouse embryos,” Science, vol. 368, no. 6487, pp. 181–186, 2020. [DOI] [PMC free article] [PubMed] [Google Scholar]
- [45].Mishra K et al. , “Multiplexed whole-animal imaging with reversibly switchable optoacoustic proteins,” Sci Adv, vol. 6, no. 24, p. eaaz6293, Jun 2020. [DOI] [PMC free article] [PubMed] [Google Scholar]
- [46].Li L et al. , “Small near-infrared photochromic protein for photoacoustic multi-contrast imaging and detection of protein interactions in vivo,” Nat Commun, vol. 9, no. 1, p. 2734, Jul 16 2018. [DOI] [PMC free article] [PubMed] [Google Scholar]
- [47].Bosschaart N, Edelman GJ, Aalders MC, van Leeuwen TG, and Faber DJ, “A literature review and novel theoretical approach on the optical properties of whole blood,” Lasers Med Sci, vol. 29, no. 2, pp. 453–79, Mar 2014. [DOI] [PMC free article] [PubMed] [Google Scholar]
- [48].Demitri C, Sannino A, Conversano F, Casciaro S, Distante A, and Maffezzoli A, “Hydrogel based tissue mimicking phantom for in-vitro ultrasound contrast agents studies,” J Biomed Mater Res B Appl Biomater, vol. 87, no. 2, pp. 338–45, Nov 2008. [DOI] [PubMed] [Google Scholar]
- [49].Mu JW, Slevin JC, Qu D, McCormick S, and Adamson SL, “In vivo quantification of embryonic and placental growth during gestation in mice using micro-ultrasound,” (in English), Reproductive Biology and Endocrinology, vol. 6, Aug 12 2008. [DOI] [PMC free article] [PubMed] [Google Scholar]
- [50].Roberts VHJ and Frias AE, “Contrast-enhanced ultrasound for the assessment of placental development and function,” (in English), Biotechniques, vol. 69, no. 5, pp. 392–399, Oct 2020. [DOI] [PMC free article] [PubMed] [Google Scholar]
- [51].Preisser S et al. , “Vessel orientation-dependent sensitivity of optoacoustic imaging using a linear array transducer,” J Biomed Opt, vol. 18, no. 2, p. 26011, Feb 2013. [DOI] [PubMed] [Google Scholar]
- [52].Wang YH, Zhan Y, Tiao MLD, and Xia J, “Review of methods to improve the performance of linear array-based photoacoustic tomography,” (in English), Journal of Innovative Optical Health Sciences, vol. 13, no. 2, Mar 2020. [Google Scholar]
- [53].Xia J et al. , “Three-dimensional photoacoustic tomography based on the focal-line concept,” J Biomed Opt, vol. 16, no. 9, p. 090505, Sep 2011. [DOI] [PMC free article] [PubMed] [Google Scholar]
- [54].Fehm TF, Dean-Ben XL, Ford SJ, and Razansky D, “In vivo whole-body optoacoustic scanner with real-time volumetric imaging capacity,” (in English), Optica, vol. 3, no. 11, pp. 1153–1159, Nov 20 2016. [Google Scholar]
- [55].Wu YL, Zeng F, Zhao YL, and Wu SZ, “Emerging contrast agents for multispectral optoacoustic imaging and their biomedical applications,” (in English), Chemical Society Reviews, vol. 50, no. 14, pp. 7924–7940, Jul 21 2021. [DOI] [PubMed] [Google Scholar]
- [56].Mattes D, Haynor DR, Vesselle H, Lewellen TK, and Eubank W, “PET-CT image registration in the chest using free-form deformations,” (in English), Ieee Transactions on Medical Imaging, vol. 22, no. 1, pp. 120–128, Jan 2003. [DOI] [PubMed] [Google Scholar]
- [57].Streeter JE, Gessner R, Miles I, and Dayton PA, “Improving sensitivity in ultrasound molecular imaging by tailoring contrast agent size distribution: in vivo studies,” Mol Imaging, vol. 9, no. 2, pp. 87–95, Apr 2010. [PMC free article] [PubMed] [Google Scholar]
- [58].Shashank Sirsi JF, Mark Borden, Shunichi Homma, “High-frequency ultrasound imaging of size-isolated microbubbles in mice,” IEEE International Ultrasonics Symposium Proceedings, vol. 20-23, no. Sept. 2009, 2009. [Google Scholar]
- [59].Feshitan JA, Chen CC, Kwan JJ, and Borden MA, “Microbubble size isolation by differential centrifugation,” J Colloid Interface Sci, vol. 329, no. 2, pp. 316–24, Jan 15 2009. [DOI] [PubMed] [Google Scholar]
- [60].Kimmel E, “Cavitation bioeffects,” Crit Rev Biomed Eng, vol. 34, no. 2, pp. 105–61, 2006. [DOI] [PubMed] [Google Scholar]
- [61].Yuan F, Yang C, and Zhong P, “Cell membrane deformation and bioeffects produced by tandem bubble-induced jetting flow,” Proc Natl Acad Sci U S A, vol. 112, no. 51, pp. E7039–47, Dec 22 2015. [DOI] [PMC free article] [PubMed] [Google Scholar]
- [62].Annemieke van Wamel AB, Cate Folkert ten, de Jong Nico, “Effects of Diagnostic Ultrasound Parameters on Molecular Uptake and Cell Viability,” Proceedings of the International Ultrasonics Symposium, vol. 8–11, no. October 2002, 2002. [Google Scholar]
- [63].Xie F, Boska MD, Lof J, Uberti MG, Tsutsui JM, and Porter TR, “Effects of transcranial ultrasound and intravenous microbubbles on blood brain barrier permeability in a large animal model,” Ultrasound Med Biol, vol. 34, no. 12, pp. 2028–34, Dec 2008. [DOI] [PubMed] [Google Scholar]
- [64].Bayer CL, Wlodarczyk BJ, Finnell RH, and Emelianov SY, “Ultrasound-guided spectral photoacoustic imaging of hemoglobin oxygenation during development,” Biomed Opt Express, vol. 8, no. 2, pp. 757–763, Feb 1 2017. [DOI] [PMC free article] [PubMed] [Google Scholar]
- [65].Basak K, Luis Dean-Ben X, Gottschalk S, Reiss M, and Razansky D, “Non-invasive determination of murine placental and foetal functional parameters with multispectral optoacoustic tomography,” Light Sci Appl, vol. 8, p. 71, 2019. [DOI] [PMC free article] [PubMed] [Google Scholar]
- [66].Huda K, Wu C, Sider JG, and Bayer CL, “Spherical-view photoacoustic tomography for monitoring in vivo placental function,” Photoacoustics, vol. 20, p. 100209, Dec 2020. [DOI] [PMC free article] [PubMed] [Google Scholar]
- [67].Woods L, Perez-Garcia V, and Hemberger M, “Regulation of Placental Development and Its Impact on Fetal Growth-New Insights From Mouse Models,” (in English), Frontiers in Endocrinology, vol. 9, Sep 27 2018. [DOI] [PMC free article] [PubMed] [Google Scholar]
- [68].Turner RJ and Carroll BA, “Ultrasound appearance of decidual reaction in the uterus during normal pregnancy,” AJR Am J Roentgenol, vol. 133, no. 3, pp. 493–6, Sep 1979. [DOI] [PubMed] [Google Scholar]
- [69].Cross JC, Nakano H, Natale DR, Simmons DG, and Watson ED, “Branching morphogenesis during development of placental villi,” Differentiation, vol. 74, no. 7, pp. 393–401, Sep 2006. [DOI] [PubMed] [Google Scholar]
- [70].Chomas JE, Dayton P, May D, and Ferrara K, “Threshold of fragmentation for ultrasonic contrast agents,” J Biomed Opt, vol. 6, no. 2, pp. 141–50, Apr 2001. [DOI] [PubMed] [Google Scholar]
- [71].Newsome IG, Kierski TM, and Dayton PA, “Assessment of the Superharmonic Response of Microbubble Contrast Agents for Acoustic Angiography as a Function of Microbubble Parameters,” Ultrasound Med Biol, vol. 45, no. 9, pp. 2515–2524, Sep 2019. [DOI] [PMC free article] [PubMed] [Google Scholar]
Associated Data
This section collects any data citations, data availability statements, or supplementary materials included in this article.