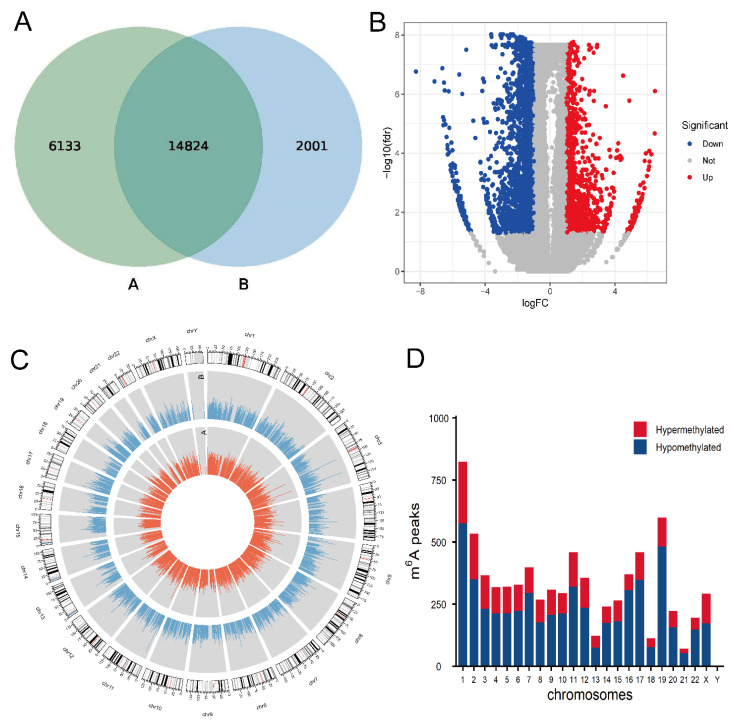
Figure 1.
Overview of mRNA m6A methylation map in proliferation and migration models of HCASMCs: (A) The number of methylation sites of the control and experimental groups. (B) The volcano plots of the differentially m6A peaks. (C) Visualization of m6A at the chromosome level in the control and experimental groups. (D) Distribution of differentially methylated m6A sites with significance in chromosomes.

