Abstract
The results of a field trial conducted in Latin America with two indirect enzyme-linked immunosorbent assays (ELISAs) and two competitive ELISAs (CELISAs) for the detection of bovine antibody to Brucella abortus are reported. One of the CELISA formats performed most accurately. The percentage of positive reactions in the CELISA relative to the selected positive rose bengal agglutination test (RBT) and complement fixation test (CFT) results was 97.47%, the percentage of negatives relative to the selected negative RBT and CFT results for unexposed cattle was 98.32%, and the percentage of negatives in cattle vaccinated with B. abortus 19 was 96.51%. The same assay format under Canadian conditions had an actual sensitivity of 100%, a specificity of 99.90% in nonvaccinates, and a specificity of 97.7% in a strain 19-vaccinated population. Overall, the CELISA performed as expected and the results were not dissimilar from the results obtained in the Canadian study. This provided further evidence that this CELISA can in many instances differentiate infected cattle from those that are vaccinated or infected with a cross-reacting organism while still giving very few false-positive or false-negative results.
The indirect enzyme-linked immunosorbent assay (IELISA) for detection of antibody to Brucella abortus was introduced in 1976 (1). The reasons for using IELISAs were, firstly, to replace conventional serological tests (3) that in many ways did not perform well and frequently required a panel of tests for diagnosis and, secondly, to introduce an assay which could be standardized, quality controlled, and automated. A large number of IELISAs have been described in the literature (13), but in spite of the numerous modifications, the specificities of these assays were less than expected. The reason for this is partly because antibody resulting from B. abortus 19 vaccination or from exposure to cross-reacting antigens is detected by this procedure.
To increase specificity, competitive ELISAs (CELISAs) were developed (4–6, 8). By selection of a suitable monoclonal antibody to compete with antibody present in test serum, reactivity resulting from the vaccine or cross-reacting antigens could be virtually eliminated. Two of these assays were developed and validated largely in circumstances where brucellosis had been eradicated (Canada) with sera from animals in which B. abortus infection was confirmed by culture as reference sera. It was therefore necessary to field test these assays in areas with brucellosis and vaccination programs. For these purposes, four laboratories in Latin America were selected. These laboratories were selected based on the incidence of brucellosis in each area. Chile had a relatively low incidence, while higher incidences were found in Costa Rica, Colombia, and Argentina.
This communication describes the results obtained with two IELISAs and two CELISAs compared to those from the diagnostic serological tests in use in each laboratory.
MATERIALS AND METHODS
Test samples.
Samples were defined on the basis of their serological reactions on both the rose bengal agglutination test (RBT) and the complement fixation test (CFT) by the official criteria for positive results as determined by each country for the CFT.
Serologically negative samples were defined as those primarily from regions that had no history or serological evidence of B. abortus infection and were negative on both the RBT and the CFT. Some animals in the negative population were vaccinated with B. abortus 19.
Serologically positive samples were defined as those samples from infected herds which were positive on both the RBT and the CFT. This positive population was thought to include cattle with residual vaccinal antibody or antibody resulting from exposure to cross-reacting antigens.
Control sera.
Control sera were supplied by the Animal Diseases Research Institute (ADRI) for one IELISA and both CELISAs from ADRI. These consisted of a strong positive control serum from a cow from which B. abortus had been isolated, a weakly positive control for the IELISA that was from a cow inoculated with B. abortus 19 and negative on the CELISA, and a negative control from a pool of cattle with no history of B. abortus infection. Separate controls were supplied by the International Atomic Energy Agency (IAEA) for the IAEA IELISA kit.
Test procedures.
The RBT antigen was prepared by Rhone-Merieux, and the assay was performed as described in the National Animal Diseases Laboratory diagnostic reagents manual (11).
The CFT reagents were prepared, and the assay was performed, as described in Public Health monograph N74 (12).
The IELISA supplied by the Joint Food and Agriculture Organization (FAO)-IAEA Division was performed as described in the FAO-IAEA kit. The basic reagents and protocol have been adapted for this kit (7). The IELISA (6, 8) supplied by the Agriculture Canada ADRI was performed as described elsewhere. The CELISA with smooth lipopolysaccharide (sLPS) as the antigen (6) was performed as described elsewhere. The CELISA with O polysaccharide of sLPS (CELISA-OC) as the antigen was performed as described in 1994 (2). The procedures for each assay are summarized in Table 1.
TABLE 1.
Comparison of procedures used for the two IELISAs and two CELISAsa
| Parameter | Assay
|
|||
|---|---|---|---|---|
| IAEA-IELISA | ADRI-IELISA | CELISA-OC | CELISA-sLPS | |
| Microplate | Nunc Polysorb | Nunc 69620 | Nunc 69620 | Nunc 69620 |
| Antigen | sLPS | sLPS | O chain | sLPS |
| Concn (μg/ml) | 1.0 | 1.0 | 2.0 | 1.0 |
| Buffer | 0.05 M CO3 | 0.05 M CO3 | 0.05 M CO3 | 0.05 M CO3 |
| Incubation temp (°C) | 4 | 20 | 4 (frozen) | 20 |
| Incubation time (h) | ≥18 | ≥18 | ≥18 | ≥18 |
| Wash buffer | 0.002 M PO4, 0.15 M NaCl, 0.05% Tween 20, pH 7.4 | 0.01 M PO4, 0.15 M NaCl, 0.05% Tween 20, pH 7.2 | 0.01 M PO4, 0.15 M NaCl, 0.05% Tween 20, pH 7.2 | 0.01 M PO4, 0.15 M NaCl, 0.05% Tween 20, pH 7.2 |
| No. of wash cycles | 3 | 4 | 4 | 4 |
| Serum diluent | 0.01 M PBS, 0.05% Tween 20, pH 7.4 | Wash buffer plus EDTA-EGTA, pH 6.3 | Same as wash buffer | Wash buffer plus EDTA-EGTA, pH 6.3 |
| Serum (control/test) | ||||
| Serum dilution | 1:200 | 1:50 | 1:50 | 1:20 |
| Incubation temp (°C) | 37 | 20 | 20 | 20 |
| Incubation time (min) | 60 | 30 | 120 | 30 |
| Agitation | Yes | No | 3 min | 3 min |
| Competing antibody | NA | NA | YsT9-HRP | M84 |
| Detecting antibody | MAb to bovine IgG1-HRP | MAb to bovine IgG1-HRP | Same as competing | GaMIgG-HRP (diluted in wash buffer) |
| Incubation time (min) | 60 | 30 | NA | 30 |
| Incubation temp (°C) | 37 | 20 | NA | 20 |
| Agitation | Yes | No | NA | No |
| Substrate/chromogen | ||||
| Incubation time (min) | 10 | 10 | 10 | 10 |
| Incubation temp (°C) | 37 | 20 | 20 | 20 |
| Agitation | Yes | Yes | Yes | Yes |
| Wavelength (nm) | 405 | 414 | 414 | 414 |
Abbreviations: PBS, phosphate-buffered saline; NA, not applicable; HRP, horseradish peroxidase; MAb, monoclonal antibody; IgG1, immunoglobulin G1; GaM, goat anti-mouse IgG-HRP.
Data handling and statistical analysis.
The data for each country was compiled in a database and divided into negative or positive results according to serological reactions on both the RBT and the CFT.
After the results were classified into serologically negative and positive populations, initial optimal estimates of the criteria between positive and negative reactions (the cutoff values) were determined by receiver operating characteristics (ROC) analysis (10).
With the initial estimates of cutoff values, the percentage of samples that were positive relative to the positive RBT and CFT reactions and the percentage of samples that were negative relative to the negative RBT and CFT reactions were calculated and the frequency distributions were plotted to provide a visual confirmation that the cutoff value was applicable.
Finally, assays were compared to each other for agreement, and a kappa statistic was calculated (10).
RESULTS
The numbers of samples used in this study are presented in Table 2. The samples were divided into three populations. The negative population was defined as those primarily from regions that had no history of B. abortus infection and having negative reactions on both the RBT and the CFT. The positive population was defined as those samples from infected herds which had positive reactions on both the RBT and the CFT. The vaccinated population was defined as those animals that had been vaccinated with B. abortus 19 according to the regulations in each country. The exception to this was Argentina, where vaccination is routinely practiced, and it was difficult to collect samples that were defined as being from unexposed cattle. Consequently, the data for the negative category and that for the vaccinated category for Argentina were combined into the negative category.
TABLE 2.
Number of samples tested in each country in each group (not exposed, serologically positive, or vaccinated with B. abortus)
| Statusa | No. of observations per country and combined
|
||||
|---|---|---|---|---|---|
| Argentina | Chile | Colombia | Costa Rica | Combined | |
| Negative | 215 | 972 | 554 | 872 | 2,613 |
| Positive | 709 | 692 | 266 | 190 | 1,857 |
| Vaccinate | NAb | 954 | 1,110 | 1,002 | 3,066 |
All samples were defined relative to their RBT and CFT results.
NA, data not available. There was an insufficient number of vaccinates to be a separate category, and so the data was combined with negatives.
The data presented in Table 3 is defined in two ways. The data for the positive population from Argentina, Chile, Colombia, and Costa Rica and the combined data are percent positives (%P), or the number of positives found for each ELISA relative to the positive RBT and CFT reactions from cattle in infected herds. The Canadian data is actual sensitivity, since the results were derived from animals from which B. abortus had been isolated. The highest %P, of 100%, for both IELISAs from Colombia and for the IELISA-ADRI from Costa Rica indicate that it is comparable to the actual sensitivity achieved by the IELISA-ADRI in the Canadian study. Data for the IELISA-IAEA and the CELISA-OC for Canada was not part of the original Canadian study and consequently is not available.
TABLE 3.
Comparison of percent positive reactions in each country with actual sensitivity determined in the Canadian study
| Country | % for assay
|
|||
|---|---|---|---|---|
| IELISA-ADRI | IELISA-IAEA | CELISA-OC | CELISA-sLPS | |
| Argentina | 92.66 | 97.88 | 96.90 | 97.74 |
| Canada | 100 | NAb | NA | 100 |
| Chile | 98.99 | 97.11 | 98.84 | 100 |
| Colombia | 100 | 100 | 99.25 | 98.12 |
| Costa Rica | 100 | 98.42 | 92.10 | 93.16 |
| Combineda | 96.77 | 96.28 | 97.04 | 97.47 |
Combined data for all the countries except Canada (included for comparison).
NA, these tests were not part of the original Canadian study.
The data presented in Table 4 for the negative population from Argentina, Chile, Colombia, and Costa Rica and the combined data are similarily defined as percent negatives (%N), or the number of negatives found for each ELISA relative to the negative RBT and CFT reactions primarily from regions with no history of B. abortus infection. The Canadian data is actual specificity, since the results were derived from cattle in Canada. Canada has been free of B. abortus infection in cattle since 1982.
TABLE 4.
Comparison of percent negative reactions in each country with specificity determined in the Canadian study
| Country | % for assay
|
|||
|---|---|---|---|---|
| IELISA-ADRI | IELISA-IAEA | CELISA-OC | CELISA-sLPS | |
| Argentina | 96.28 | 98.14 | 98.14 | 98.14 |
| Canada | 99.40 | NAb | NA | 99.90 |
| Chile | 99.28 | 99.59 | 99.69 | 99.59 |
| Colombia | 99.82 | 99.82 | 99.82 | 97.11 |
| Costa Rica | 95.76 | 94.95 | 93.35 | 95.76 |
| Combineda | 93.57 | 97.01 | 98.05 | 98.32 |
Combined data for all the countries except Canada.
NA, these tests were not part of the original Canadian study.
The highest %N, of 99.82%, for both IELISAs from Colombia is comparable to the actual specificity of 99.40% achieved by the IELISA-ADRI in the Canadian study. Data for the IELISA-IAEA and the CELISA-OC for Canada was not part of the original Canadian study and consequently is not available.
The %N of the IELISAs and CELISAs relative to the RBT and CFT for the vaccinated population are presented in Table 5. The %N for each country and that for the combined data of Chile, Colombia, and Costa Rica are compared to each other and to the Canadian data. The largest difference in percentage was between the IELISA-ADRI and the CELISA-sLPS in the Canadian study. This was 41.4%. The difference between the IELISA-ADRI and the CELISA-sLPS for the data from Chile was 21.2%. In all cases, the %N for the vaccinated population was greater for the CELISA-sLPS than for the IELISA-ADRI or the IELISA-IAEA, although for the IELISA-IAEA the differences were smaller. Similarly, the %N of the CELISA-OC was greater than that of the IELISA-ADRI in all cases. However, the %N of the IELISA-IAEA was greater than that of the CELISA-OC for Chile and for the data from Costa Rica with calf vaccination. The maximum difference was 2.4%.
TABLE 5.
Comparison of reactivity in the ELISAs by animals vaccinated with B. abortus 19 in each country
| Country | % for assay
|
|||
|---|---|---|---|---|
| IELISA-ADRI | IELISA-IAEA | CELISA-OC | CELISA-sLPS | |
| Argentina | NAd | NA | NA | NA |
| Canada | 56.30 | NA | NA | 97.7 |
| Chile | 78.82 | 96.85 | 94.44 | 100 |
| Colombia | 86.76 | 87.57 | 95.50 | 92.25 |
| Costa Ricab | 91.80 | 94.58 | 93.12 | 96.03 |
| Costa Ricac | 95.53 | 97.56 | 97.56 | 97.97 |
| Combineda | 90.53 | 94.55 | 96.08 | 96.51 |
Combined data for all the countries except Canada and Argentina.
Calf vaccination.
Adult vaccination.
NA, a separate vaccinated population for Argentina was not available.
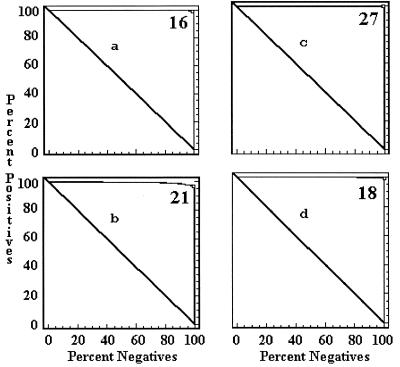
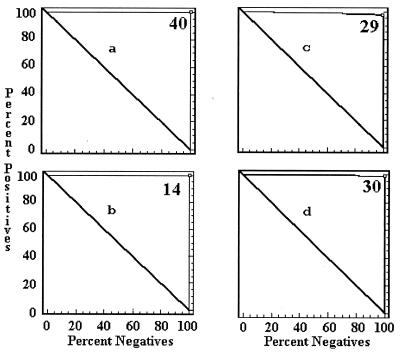
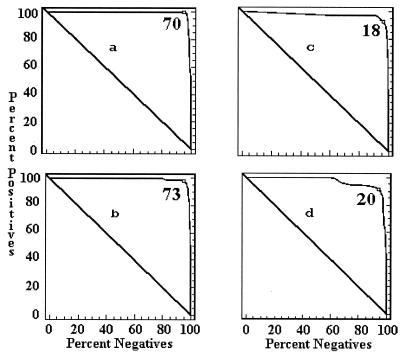
Cutoff values for each ELISA by country are presented in Table 6. The IELISA data is expressed as %P. The CELISA data is expressed as percent inhibition (%I). For example, the cutoff value for the IELISA-ADRI for Argentina is 67%P. Samples greater than or equal to 67%P are positive and samples less than 67%P are negative on this IELISA. The lowest cutoff value for the IELISA-ADRI was 16%P. The highest cutoff value for the IELISA-ADRI was 70%P, a difference of 54%. Similarly, the lowest cutoff value for the IELISA-IAEA was 14%P, and the highest cutoff value was 73%P, a difference of 59%. The difference for the CELISA-OC and the CELISA-sLPS was 17 and 26%, respectively, which indicated that the CELISAs were more specific for the negative population.
TABLE 6.
Comparison of cutoff values determined for each ELISA in each country
| Country | % for assay
|
|||
|---|---|---|---|---|
| IELISA-ADRIa | IELISA-IAEAa | CELISA-OCb | CELISA-sLPSb | |
| Argentina | 67 | 40 | 35 | 44 |
| Canada | 46 | NAc | NA | 30 |
| Chile | 16 | 21 | 18 | 27 |
| Colombia | 40 | 14 | 30 | 29 |
| Costa Rica | 70 | 73 | 20 | 18 |
| Combined | 41 | 41 | 26 | 29 |
Cutoff value is expressed as percent positivity.
Cutoff value is expressed as percent inhibition.
NA, data not available.
Agreements between assays are compared in Table 7. The kappa statistic for each ELISA by country is presented. For example, the kappa indices of Argentina, Chile, Colombia, and Costa Rica for the IELISA-ADRI and the IELISA-IAEA are 0.824, 0.963, 0.994, and 0.850, respectively, indicating good agreement between the IELISA-ADRI and the IELISA-IAEA despite the differences in the cutoff values. Except for Costa Rica, the kappa statistic for all assays indicated good agreement between assays. It is generally accepted that a kappa statistic greater than or equal to 0.8 indicates good agreement between assays. The kappa results for Costa Rica were not much lower than 0.8 and were all greater than 0.5, indicating agreement beyond chance.
TABLE 7.
Comparison of agreement among the ELISAs in each country by kappa statisticsa
| Assay and country | Value for assay
|
||
|---|---|---|---|
| IELISA-ADRI | IELISA-IAEA | CELISA-OC | |
| IELISA-IAEA | |||
| Costa Rica | 0.850 | ||
| Colombia | 0.994 | ||
| Chile | 0.963 | ||
| Argentina | 0.824 | ||
| CELISA-OC | |||
| Costa Rica | 0.756 | 0.796 | |
| Colombia | 0.989 | 0.989 | |
| Chile | 0.972 | 0.964 | |
| Argentina | 0.812 | 0.910 | |
| CELISA-sLPS | |||
| Costa Rica | 0.825 | 0.793 | 0.720 |
| Colombia | 0.939 | 0.939 | 0.939 |
| Chile | 0.978 | 0.965 | 0.981 |
| Argentina | 0.855 | 0.927 | 0.931 |
A kappa value of 1 is considered to indicate complete agreement.
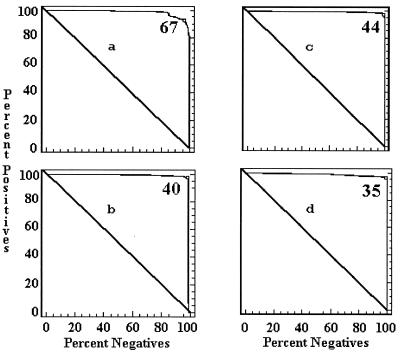
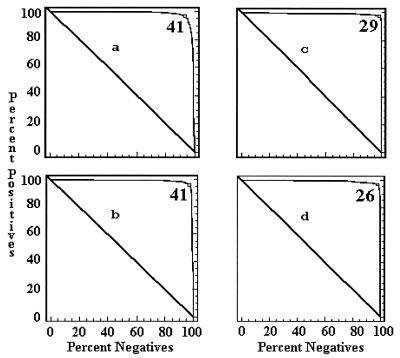
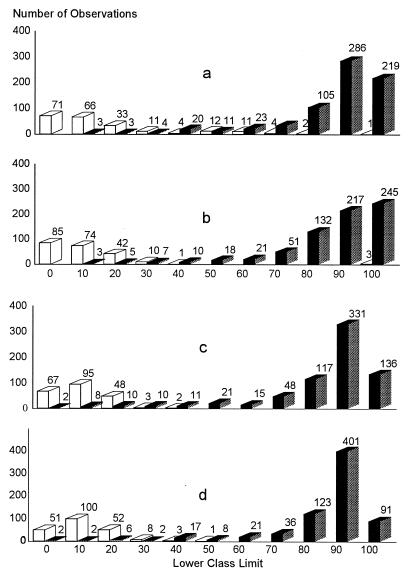
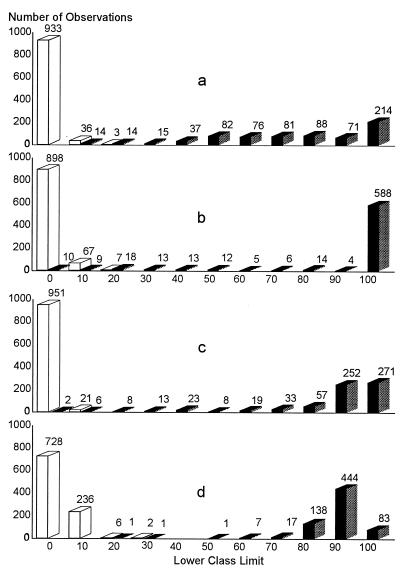
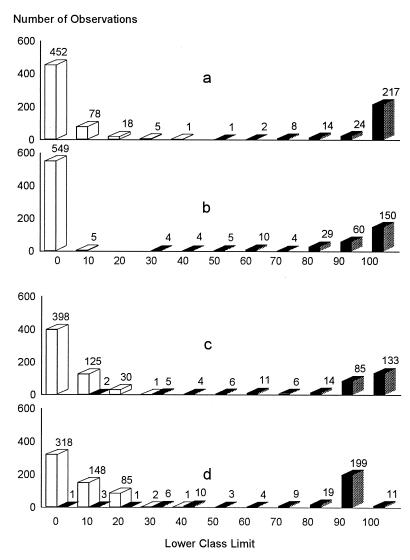
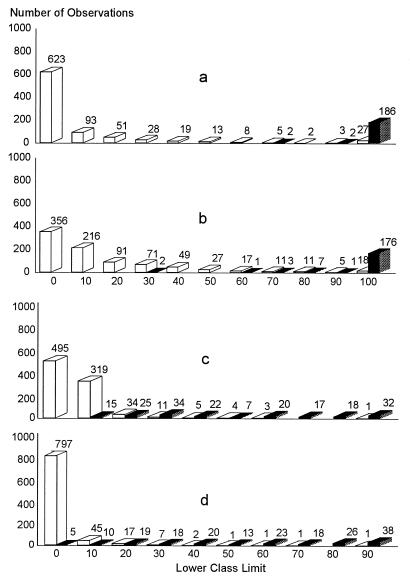
The cutoff values of each ELISA by country were determined by a combination ROC analysis and by frequency distributions. The ROC analyses are presented in Fig. 1 to 5, along with the respective areas under the curve (AUC). For example, in Fig. 1a, the optimal cutoff value for the IELISA-ADRI is 67%P. In Fig. 1b, the optimal cutoff value for the IELISA-IAEA is 40%P. In Fig. 1c, the optimal cutoff value for the CELISA-sLPS is 44%I, while an optimal cutoff value for the CELISA-OC in Fig. 1d is 35%I. The frequency distributions are presented in Fig. 6 to 10. The frequency distribution for the IELISA-ADRI in Fig. 6a shows considerable overlap between the selected negative and positive populations. With the cutoff as determined by ROC analysis, it is much easier to identify the false negatives. The same is true of the IELISA-IAEA, CELISA-OC, and CELISA-sLPS presented in Fig. 6b, c, and d. The other frequency distributions for the other countries can be interpreted in a similar fashion.
FIG. 1.
ROC curves representing each ELISA for data from Argentina. The cutoff value for each assay is indicated in the upper right corner of each panel. The AUC is indicative of how well the test performed. A value of 1.0 is perfect, and a value below the diagonal line represents reactivity due to chance. (a) IELISA-ADRI, AUC = 0.983. (b) IELISA-IAEA, AUC = 0.983. (c) CELISA-sLPS, AUC = 0.995. (d) CELISA-OC, AUC = 0.991.
FIG. 5.
ROC curves representing each combined ELISA for data from Argentina, Chile, Colombia, and Costa Rica. (a) IELISA-ADRI, AUC = 0.985. (b) IELISA-IAEA, AUC = 0.989. (c) CELISA-sLPS, AUC = 0.995. (d) CELISA-OC, AUC = 0.995. See the Fig. 1 legend for additional explanation of the data.
FIG. 6.
Frequency distribution of ELISA data from Argentina. Open bars, serologically negative samples; closed bars, serologically positive samples. The numbers in each class limit are indicated on top of the bars. (a) IELISA-ADRI. (b) IELISA-IAEA. (c) CELISA-OC. (d) CELISA-sLPS.
FIG. 10.
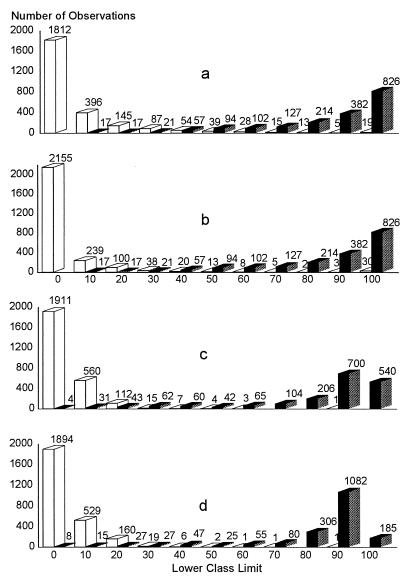
Frequency distribution of combined ELISA data from Argentina, Chile, Colombia, and Costa Rica. (a) IELISA-ADRI. (b) IELISA-IAEA. (c) CELISA-OC. (d) CELISA-sLPS. See the Fig. 6 legend for additional explanation of the data.
DISCUSSION
ELISAs have a distinct advantage over conventional serological tests in that they are primary binding assays that do not rely on secondary properties of antibodies such as their ability to agglutinate or to fix complement. Secondly, ELISAs can be tailored to be more specific by using highly purified reagents such as antigens and monoclonal antibodies.
In Canada, which is free of brucellosis in domestic animals, both the IELISA and the CELISA were recently validated (9). Approximately 8,000 samples from cattle with no evidence of B. abortus infection were collected and tested in both the IELISA and the CELISA. Similarly, 692 samples from cattle from which B. abortus was isolated from milk or tissues were also tested. Another 261 samples from cattle that were vaccinated with B. abortus 19 and that contained residual antibodies were tested as well.
Unlike in Canada, conditions in Latin America for validation of assays are different. It is more difficult to define negative and positive sera because diagnosis is based on serological evidence or the isolation of B. abortus from herds rather than from individual cattle. In most countries, areas overlap between regions free of B. abortus and regions that contain infected herds, and strain 19 vaccination is widely practiced. For these reasons and for consistency, the negative population and positive population were defined based on the RBT and the CFT reactions in each country under study. As well, determining the B. abortus 19 vaccination status of cattle is sometimes difficult due to insufficient data being available, including the time of vaccination, the number of times that cattle were vaccinated, and identification of cattle that were vaccinated. The numbers of samples defined as positive, negative, and vaccinated are tabulated in Table 2.
Comparison of %P is summarized in Table 3. The results are not dissimilar from the results obtained in the Canadian study (9). Both the IELISA and the CELISA achieved a sensitivity estimate of 100% in Canada. The results obtained in Latin America were comparable. Percent positive values obtained ranged from 92.10% for the CELISA-OC in Costa Rica to 100% for the CELISA-sLPS in Chile, the IELISA-ADRI in Colombia, the IELISA-IAEA in Colombia, and the IELISA-ADRI in Costa Rica. When the data was combined for all countries (except Canada), the performance of both CELISAs was marginally better than that of the IELISAs (presented in Table 3). The maximum difference between the CELISAs and the IELISAs for the combined data is 1.19%. The CELISA-sLPS at 97.47% detects 11.9 more positive reactions per 1,000 animals than does the IELISA-IAEA at 96.28%.
Comparison of %N is presented in Table 4. The specificity for the IELISA in Canada was 99.40%, while the specificity for the CELISA was 99.90% (9). The results obtained in Latin America were similar. The lowest %N achieved was 93.35% for the CELISA-OC in Costa Rica. The highest %N achieved was 99.82% for the IELISA-ADRI, IELISA-IAEA, and CELISA-OC in Colombia. When the data was combined for all the countries (except Canada), it is obvious that the overall performance of both CELISAs is better than that of the IELISAs presented in Table 4. The maximum difference between the CELISAs and the IELISAs for the combined data is 4.75%. The CELISA-sLPS at 98.32% is more specific than the IELISA-ADRI at 93.57%. Thus, the IELISA-ADRI detected 47.5 more animals per 1,000 animals than did the CELISA-sLPS.
Comparison of the %N for vaccinated cattle is tabulated in Table 5. The results of the Canadian study indicated that the CELISA-sLPS was capable of distinguishing animals that were vaccinated or negative from those that were infected, in the majority of the cases. In the Canadian study, the specificity of the IELISA-ADRI was 56.30% while the specificity for the CELISA-sLPS was 97.70%. Similar results were achieved in Latin America. In Chile, the %N for the IELISA-ADRI was 78.82% while the %N for both CELISAs was 94.44 and 100%. In Colombia, the %N for both IELISAs was 86.76 and 87.57%, respectively. The %N for both CELISAs was 95.50 and 92.25%. The combined data clearly indicates that the %N of the CELISAs as presented in Table 5 is better than that of the IELISAs for distinguishing vaccinal antibody. The maximum difference between the CELISAs and the IELISAs for the combined data is 5.98%. The CELISA-sLPS for the combined data at 96.51% is more specific than the IELISA-ADRI at 90.53%. The CELISA-sLPS misinterprets as positives 59.8 fewer vaccinated animals per 1,000 animals than does the IELISA-ADRI.
Ideally, harmonization of cutoff values should be the same in each country for the IELISAs or for the CELISAs. However, analysis of data indicated that this was not possible. The cutoff values for each country and for the combined data were determined by ROC analysis as presented in Fig. 1 to 5 and tabulated in Table 6. From Table 6, the only assay that had cutoff values approximating the 30% chosen for Canada was the CELISA-sLPS, except for Costa Rica. The frequency distributions presented in Fig. 6 to 10 show the difficulty in choosing an optimal cutoff value for each assay. For instance, most of the frequency distributions for the IELISA have some overlap between the negative and the positive populations. The exceptions to this were the frequency distributions from Colombia. The reason for the binomial distribution is better separation of the negative and positive sera. The sera were from defined areas free from B. abortus infection and from areas with a relatively high prevalence of infection. Despite the differences in how the IELISA-ADRI and the IELISA-IAEA were performed, the distribution patterns were very similar. This became quite evident when the frequency distributions of the combined data for the IELISAs presented in Fig. 10 were examined. The distribution patterns of the CELISAs, although different from those of the IELISAs, were similar to each other, and again the similarity was quite evident from the frequency distribution of the combined data presented in Fig. 10. Choosing a cutoff value solely on the basis of frequency distribution could give erroneous results. The frequency distributions of the CELISAs were marginally better than those of the IELISAs due to less overlap between the selected negative and positive populations. However, obtaining the optimal percentage of positives and percentage of negatives for each assay in each country was best determined by ROC analysis and frequency distributions together to get a clearer picture in each instance.
The ROC curves presented in Fig. 1 to 5 all had AUC greater than 0.95. An AUC of 0.95 indicates that a randomly selected individual animal from a positive population will have a test value greater than that of a randomly selected individual animal from the negative population 95% of the time. The lowest AUC was 0.969 for the CELISA-OC in Costa Rica, while the highest AUC was 1.000 for the IELISA-ADRI, the CELISA-sLPS, the CELISA-OC in Chile, and the IELISA-ADRI and the IELISA-IAEA in Colombia. Both CELISAs for the combined data had an AUC of 0.995, which was approximately 1% better than that of the IELISAs.
Finally, a comparison of agreement between assays was calculated and presented in Table 7. A kappa statistic of 1 indicates perfect agreement between assays. A kappa of 0.5 indicates agreement beyond chance. It is generally accepted that kappa indices greater than or equal to 0.8 indicate good agreement between tests. The best agreement was 0.994 between the IELISAs in Colombia. Again, this is probably due to better separation of the negative and positive populations. The lowest kappa statistic was 0.720 between the CELISAs from Costa Rica, where separation of negative and positive populations was more difficult. The highest kappa for both CELISAs was 0.981 from Chile. Overall, the kappa statistics for all the assays were good, indicating good agreement among all assays.
Generally, the technical performance of the assays was good and the results were similar to results obtained in the Canadian study. However, there are some reasons why the results could be improved. Firstly, a bias was introduced in the study. The selected negative and positive populations were defined according to the RBT and CFT reactions. The RBT can produce false-positive results, which when used to define sera can affect the sensitivity of the assay being validated. Secondly, a better separation of the negative and positive populations would have produced better results. For example, if individual animals with proven infection based on isolation of the organism had been selected, instead of positive animals from infected herds, the sensitivity values should have been higher. Thirdly, the RBT and the CFT both detect antibody resulting from B. abortus 19 vaccination or from exposure to cross-reacting antigens. Therefore, the results are biased against the CELISAs, which eliminate many such reactions.
Based on the combined data, the CELISA-sLPS was the best-performing ELISA. It detected 1.19% more positives in the selected positive population, 4.75% fewer positives in the selected negative population, and 5.98% fewer positives in the selected vaccinated population. The implication of this is important. For example, in a population of 15,000,000 animals with a high incidence of brucellosis the CELISA-sLPS would detect 712,500 fewer false positives and, if vaccination were part of the control program, 897,000 fewer false positives. By using the CELISA-sLPS as the primary screening assay in an eradication and control program, significant savings in repeat testing and elimination of other conventional assays can be realized. In addition, the CELISA-sLPS is less costly in reagents than is conventional assays and has excellent quality control, leading to additional savings.
FIG. 2.
ROC curves representing each ELISA for data from Chile. (a) IELISA-ADRI, AUC = 1.000. (b) IELISA-IAEA, AUC = 0.996. (c) CELISA-sLPS, AUC = 1.000. (d) CELISA-OC, AUC = 1.000. See the Fig. 1 legend for additional explanation of the data.
FIG. 3.
ROC curves representing each ELISA for data from Colombia. (a) IELISA-ADRI, AUC = 1.000. (b) IELISA-IAEA, AUC = 1.000. (c) CELISA-sLPS, AUC = 0.994. (d) CELISA-OC, AUC = 0.999. See the Fig. 1 legend for additional explanation of the data.
FIG. 4.
ROC curves representing each ELISA for data from Costa Rica. (a) IELISA-ADRI, AUC = 0.992. (b) IELISA-IAEA, AUC = 0.991. (c) CELISA-sLPS, AUC = 0.974. (d) CELISA-OC, AUC = 0.969. See the Fig. 1 legend for additional explanation of the data.
FIG. 7.
Frequency distribution of ELISA data from Chile. (a) IELISA-ADRI. (b) IELISA-IAEA. (c) CELISA-OC. (d) CELISA-sLPS. See the Fig. 6 legend for additional explanation of the data.
FIG. 8.
Frequency distribution of ELISA data from Colombia. (a) IELISA-ADRI. (b) IELISA-IAEA. (c) CELISA-OC. (d) CELISA-sLPS. See the Fig. 6 legend for additional explanation of the data.
FIG. 9.
Frequency distribution of ELISA data from Costa Rica. (a) IELISA-ADRI. (b) IELISA-IAEA. (c) CELISA-OC. (d) CELISA-sLPS. See the Fig. 6 legend for additional explanation of the data.
ACKNOWLEDGMENTS
This project was funded by the Joint FAO-IAEA Commission on Animal Health and the Canadian Food Inspection Agency.
REFERENCES
- 1.Carlsson H E, Hurvell B, Lindberg A A. Enzyme linked immunosorbent assay (ELISA) for titration of antibodies against Brucella abortus and Yersinia enterocolitica. Acta Pathol Microbiol Scand. 1976;84:168–176. doi: 10.1111/j.1699-0463.1976.tb00016.x. [DOI] [PubMed] [Google Scholar]
- 2.Gall D, Nielsen K. Improvements to the competitive ELISA for the detection of antibody to Brucella abortus in cattle. J Immunoass. 1994;15:277. doi: 10.1080/15321819408009578. [DOI] [PubMed] [Google Scholar]
- 3.MacMillian A. Conventional serological tests. In: Nielsen K, Duncan J R, editors. Animal brucellosis. Boca Raton, Fla: CRC Press, Inc.; 1990. p. 153. [Google Scholar]
- 4.MacMillian A, Greiser-Wilke I, Moennig V, Mathias L. A competitive enzyme immunoassay for brucellosis diagnosis. Dtsch Tieraerztl Wochenschr. 1990;97:83. [PubMed] [Google Scholar]
- 5.Nielsen K, Cherwonogrodzky J, Duncan J R, Bundle D R. Enzyme immunoassay for the differentiation of the antibody response of Brucella abortus infected or strain 19 vaccinated cattle. Am J Vet Res. 1989;50:5. [PubMed] [Google Scholar]
- 6.Nielsen K, Gall D, Kelly W, Vigliocco A, Henning D, Garcia M. Immunoassay development: application to enzyme immunoassay for diagnosis of brucellosis. Monograph. Nepean, Ontario, Canada: Agriculture and Agri-Food Canada, Animal Diseases Research Institute; 1996. [Google Scholar]
- 7.Nielsen K H, Wright P F, Kelly W A, Cherwonogrodzky J H. A review of enzyme immunoassay for the detection of antibody to Brucella abortus in cattle. Vet Immunol Immunopathol. 1988;18:331–347. doi: 10.1016/0165-2427(88)90160-2. [DOI] [PMC free article] [PubMed] [Google Scholar]
- 8.Nielsen K H, Gall D, Kelly W, Henning D, Garcia M M. Enzyme immunoassay: application to diagnosis of bovine brucellosis. Monograph. Nepean, Ontario, Canada: Agriculture Canada; 1992. [Google Scholar]
- 9.Nielsen K H, Kelly L, Gall D, Balsevicius S, Bossé J, Nicoletti P, Kelly W. Comparison of enzyme immunoassays for the diagnosis of bovine brucellosis. Prev Vet Med. 1996;26:17–32. [Google Scholar]
- 10.Schoojans F, Zalata A, Depuydt C E, Comhaire F H. MedCalc: a new computer program for medical statistics. Comput Methods Programs Biomed. 1995;48:257–262. doi: 10.1016/0169-2607(95)01703-8. [DOI] [PubMed] [Google Scholar]
- 11.U.S. Department of Agriculture. NADL diagnostic reagents manual. Ames, Iowa: Diagnostic Reagents Division, National Animal Diseases Laboratory, U.S. Department of Agriculture; 1965. pp. 65C–65E. [Google Scholar]
- 12.U.S. Department of Health, Education, and Welfare. Standardized diagnostic complement fixation and adaptation to the microtest. Public health monograph N74. U.S. Washington, D.C: Department of Health, Education, and Welfare; 1965. [Google Scholar]
- 13.Wright P F, Nielsen K, Kelly W. Primary binding assay techniques for the serodiagnosis of bovine brucellosis—enzyme immunoassay. In: Nielsen K, Duncan J R, editors. Animal brucellosis. Boca Raton, Fla: CRC Press, Inc.; 1990. p. 199. [Google Scholar]


