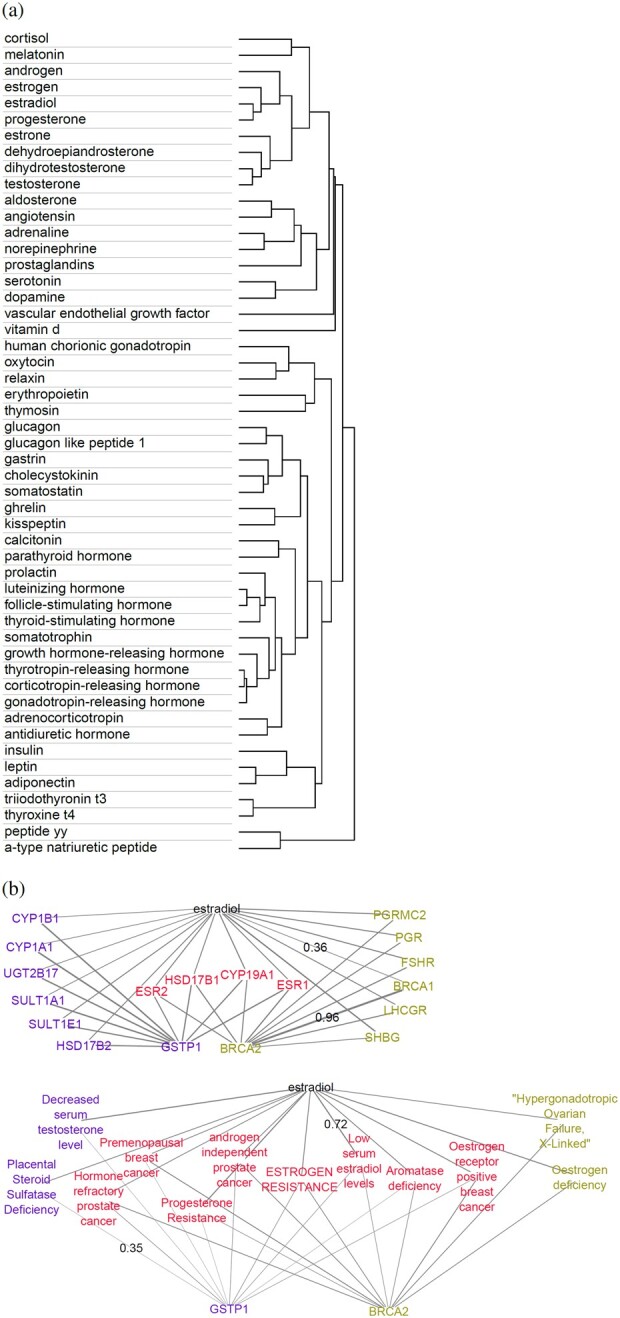
Fig. 2.

Similarity of hormone embeddings and hormone–gene context: (a; top) hierarchical clustering dendrogram of the 200D hormone embeddings using complete linkage method and one minus cosine similarity (cosine of the angle between two vectors) as the distance measure. (b; rest) For the predicted hormone–gene pair (estradiol—GSTP1, and estradiol—BRCA2), the gene symbols (middle) or disease terms (bottom) that exhibit cosine similarity of at least 0.35 with the predicted hormone or gene are shown. Cosine similarity is indicated proportionally by edge thickness, with maximum and minimum values shown alongside the corresponding edges
