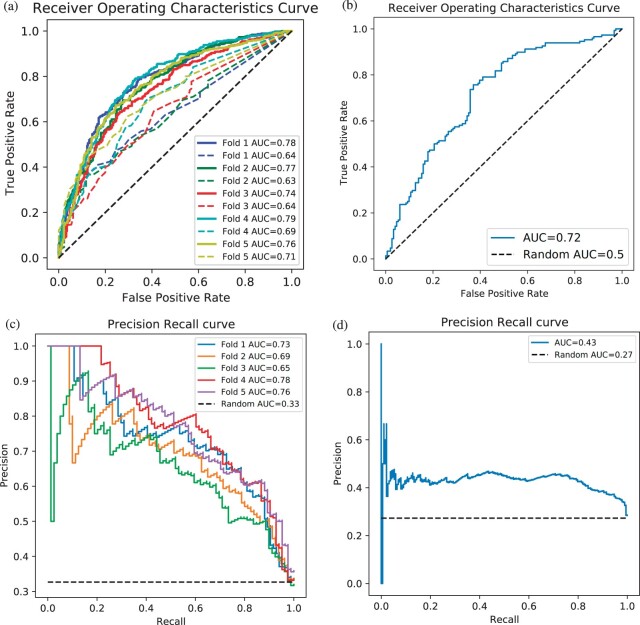
Fig. 3.
Performance of our BioEmbedS* models in different settings: (a) ROC curves of BioEmbedS (solid lines) and STRING (dashed lines) for hormone–gene predictions based on 5-fold CV. (b) ROC curve of BioEmbedS for unseen external hormones’ predictions. (c) PR curves of BioEmbedS-TS for source/target gene predictions based on 5-fold CV. (d) PR curve of BioEmbedS-TS for unseen external hormones’ predictions. AUC of a perfect classifier is one, and of a random classifier is 0.5 for ROC curves. Random classifiers are denoted by black dashed lines in these plots

