

Abstract
Background
The incidence of cognitive impairment is increasing with an aging population. Developing effective strategies is essential to prevent dementia. Higher education level is associated with better baseline cognitive performance, and reading activities can slow down cognitive decline. However, it is unclear whether education and reading activities are synergistic or independent contributors to cognitive performance.
Methods
This was a sub-study of an ongoing prospective community cohort of China National Clinical Research Center Alzheimer’s Disease and Neurodegenerative Disorder Research (CANDOR). Demographic and clinical information, educational levels, and reading activities were collected. All participants finished neuropsychological testing batteries and brain MRIs. We analyzed cognitive performance and brain structures with education and reading activities.
Results
Four hundred fifty-nine subjectively cognitively normal participants were enrolled in the study. One hundred sixty-nine (36.82%) of them had regular reading activities. Participants in the reading group had better performance in all cognitive tests compared with those in the non-reading group, but no difference in brain MRI variables. Participants with higher education levels (more than 13 years) had better cognitive performance and higher hippocampal volumes. In low education groups (less than 12 years), more reading activities were associated with better cognitive test scores.
Conclusions
Both education and reading activities are important and synergistic for baseline cognitive function. Higher education level is associated with larger hippocampal volumes. Education may stimulate the growth and development of the hippocampus. Reading activities help to maintain and improve cognitive function in people with low levels of education.
Trial registration
Supplementary Information
The online version contains supplementary material available at 10.1186/s13195-022-01098-1.
Keywords: Reading activities, Education, Cognition
Introduction
Aging is the most important risk factor for dementia. With an aging population, dementia has cast an enormous social and economic burden around the world [1, 2]. Developing effective strategies is essential to prevent dementia [3]. It has been reported there are modifiable risk factors for dementia and modifying 12 of them may prevent or delay up to 40% of dementia [4]. The Finnish Geriatric Intervention Study to Prevent Cognitive Impairment and Disability (FINGER), a multicenter randomized controlled trial, reported beneficial effects on cognition through multimodal intervention including cognitive training [5]. Reading activities and other mental stimulation help to slow down cognitive decline [6, 7].
High education level is associated with better cognitive performance and lower likelihood to have Alzheimer’s disease (AD) [8, 9]. High education level may delay cognitive decline in individuals with subjective cognitive decline [10, 11]. However, although education is associated with baseline cognitive performance, it doesn’t affect the rate of cognitive decline [12], nor does it affect the neuropathological changes related to dementia, such as amyloid plaques and tangles [13].
Previous research compared the influence of reading activities and education on cognition and found that reading activities were associated with a lower risk of dementia even in late life, independent of education and other related factors [6, 7], while another study demonstrated that reading activities have a stronger relationship than education with executive function tests [14].
It is inconclusive whether reading activities and education are synergistic or independent contributors to cognitive performance. In this prospective community-based cohort study, we try to answer the following questions. First, what are the relationships of education and reading activities with cognitive performance on domain-specific tests? Second, are education and/or reading activities associated with brain structure? Third, can reading activities compensate for lower levels of education?
Methods
Study design and participants
This study was a sub-study of an ongoing prospective community-based cohort study of the China National Clinical Research Center Alzheimer's Disease and Neurodegenerative Disorder Research (CANDOR). CANDOR was started in July 2019 and planned to enroll one thousand and five hundred participants, including individuals with normal cognition (NC), mild cognitive impairment (MCI), and dementia. Demographic information and past medical history were collected. All participants were required to have a study partner to provide an independent evaluation of daily and social functions. They underwent detailed assessments for cognition and functional abilities, a comprehensive neuropsychological battery (described below in “Neuropsychological assessment”) including the Mini-Mental State Examination (MMSE), Clinical Dementia Rating (CDR), and brain MRIs. All enrolled participants for this study (1) were subjectively cognitively normal; (2) aged 40–100 years old; (3) had at least 3 years of education; (4) had no condition known to affect cognitive function, such as Alzheimer’s Disease, vascular dementia, Lewy body dementia, frontotemportal dementia, Parkinson’s disease, epilepsy, stroke, hydrocephalus, multiple sclerosis, traumatic brain injuries, genetic disorders affecting cognition, alcoholism, uncontrolled depression, or other psychiatric disorders; (5) had no uncontrolled neoplasia, or severe pulmonary, cardiovascular, metabolic, infectious, inflammatory, or endocrine diseases. We excluded individuals with less than 3 years of education because people started to learn how to read and write in the third year of elementary school in China. Therefore, people who have less than three years of education will have difficulties in reading.
To assess the relationship between education and leisure reading activities, we defined regular reading activities as reading at least one book per month on average for at least one year. We divided the participants as follows. First, participants were divided into 2 groups based on their reading activities. Reading activities were detailed, including (1) reading materials, such as paper books, e-books, and audio-books; (2) reading content, such as literature books, and non-literature books; (3) the total number of books, which was calculated as the average number of books read per month ×12 months × years of reading. In participants with reading habits, we divided them further into several groups based on reading years, reading content and reading materials. Second, participants were divided based on their education. Previous studies analyzed education by ≤9, 10–12, and ≥13 years [15, 16]. In our study, the average education years of all participants were 12.12 years. Therefore, we used a 12-year cut-off to divide participants into two groups: low education (≤12 years, high school education or below, under the average education level) and high education (≥13 years, college education or above, over the average education level). Third, participants were divided into four groups based on education years and reading activities: low education (educational years ≤12) with and without reading activities (groups 1 and 2), and high education (educational years ≥13) with and without reading activities (groups 3 and 4).
Standard protocol approvals, registrations, and patient consents
This protocol was approved by the Institutional Review Board of Beijing Tiantan Hospital (approval number: KY 2019-004-007) and was in accordance with relevant guidelines and regulations. Written informed consent was obtained from each participant.
Neuropsychological assessment
Thirteen neuropsychological tests were completed at the visit, including (1) tests for overall cognitive performance: Mini-Mental State Examination (MMSE), Montreal Cognitive Assessment (MoCA), and Clinical Dementia Rating (CDR) with global scores; (2) Tests for specific cognitive domain: Rey Auditory Verbal Learning Test (RAVLT) [17], Rey-Osterrieth Complex Figure Test (ROCF) [18], Stroop Color-Word Test-Victoria version [19], Trail Making Test-A (TMT- A) and Trail Making Test B (TMT -B) [20], clock drawing test (CDT), Boston Naming Test (BNT), Digit Span Test (DST), and Symbol Digit Modalities Test (SDMT); and (3) Neuropsychiatry Inventory (NPI). These tests were administered by experienced neuropsychologists who were blinded to group assignment.
MRI assessment
All participants completed the brain MRI to exclude other demonstrable neurological diseases. Quantitative measures of signal-to-noise ratio, uniformity, and geometric distortion were conducted in each research center. 3.0 T-MRI was used with the scanning thickness not exceeding 1.5mm. The three-dimensional T1 weighted images were corrected for intensity non-uniformity with the N4 algorithm. Brain surface was reconstructed using FreeSurfer (version 7.2.0, http://surfer.nmr.mgh.harvard.edu/) recon-all pipeline. The cortical thickness and volume of the total brain, nuclei, gray matter white matter, and white matter lesion were all obtained with this pipeline. Regional cortical thickness was obtained and statistical analysis was performed.
Statistical analysis
The analysis was conducted with SPSS 24.0. Continuous variables were characterized as mean plus and/or minus standard deviations (SD). T-test or nonparametric test was used by the characteristic of the distribution. Categorical variables were analyzed by Pearson’s χ2 tests. We performed logistic regression analysis to evaluate the association between reading and CDR (CDR=0 or >0), linear regression analysis for the association of reading and neuropsychological assessment, and linear regression analysis for education and brain structure. The regression analyses were independent of age and sex in Table 2 model 1 and Table 5. The regression analyses were independent of age, sex, and education in Table 2 model 2. We also performed the collinearity analysis in every linear regression analysis, and all the results showed no collinearity between every included independent variable.
Table 2.
The logistic and linear regression analysis of reading in all cognitive tests
| Logistic regression | Model 1, OR, 95% CI | P | Model 2, OR, 95% CI | P |
|---|---|---|---|---|
| Global CDR score (=0), 330 (71.9%) | 2.012, 1.258–3.218 | 0.004 | 1.416, 0.848–2.365 | 0.210 |
| Linear regression | Model 1, Beta, 95%CI | P | Model 2, Beta, 95%CI | P |
| MMSE | 2.193 [1.463, 2.923] | <0.001 | 1.044 [0.302, 1.787] | 0.006 |
| MOCA | 3.342 [2.486, 4.198] | <0.001 | 1.546 [0.744, 2.348] | <0.001 |
| DST total | 1.240 [0.749, 1.731] | <0.001 | 0.496 [0.003, 0.988] | 0.048 |
| RAVLT learn total | 4.162 [2.208, 6.121] | <0.001 | 1.235 [−0.758, 3.227] | 0.224 |
| RAVLT long-delayed recall | 1.185 [0.544, 1.826] | <0.001 | 0.241 [−0.426, 0.907] | 0.478 |
| ROCF copy | 3.800 [1.487, 6.114] | 0.001 | 1.296 [−0.998, 3.590] | 0.267 |
| ROCF delayed recall | 5.359 [3.138, 7.580] | <0.001 | 3.103 [0.892, 5.314] | 0.006 |
| Stroop D time | −5.162 [−7.712, −2.611] | <0.001 | −3.080 [−5.789, −0.371] | 0.026 |
| Stroop W time | −4.802 [−7.074, −2.530] | <0.001 | −3.304 [−5.694, −0.914] | 0.007 |
| TMT-A time | −14.499 [−19.792, −9.206] | <0.001 | −8.246 [−13.798, −2.694] | 0.004 |
| TMT-B time | −26.290 [−40.525, −12.055] | <0.001 | −7.465 [−22.449–7.519] | 0.328 |
| BNT | 2.961 [2.252, 3.669] | <0.001 | 1.761 [1.048, 2.474] | <0.001 |
| SDMT | 7.385 [5.233, 9.538] | <0.001 | 2.719 [0.693, 4.746] | 0.009 |
| CDT | 0.703 [0.284, 1.121] | 0.001 | 0.219 [−0.218, 0.656] | 0.325 |
Model 1 logistic or linear regression included age and sex
Model 2 logistic or linear regression included age, sex, and years of education
Abbreviations: OR odds ratio for logistic regression, CI confidence interval, CDR Clinical Dementia Rating, MMSE Mini-Mental State Examination, MoCA Montreal Cognitive Assessment, DST Digit Span Test, RAVLT Rey Auditory Verbal Learning Test, ROCF Rey-Osterrieth Complex Figure Test, TMT Trail Making Test, BNT Boston Naming Test, SDMT Symbol Digit Modalities Test, CDT clock drawing test, NPI Neuropsychiatry Inventory
Table 5.
The linear regression of education and hippocampal volume
| Model 1, beta, 95% CI | P | Model 2, beta, 95% CI | P | |
|---|---|---|---|---|
| Years of education | 14.999, [4.906, 25.092] | 0.004 | 15.816, [4.949, 26.683] | 0.004 |
| Education ≥13 | 23.020, [3.868, 42,172] | 0.019 | 22.114, [1.476, 42.753] | 0.036 |
Model 1, data of left hippocampal volume were analyzed as results, age, and sex were in linear regression
Model 2, data of right hippocampal volume were analyzed as results, age, and sex were in linear regression
Abbreviations: CI confidence interval
Results
From July 31, 2019, to August 1, 2021, 694 individuals were screened from communities in Beijing, Shijiazhuang, and Langfang, all in northern China. They completed standard baseline assessments. 459 were enrolled in the study who had both valid brain MRI examination and cognitive evaluation (Fig. 1). Among them, 169 (36.82%) had regular reading activities. There was no significant difference in age, sex, medical history, and mood assessment (NPI) between the two groups (Table 1). The reading group had more years of education and better cognitive performance than the non-reading group, including CDR, MMSE, MoCA, DST, RAVLT, ROCF, Stroop D and W time, TMT-A and B, BNT, SDMT, and CDT. However, there was no difference in cortical thickness and hippocampal volume in either hemisphere between the two groups.
Fig. 1.

Study flowchart. Shown is the flowchart of the study enrollment
Table 1.
Demographic, clinical information, cognitive test scores, and MRI variables in reading and non-reading groups
| Reading n=169 |
Non-reading n=290 |
All patients n=459 |
P value | |
|---|---|---|---|---|
| Average age | 60.33±9.04 | 60.03±8.5 | 60.14±8.69 | 0.727 |
| Sex female, (n, %) | 89, 52.7% | 171, 59.0% | 260, 56.6% | 0.189 |
| Years of education | 13.88±3.3 | 11.1±3.52 | 12.12±3.69 | <0.001 |
| Hypertension (n, %) | 57, 33.7% | 96, 33.1% | 153, 33.3% | 0.918 |
| Diabetes (n, %) | 19, 11.2% | 34, 11.7% | 53, 11.5% | 0.882 |
| Stroke or TIA (n, %) | 11, 6.5% | 21, 7.2% | 32, 7.0% | 0.851 |
| Coronary heart disease (n, %) | 14, 8.3% | 18, 6.2% | 32, 7.0% | 0.449 |
| Global CDR score | 0.11±0.21 | 0.22±0.41 | 0.18±0.36 | 0.001 |
| MMSE | 26.15±2.85 | 24.04±4.82 | 24.82±4.32 | <0.001 |
| MoCA | 23.38±3.82 | 20.13±5.64 | 21.33±5.29 | <0.001 |
| DST total | 12.3±2.34 | 11.09±2.93 | 11.54±2.79 | <0.001 |
| RAVLT total learning | 39.98±10.06 | 36.26±12.68 | 37.63±11.91 | 0.001 |
| RAVLT long-delayed recall | 8.01±3.44 | 6.85±3.85 | 7.28±3.74 | 0.001 |
| ROCF copy | 32.34±6.91 | 28.48±10 | 30.36±8.83 | 0.001 |
| ROCF long-delayed recall | 16.5±7.82 | 11.03±9.01 | 13.69±8.87 | <0.001 |
| Stroop D time | 16.86±6.13 | 21.8±16.31 | 19.97±13.67 | <0.001 |
| Stroop W time | 22.32±8.05 | 26.77±14.46 | 25.12±12.65 | <0.001 |
| TMT-A time | 44.18±21.57 | 58.17±35.98 | 52.98±32.11 | <0.001 |
| TMT-B time | 101.55±71.89 | 125.32±87.41 | 116.51±82.72 | 0.002 |
| BNT | 25.02±3.4 | 21.99±4.37 | 23.11±4.29 | <0.001 |
| SDMT | 39.57±13.39 | 32.71±14.89 | 35.25±14.72 | <0.001 |
| CDT | 8.79±1.79 | 8.09±2.42 | 8.35±2.23 | <0.001 |
| NPI | 1.03±3.17 | 1.83±6.01 | 1.54±5.15 | 0.064 |
| Brain structure | ||||
| Left hippocampal volume, mm2 | 3496.15±427.05 | 3436.04±451.65 | 3458.79±442.97 | 0.170 |
| Left amygdala volume, mm2 | 1463.18±355.93 | 1482.53±324.29 | 1475.21±336.34 | 0.561 |
| Left thalamus volume, mm2 | 6879.88±904.81 | 6876.82±939.2 | 6877.98±925.29 | 0.973 |
| Left caudate volume, mm2 | 3316.52±565.36 | 3297.41±581.55 | 3304.64±574.9 | 0.737 |
| Left putamen volume, mm2 | 4632.86±662.24 | 4613.26±719.29 | 4620.68±697.55 | 0.776 |
| Left pallidum volume, mm2 | 1940±269.78 | 1916.5±238.56 | 1925.39±250.78 | 0.343 |
| Left cortex volume, mm2 | 213,629.66±24,614.53 | 215,780.91±24,480.75 | 214,966.79±24,525.43 | 0.375 |
| Left cerebral white matter volume, mm2 | 221,073.68±32,180.9 | 222,387.88±29,129.85 | 221,890.53±30,290.75 | 0.661 |
| Left mean cortical thickness, mm | 2.37±0.11 | 2.38±0.12 | 2.37±0.11 | 0.516 |
| Right hippocampal volume, mm2 | 3605.87±487.08 | 3571.79±460.36 | 3584.69±470.39 | 0.464 |
| Right amygdala volume, mm2 | 1643.52±356.73 | 1664.16±329.83 | 1656.35±340 | 0.539 |
| Right thalamus volume, mm2 | 6643.18±897.79 | 6669.33±823.35 | 6659.44±851.36 | 0.756 |
| Right caudate volume, mm2 | 3366.34±617.01 | 3358.4±559.61 | 3361.41±581.31 | 0.869 |
| Right putamen volume, mm2 | 4714.73±647.17 | 4743.82±707.15 | 4732.81±684.46 | 0.667 |
| Right pallidum volume, mm2 | 1937.36±281.85 | 1920.2±253.02 | 1926.7±264.11 | 0.511 |
| Right cortex volume, mm2 | 212,619.37±25,297.4 | 215,773.47±24,519.75 | 214,579.83±24,835.2 | 0.199 |
| Right cerebral white matter volume, mm2 | 219,923.7±31,876.29 | 221,611.7±28,804.31 | 220,972.9±29,978.85 | 0.569 |
| Right mean cortical thickness, mm | 2.36±0.11 | 2.37±0.12 | 2.37±0.11 | 0.151 |
| Cortex volume, mm2 | 426,249.03±49,571.32 | 431,554.38±48,668.99 | 429,546.62±49,023.28 | 0.274 |
| Subcortex gray volume, mm2 | 54,301.14±6096.21 | 54,392.28±6088.1 | 54,357.79±6084.32 | 0.88 |
| Total gray volume, mm2 | 440,997.39±63,865.8 | 443,999.58±57,770.04 | 442,863.43±60,094.68 | 0.613 |
| Cerebral white matter volume, mm2 | 3788.28±5597.58 | 2941.34±4143.9 | 3261.86±4758.19 | 0.093 |
| WM hyperintensities volume, mm2 | 578,959.97±62,023.02 | 584,269.48±59,903.83 | 582,260.15±60,698.27 | 0.376 |
| Brain segmentation volume, mm2 | 1,077,237.37±118,406.82 | 1,084,041.34±113,069.4 | 1,081,466.44±115,030.46 | 0.488 |
| eTIV, mm2 | 1,430,023.25±162,478.34 | 1,438,793.2±151,423.56 | 1,435,474.3±155,572.46 | 0.499 |
| Brain segmentation volume to eTIV, % | 75.59±5.81 | 75.55±5.38 | 75.56±5.54 | 0.941 |
Abbreviations: CDR Clinical Dementia Rating, MMSE Mini-Mental State Examination, MoCA Montreal Cognitive Assessment, DST Digit Span Test, RAVLT Rey Auditory Verbal Learning Test, ROCF Rey-Osterrieth Complex Figure Test, TMT Trail Making Test, BNT Boston Naming Test, SDMT Symbol Digit Modalities Test, CDT clock drawing test, NPI Neuropsychiatry Inventory, WM white matter, eTIV estimated total intracranial volume
Logistic and linear regression were used to assess confounding factors (Table 2). Reading activities were associated with better cognitive performance, such as MMSE (beta 2.193, 95%CI: 1.463–2.923, P<0.001), independent of age and sex in model 1. In model 2, when education was taken into account, reading activities showed similar effects in MoCA and Boston Naming; significant but less effects in MMSE, DST, ROCF delayed recall, Stroop D and W time, TMT-A and SDMT, but no effects in CDR, RAVLT, ROCF copy, TMT-B, and CDT.
Education had a remarkable effect on cognitive performance (Table 3). Participants with high education scored higher in all cognitive tests than those with low education. They also have higher hippocampal volumes on both sides (Fig. 2).
Table 3.
Cognitive performance and brain structure at different education levels
| Education ≤12 years n=294 |
Education ≥13 years n=165 |
P | |
|---|---|---|---|
| Average age | 61.66±8.28 | 57.43±8.78 | <0.001 |
| Sex female (n, %) | 177, 60.2% | 83, 50.3% | 0.040 |
| Years of education | 9.79±2.34 | 16.29±0.95 | <0.001 |
| Global CDR score | 0.10±0.24 | 0.22±0.40 | <0.001 |
| MMSE | 23.74±4.65 | 26.73±2.79 | <0.001 |
| MoCA | 19.47±5.18 | 24.62±3.61 | <0.001 |
| DST total | 10.72±2.51 | 12.98±2.68 | <0.001 |
| RAVLT total learning | 8.93±3.32 | 11.07±2.79 | <0.001 |
| RAVLT long-delayed recall | 6.04±3.7 | 8.65±3.53 | <0.001 |
| ROCF copy | 33.18±6.55 | 28.8±9.53 | <0.001 |
| ROCF long-delayed recall | 17.23±7.96 | 11.74±8.76 | <0.001 |
| Stroop D time | 22.07±16.02 | 16.25±6.55 | <0.001 |
| Stroop W time | 27.72±13.85 | 20.54±8.46 | <0.001 |
| TMT-A time | 59.73±32.17 | 41.09±28.42 | <0.001 |
| TMT-B time | 136.48±91.03 | 81.31±48.78 | <0.001 |
| BNT | 21.78±4.47 | 25.44±2.69 | <0.001 |
| SDMT | 30.22±13.05 | 44.06±13.285 | <0.001 |
| CDT | 8.00±2.39 | 8.96±1.76 | <0.001 |
| NPI | 1.75±5.86 | 1.16±3.55 | 0.242 |
| Brain structure | |||
| Left hippocampal volume, mm2 | 3386.57±435.93 | 3584.61±428.01 | <0.001 |
| Left amygdala volume, mm2 | 1634.78±220.55 | 1709.65±215.06 | 0.145 |
| Left thalamus volume, mm2 | 6883.74±897.91 | 6867.95±973.97 | 0.864 |
| Left caudate volume, mm2 | 3313.07±580.16 | 3289.96±567.13 | 0.697 |
| Left putamen volume, mm2 | 4629.44±710.25 | 4605.42±676.78 | 0.73 |
| Left pallidum volume, mm2 | 1931.57±251.23 | 1914.63±250.43 | 0.498 |
| Left cortex volume, mm2 | 216,139.25±23,700.57 | 212,924.21±25,849.25 | 0.188 |
| Left cerebral white matter volume, mm2 | 223,576.87±29,777.23 | 218,952.71±31,041.08 | 0.125 |
| Left mean cortical thickness, mm | 2.37±0.12 | 2.38±0.10 | 0.678 |
| Right hippocampal volume, mm2 | 3512.3±476.23 | 3710.8±433.37 | <0.001 |
| Right amygdala volume, mm2 | 4691.13±49,986.08 | 1777.05±252.54 | 0.563 |
| Right thalamus volume, mm2 | 6696.93±830.19 | 6594.12±885.91 | 0.225 |
| Right caudate volume, mm2 | 3373.49±565.75 | 3340.36±608.73 | 0.474 |
| Right putamen volume, mm2 | 4743.54±678.03 | 4714.12±697.27 | 0.666 |
| Right pallidum volume, mm2 | 1928.99±259.36 | 1922.71±272.97 | 0.812 |
| Right cortex volume, mm2 | 216,046.23±23,917.16 | 212,025.16±26,239.96 | 0.104 |
| Right cerebral white matter volume, mm2 | 222,783.05±29,373.45 | 217,819.36±30,845.32 | 0.096 |
| Right mean cortical thickness, mm | 2.37±0.12 | 2.37±0.11 | 0.800 |
| Cortex volume, mm2 | 432,185.48±47,269.6 | 424,949.37±51,768.69 | 0.138 |
| Subcortex gray volume, mm2 | 54,526.69±6033.69 | 54,063.54±6179.62 | 0.445 |
| Total gray volume, mm2 | 585,324.16±59,164.42 | 576,922.21±63,115.96 | 0.164 |
| Cerebral white matter volume, mm2 | 446,359.92±58,982.67 | 436,772.07±61,698.97 | 0.109 |
| WM hyperintensities volume, mm2 | 3219.53±4544.25 | 3335.6±5123.64 | 0.510 |
| Brain segmentation volume, mm2 | 1,089,199.77±112,197.33 | 1,067,993.91±118,965.54 | 0.110 |
| eTIV, mm2 | 1,443,152.53±151,357.93 | 1,422,097.74±162,271.98 | 0.199 |
| Brain segmentation volume to eTIV, % | 75.67±5.19 | 75.37±6.11 | 0.590 |
Abbreviations: CDR Clinical Dementia Rating, MMSE Mini-Mental State Examination, MoCA Montreal Cognitive Assessment, DST Digit Span Test, RAVLT Rey Auditory Verbal Learning Test, ROCF Rey-Osterrieth Complex Figure Test, TMT Trail Making Test, BNT Boston Naming Test, SDMT Symbol Digit Modalities Test, CDT clock drawing test, NPI Neuropsychiatry Inventory, WM white matter, eTIV estimated total intracranial volume
Fig. 2.
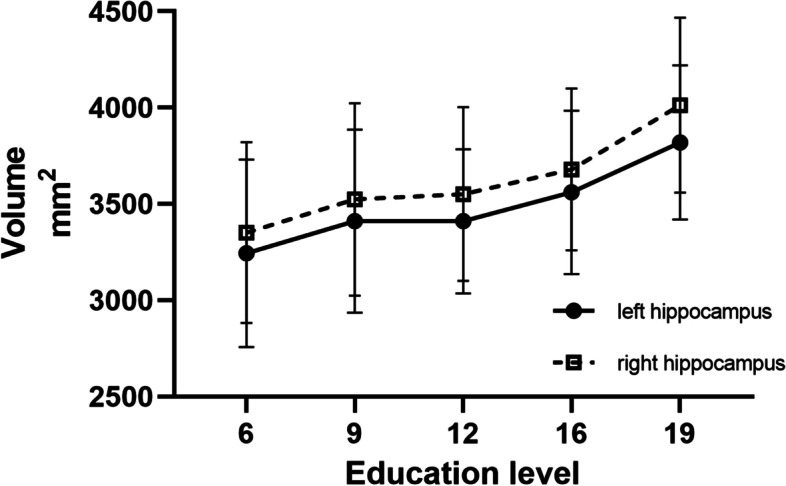
Hippocampal volumes at different education levels. Shown is the right (open box) and left (closed dot) hippocampal volume associated with different education levels
Reading years and reading content had little impact on cognitive performance and brain structure (Supplemental Tables 1 and 2). Reading e-books showed no obvious cognitive benefits than paper books, and listening to audio-books performed better in MoCA, BNT, and SDMT (Supplemental Table 3).
To assess if reading activities have a compensatory effect for low education, we divided participants into four groups: low education (educational years ≤12) with and without reading activities (groups 1 and 2), and high education (educational years ≥13) with and without reading activities (groups 3 and 4). Reading activities improved most cognitive tests (except RAVLT, ROCF copy, and TMT-B) in the low education group (group 1 better than group 2, Table 4). By reading more books, participants with low education could achieve similar or even better cognitive scores than those with high education in MMSE, MoCA, DST, and BNT (Fig. 3). In the high education groups, reading activities showed few effects probably due to ceiling effects (group 3 similar to group 4, Table 4).
Table 4.
Cognitive performance and brain structure comparison by education level and reading activities
| Group 1 n=71 |
Group 2 n=223 |
P | Group 3 n=98 |
Group 4 n=67 |
P | |
|---|---|---|---|---|---|---|
| Age | 62.66±9.79 | 61.34±7.73 | 0.299 | 58.63±8.09 | 55.67±9.5 | 0.825 |
| Gender female (n, %) | 39, 54.9% | 138, 61.9% | 0.297 | 50, 51.0% | 33, 49.3% | 0.824 |
| Education years | 10.44±1.95 | 9.58±2.42 | 0.007 | 16.37±1.08 | 16.18±0.72 | 0.180 |
| Global CDR score | 0.14±0.23 | 0.24±0.44 | 0.323 | 0.08±0.20 | 0.13±0.28 | 0.236 |
| MMSE | 25.04±3.13 | 23.33±4.97 | 0.001 | 26.94±2.35 | 26.42±3.34 | 0.241 |
| MoCA | 21.26±4.05 | 18.9±5.37 | 0.001 | 24.9±2.82 | 24.22±4.52 | 0.280 |
| DST total | 11.59±2.27 | 10.45±2.53 | 0.001 | 12.82±2.26 | 13.21±3.19 | 0.387 |
| RAVLT total learning | 35.97±9.55 | 33.81±11.85 | 0.123 | 42.85±9.45 | 44.44±12.02 | 0.345 |
| RAVLT long-delayed recall | 6.07±3.43 | 6.03±3.79 | 0.931 | 8.73±3.29 | 8.53±3.88 | 0.726 |
| ROCF copy | 30.36±8.25 | 27.99±10.07 | 0.167 | 33.96±5.08 | 30.84±9.53 | 0.186 |
| ROCF long-delayed recall | 14.33±8.32 | 10.39±8.73 | 0.012 | 18.31±6.95 | 14.05±9.92 | 0.096 |
| Stroop D time | 18.19±7.84 | 23.31±17.69 | 0.001 | 15.91±4.35 | 16.75±8.88 | 0.419 |
| Stroop W time | 24.97±9.69 | 28.59±14.85 | 0.019 | 20.42±6 | 20.72±11.21 | 0.844 |
| TMT-A time | 50.89±25.93 | 62.56±33.49 | 0.003 | 39.39±16.34 | 43.62±40.19 | 0.419 |
| TMT-B time | 128.57±91.74 | 139.01±90.87 | 0.405 | 82.26±44.79 | 79.91±54.49 | 0.764 |
| BNT | 23.97±3.87 | 21.08±4.43 | <0.001 | 25.77±2.81 | 24.96±2.45 | 0.057 |
| SDMT | 33.07±12.71 | 29.31±13.05 | 0.035 | 44.21±11.89 | 43.84±15.18 | 0.864 |
| CDT | 8.59±1.92 | 7.82±2.50 | 0.008 | 8.94±1.69 | 8.98±1.87 | 0.870 |
| NPI | 1.31±4.25 | 1.89±6.29 | 0.478 | 0.83±2.09 | 1.65±4.97 | 0.206 |
| Brain structure | ||||||
| Left hippocampal volume, mm2 | 3391.25±442.13 | 3372.73±419.86 | 0.759 | 3580.93±455.11 | 3587.09±411.2 | 0.93 |
| Left amygdala volume, mm2 | 1487.93±400.96 | 1494.7±333.99 | 0.889 | 1444.95±319.72 | 1443.14±289.65 | 0.971 |
| Left thalamus volume, mm2 | 6927.86±912.39 | 6868.82±894.71 | 0.635 | 6844.53±902.39 | 6902.71±1077.97 | 0.713 |
| Left caudate volume, mm2 | 3274.19±590.97 | 3326.22±577.32 | 0.518 | 3347.72±546.78 | 3204.22±589.96 | 0.118 |
| Left putamen volume, mm2 | 4613.36±742.16 | 4634.88±700.9 | 0.827 | 4647.23±600.29 | 4543.36±777.51 | 0.344 |
| Left pallidum volume, mm2 | 1958.16±291.24 | 1922.58±236.29 | 0.307 | 1926.63±253.55 | 1896.81±246.62 | 0.463 |
| Left cortex volume, mm2 | 215,000.93±24,471.4 | 216,524.19±23,482.27 | 0.643 | 212,619.25±24,800.12 | 213,376.89±27,526.83 | 0.857 |
| Left cerebral white matter volume, mm2 | 225,861.59±35,115.03 | 222,804.26±27,795.56 | 0.51 | 217,545.76±29,530.28 | 221,041.16±33,286.15 | 0.488 |
| Left mean cortical thickness, mm | 2.37±0.12 | 2.36±0.11 | 0.34 | 2.38±0.11 | 2.38±0.1 | 0.796 |
| Right hippocampal volume, mm2 | 3533.42±467.04 | 3449.84±500.66 | 0.205 | 3695.9±417.79 | 3720.84±445.47 | 0.723 |
| Right amygdala volume, mm2 | 1638.97±387.11 | 1671.78±333.05 | 0.495 | 1646.86±334.66 | 1639.52±320.52 | 0.89 |
| Right thalamus volume, mm2 | 6739.93±910.74 | 6682.39±802.96 | 0.617 | 6571.9±886.17 | 6627.11±891.5 | 0.701 |
| Right caudate volume, mm2 | 3326.03±602.96 | 3389.53±553.2 | 0.418 | 3396.05±628.68 | 3257.71±572.69 | 0.161 |
| Right putamen volume, mm2 | 4702.98±639.94 | 4757.25±691.4 | 0.564 | 4723.38±655.7 | 4700.38±759.94 | 0.839 |
| Right pallidum volume, mm2 | 1939.62±285.7 | 1925.39±250.47 | 0.692 | 1935.71±280.49 | 1903.42±262.42 | 0.466 |
| Right cortex volume, mm2 | 214,709.43±24,120.85 | 216,498.29±23,889.7 | 0.589 | 211,079.33±26,149.49 | 213,429.13±26,517.63 | 0.581 |
| Right cerebral white matter volume, mm2 | 225,512.97±34,160.89 | 221,859.89±27,599.24 | 0.42 | 215,805.29±29,593.22 | 220,808.98±32,622.88 | 0.317 |
| Right mean cortical thickness, mm | 2.37±0.12 | 2.35±0.11 | 0.142 | 2.38±0.11 | 2.37±0.11 | 0.427 |
| Cortex volume, mm2 | 429,710.36±48,310.18 | 433,022.48±47,001.73 | 0.613 | 423,698.58±50,582.34 | 426,806.01±53,831.66 | 0.712 |
| Subcortex gray volume, mm2 | 54,504.63±6480.09 | 54,534.15±5891.59 | 0.972 | 54,151.2±5827.67 | 53,933.42±6713.47 | 0.828 |
| Total gray volume, mm2 | 582,730.42±62,282.68 | 586,201.27±58,202.35 | 0.672 | 576,181.75±62,013.7 | 578,021.34±65,196.6 | 0.858 |
| Cerebral white matter volume, mm2 | 451,374.56±69,166.21 | 444,664.14±55,202.29 | 0.463 | 433,351.05±58,867.31 | 441,850.14±65,823.54 | 0.396 |
| WM hyperintensities volume, mm2 | 3602.52±4963.72 | 3090.02±4398.62 | 0.416 | 3925.16±6044.47 | 2460.48±3165.75 | 0.048 |
| Brain segmentation volume, mm2 | 1,093,169.74±123,689.54 | 1,087,857.27±108,324.4 | 0.733 | 1,065,497.73±113,587.95 | 1,071,699.19±127,357.94 | 0.748 |
| eTIV, mm2 | 1,440,816.13±159,459 | 1,443,942.62±148,911.25 | 0.882 | 1,422,070.61±165,054.25 | 1,422,138.01±159,346.57 | 0.998 |
| Brain segmentation volume to eTIV, % | 76.03±5.26 | 75.55±5.18 | 0.507 | 75.26±6.19 | 75.54±6.03 | 0.783 |
Four groups: low education (educational years ≤12) with and without reading activities (groups 1 and 2) and high education (educational years ≥13) with and without reading activities (groups 3 and 4)
Abbreviations: CDR Clinical Dementia Rating, MMSE Mini-Mental State Examination, MoCA Montreal Cognitive Assessment, DST Digit Span Test, RAVLT Rey Auditory Verbal Learning Test, ROCF Rey-Osterrieth Complex Figure Test, TMT Trail Making Test, BNT Boston Naming Test, SDMT Symbol Digit Modalities Test, CDT clock drawing test, NPI Neuropsychiatry Inventory, WM white matter, eTIV estimated total intracranial volume
Fig. 3.

Cognitive performance associated with reading activities at different education levels. Shown is that by reading more books, participants with low education (blue line) could achieve similar or even better cognitive scores than those with high education (red line) in a MMSE, b MoCA, c DST, and d BNT. a MMSE (education ≤12: beta, 95% CI 0.1035 [0.0009, 0.0198], P=0.0316; education ≥13: beta, 95% CI 0.0012 [−0.0035, 0.0059], P=0.6113); b MoCA (education ≤12: beta, 95% CI 0.0136 [0.0031, 0.0241], P=0.0112; education ≥13: beta, 95% CI 0.0040 [−0.0020, 0.0100], P=0. 1856); c DST (education ≤12: beta, 95% CI 0.0086 [0.0035, 0.0136], P=0.0009; education ≥13: beta, 95% CI 0.0008 [−0.0037, 0.0053], P=0.7199); d BNT (education ≤12: beta, 95% CI 0.0166 [0.0076, 0.0256], P=0.0003; education ≥13: beta, 95% CI 0.0012 [0.0012, 0.0100], P=0.0371)
The linear regression related to hippocampal volume on either side showed that years of education influenced hippocampal volume with beta1 14.999 [4.906, 25.092], P=0.004 and beta2 15.816 [4.949, 26.683], P=0.004 (Table 5), regardless of age and sex.
Discussion
In this community-based subjectively cognitively normal population, participants with regular reading activities showed better cognitive performance in overall cognitive abilities, attention, memory, language, visuospatial and executive function. This effect is independent of brain volume, especially hippocampal volume. A prospective cohort study showed that increased participation in cognitive activities (including reading) was associated with better memory [21]. Although reading activities involve multiple brain areas, subgroup analysis of the FINGER study has shown that the multi-domain intervention has no effects on brain volume, cortical thickness, and white matter lesion [22].
Education was related to cognition across all tested domains. Reading is associated with all tested domains controlled with age and sex. However, when education was included in the analysis, the effect of reading on cognitive assessment weakened, indicating a stronger correlation between education level and cognition. Reading is a complex task that involves various brain areas, including the insular and frontal opercular cortex, lateral temporal cortex, and early auditory cortex with the positive reaction and inferior temporal and motor cortex with the negative reaction [23]. However, we did not see a difference in the cortical thickness and the hippocampus between reading and non-reading groups. This suggests that reading activities may help to improve cognitive function in participants with low education level (≤12 years) independent of brain volume. In some cognitive domains, the cognitive performance gap caused by education level is decreased with the increase in reading activities. Reading is a good way to fill the cognitive gap brought about by lack of education, especially in language, non-verbal memory, and executive function.
In this study, participants with high education level had higher hippocampal volume. Larger hippocampal volumes may be associated with higher intelligence quotient (IQ), practice in hippocampus-related function (e.g., learning and memory), lifestyle, and medial/historical factors (neurotoxic effects of obesity, diabetes mellitus, hypertension, hypoxic brain injury, obstructive sleep apnea, bipolar disorder, clinical depression, and head trauma) [24]. Higher education level is favorable to the neurological task performance [10, 12, 25–27], but not to AD-related pathology [28].
MMSE and MoCA are screening tests for cognition. Their cut-off scores are based on education levels. In this study, participants with low education but reading more books showed no difference in MMSE and MoCA compared with participants with high education level. It suggests that people with low education but who read a lot probably should be screened at the same level as those who are more educated.
Audio devices are a new form of reading activities and have become popular. It is suggested that audiobooks are probably better than non-audio books at improving cognitive function. Young children learned more words from the e-book and from the audio narrator than print books [29]. Different types of books may influence the ability to retrieve information. Listening to audiobooks may stimulate more brain areas to have positive effects on cognition, especially memory and executive function. Since poor vision is not uncommon in the elderly, audiobooks are a better tool for old people to enjoy reading activities.
The strength of this study is a large community-based cohort with detailed neuropsychological testing batteries and brain MRI analysis. But the study has several limitations. First, this is an observational, cross-sectional study. Correlation does not imply causation. To study the causative effect of reading activities on cognitive function, a randomized clinical trial is warranted. Participants with certain education levels would be assigned with different reading activities. Other intellectual activities besides leisure reading would also be taken into account. Second, we enrolled participants with subjectively normal cognitive function to represent community-based cohorts. The average CDR was 0.18 although a few participants with a CDR more than 0.5. Ongoing longitudinal follow-ups will allow us to assess the relationship between risk/protective factors and the conversion to dementia. Third, all participants were enrolled from northern China. There is likely a difference in culture, education, and environmental factors among different regions in China. To expand population sampling is needed in future studies. Fourth, higher education level is associated with larger hippocampal volumes. One explanation is that education may stimulate the growth and development of the hippocampus. Alternatively, people with larger hippocampal volume may have a better chance to acquire higher education. Fifth, the study may have a recall bias since reading activities were recorded by self-reported questionnaires. People might under- or overestimate the books they read. Objective measures (e.g., a shopping receipt of purchased books) may help to validate the finding. Finally, reading activities as measured by reading books are mainly leisure reading. It does not take into account of all activities related to intellectual activities. Individuals who do a lot of reading or research at work but have little time in reading books outside of work may be underestimated in reading activities.
Conclusions
Participants in reading groups with less education (educational years ≤12) had better cognitive performance than the ones in non-reading groups. Education affects more than reading habits in every cognitive domain and in hippocampal volume.
Supplementary Information
Additional file 1: Supplemental Table 1. Cognitive performance of participants having different reading years.
Additional file 2: Supplemental Table 2. Cognitive performance of participants reading different content.
Additional file 3: Supplemental Table 3. Cognitive performance of participants using different reading materials.
Acknowledgements
We would like to thank the participants and their caregivers who participated in the study.
Abbreviations
- CANDOR
China National Clinical Research Center Alzheimer's Disease and Neurodegenerative Disorder Research
- FINGER
Finnish Geriatric Intervention Study to Prevent Cognitive Impairment and Disability
- AD
Alzheimer’s disease
- MRI
Magnetic resonance imaging
- NC
Normal cognition
- MCI
Mild cognitive impairment
- MMSE
Mini-Mental State Examination
- CDR
Clinical Dementia Rating
- MoCA
Montreal Cognitive Assessment
- RAVLT
Rey Auditory Verbal Learning Test
- ROCF
Rey-Osterrieth Complex Figure Test
- TMT
Trail Making Test
- CDT
Clock drawing test
- BNT
Boston Naming Test
- DST
Digit Span Test
- SDMT
Symbol Digit Modalities Test
- NPI
Neuropsychiatry Inventory
- SD
Standard deviations
- OR
Odds ratio
- CI
Confidence interval
- WM
White matter
- eTIV
Estimated total intracranial volume
Authors’ contributions
SL and JS designed the study. YW, SL, and JS did the scientific literature search. YW, SW, SL, NL, CZ, YP, and QW collected data. YW, WZ, SL, and JS analyzed data. YW and SL created the tables. YW, SL, and JS wrote and all authors edited the report. All authors read and approve the manuscript.
Funding
This study is supported by the Beijing Municipal Science & Technology Commission (Grant No. Z181100001518005) and the Strategic Priority Research Program of the Chinese Academy of Sciences (XDB39000000).
Availability of data and materials
SL and JS had full access to all of the data in the study and takes responsibility for the integrity of the data and the accuracy of the data analysis.
Declarations
Ethics approval and consent to participate
This protocol was approved by the Institutional Review Board of Beijing Tiantan Hospital (approval number: KY 2019-004-007) and was in accordance with relevant guidelines and regulations. Written informed consent was obtained from each participant.
Consent for publication
Not involving any person’s data in any form.
Competing interests
The authors declare that they have no competing interests.
Footnotes
Publisher’s Note
Springer Nature remains neutral with regard to jurisdictional claims in published maps and institutional affiliations.
Contributor Information
Shiping Li, Email: drlishiping@163.com.
Jiong Shi, Email: jiongshi@ncrcnd.org.cn.
References
- 1.Patnode CD, Perdue LA, Rossom RC, Rushkin MC, Redmond N, Thomas RG, et al. Screening for Cognitive Impairment in Older Adults: Updated Evidence Report and Systematic Review for the US Preventive Services Task Force. JAMA. 2020;323(8):764–785. doi: 10.1001/jama.2019.22258. [DOI] [PubMed] [Google Scholar]
- 2.Chan KY, Wang W, Wu JJ, Liu L, Theodoratou E, Car J, et al. Epidemiology of Alzheimer's disease and other forms of dementia in China, 1990–2010: a systematic review and analysis. Lancet. 2013;381(9882):2016–2023. doi: 10.1016/s0140-6736(13)60221-4. [DOI] [PubMed] [Google Scholar]
- 3.Lisko I, Kulmala J, Annetorp M, Ngandu T, Mangialasche F, Kivipelto M. How can dementia and disability be prevented in older adults: where are we today and where are we going? J Intern Med. 2021;289(6):807–830. doi: 10.1111/joim.13227. [DOI] [PMC free article] [PubMed] [Google Scholar]
- 4.Livingston G, Huntley J, Sommerlad A, Ames D, Ballard C, Banerjee S, et al. Dementia prevention, intervention, and care: 2020 report of the Lancet Commission. Lancet. 2020;396(10248):413–446. doi: 10.1016/S0140-6736(20)30367-6. [DOI] [PMC free article] [PubMed] [Google Scholar]
- 5.Ngandu T, Lehtisalo J, Solomon A, Levälahti E, Ahtiluoto S, Antikainen R, et al. A 2 year multidomain intervention of diet, exercise, cognitive training, and vascular risk monitoring versus control to prevent cognitive decline in at-risk elderly people (FINGER): a randomised controlled trial. Lancet. 2015;385(9984):2255–2263. doi: 10.1016/S0140-6736(15)60461-5. [DOI] [PubMed] [Google Scholar]
- 6.Lee ATC, Richards M, Chan WC, Chiu HFK, Lee RSY, Lam LCW. Association of Daily Intellectual Activities With Lower Risk of Incident Dementia Among Older Chinese Adults. JAMA Psychiatry. 2018;75(7):697. doi: 10.1001/jamapsychiatry.2018.0657. [DOI] [PMC free article] [PubMed] [Google Scholar]
- 7.Wilson RS, Boyle PA, Yu L, Barnes LL, Schneider JA, Bennett DA. Life-span cognitive activity, neuropathologic burden, and cognitive aging. Neurology. 2013;81(4):314–321. doi: 10.1212/WNL.0b013e31829c5e8a. [DOI] [PMC free article] [PubMed] [Google Scholar]
- 8.Hall K, Gao S, Unverzagt F, Hendrie H. Low education and childhood rural residence: risk for Alzheimer's disease in African Americans. Neurology. 2000;54(1):95–99. doi: 10.1212/wnl.54.1.95. [DOI] [PubMed] [Google Scholar]
- 9.Valenzuela M, Sachdev P. Brain reserve and cognitive decline: a non-parametric systematic review. Psychol Med. 2006;36(8):1065–1073. doi: 10.1017/s0033291706007744. [DOI] [PubMed] [Google Scholar]
- 10.Chen G, Zhao M, Yang K, Lin H, Han C, Wang X, et al. Education Exerts Different Effects on Cognition in Individuals with Subjective Cognitive Decline and Cognitive Impairment: A Population-Based Study. J Alzheimers Dis. 2021;79(2):653–661. doi: 10.3233/JAD-201170. [DOI] [PubMed] [Google Scholar]
- 11.Bento-Torres NV, Bento-Torres J, Tomas AM, Costa VO, Correa PG, Costa CN, et al. Influence of schooling and age on cognitive performance in healthy older adults. Braz J Med Biol Res. 2017;50(4):e5892. doi: 10.1590/1414-431X20165892. [DOI] [PMC free article] [PubMed] [Google Scholar]
- 12.Schneider AL, Sharrett AR, Patel MD, Alonso A, Coresh J, Mosley T, et al. Education and cognitive change over 15 years: the atherosclerosis risk in communities study. J Am Geriatr Soc. 2012;60(10):1847–1853. doi: 10.1111/j.1532-5415.2012.04164.x. [DOI] [PMC free article] [PubMed] [Google Scholar]
- 13.Wilson RS, Yu L, Lamar M, Schneider JA, Boyle PA, Bennett DA. Education and cognitive reserve in old age. Neurology. 2019;92(10):e1041–e1e50. doi: 10.1212/WNL.0000000000007036. [DOI] [PMC free article] [PubMed] [Google Scholar]
- 14.Johnson AS, Flicker LJ, Lichtenberg PA. Reading ability mediates the relationship between education and executive function tasks. J Int Neuropsychol Soc. 2006;12(1):64–71. doi: 10.1017/S1355617706060073. [DOI] [PubMed] [Google Scholar]
- 15.O'Carroll R, Ebmeier K. Education and prevalence of Alzheimer's disease and vascular dementia. Premorbid ability influences measures used to identify dementia. BMJ. 1995;311(6997):125–126. doi: 10.1136/bmj.311.6997.125b. [DOI] [PMC free article] [PubMed] [Google Scholar]
- 16.Mougias A, Christidi F, Kaldi M, Kerossi MI, Athanasouli P, Politis A. Mini-Mental State Examination: Greek Normative Data Stratified by Age and Education in a Large Sample of 925 Community-Dwelling Healthy Participants. Adv Exp Med Biol. 2020;1196:93–102. doi: 10.1007/978-3-030-32637-1_9. [DOI] [PubMed] [Google Scholar]
- 17.Lezak MD. Neuropsychological Assessment, (2nd ed) New York: Oxford University Press; 1983. [Google Scholar]
- 18.Zhang X, Lv L, Min G, Wang Q, Zhao Y, Li Y. Overview of the Complex Figure Test and Its Clinical Application in Neuropsychiatric Disorders, Including Copying and Recall. Front Neurol. 2021;12:680474. doi: 10.3389/fneur.2021.680474. [DOI] [PMC free article] [PubMed] [Google Scholar]
- 19.Spreen O, Strauss E. A compendium of neuropsychological tests: administration, norms, and commentary. 2nd ed. New York: Oxford University Press; 1998
- 20.Lezak MDHD, Loring DW, Hannay HJ, Fischer JS. Neuropsychological Assessment. 4th ed. New York: Oxford University Press; 2004. [Google Scholar]
- 21.Verghese J, Lipton RB, Katz MJ, Hall CB, Derby CA, Kuslansky G, et al. Leisure activities and the risk of dementia in the elderly. N Engl J Med. 2003;348(25):2508–2516. doi: 10.1056/NEJMoa022252. [DOI] [PubMed] [Google Scholar]
- 22.Stephen R, Liu Y, Ngandu T, Antikainen R, Hulkkonen J, Koikkalainen J, et al. Brain volumes and cortical thickness on MRI in the Finnish Geriatric Intervention Study to Prevent Cognitive Impairment and Disability (FINGER) Alzheimers Res Ther. 2019;11(1):53. doi: 10.1186/s13195-019-0506-z. [DOI] [PMC free article] [PubMed] [Google Scholar]
- 23.Kristanto D, Liu M, Liu X, Sommer W, Zhou C. Predicting reading ability from brain anatomy and function: From areas to connections. Neuroimage. 2020;218:116966. doi: 10.1016/j.neuroimage.2020.116966. [DOI] [PubMed] [Google Scholar]
- 24.Fotuhi M, Do D, Jack C. Modifiable factors that alter the size of the hippocampus with ageing. Nat Rev Neurol. 2012;8(4):189–202. doi: 10.1038/nrneurol.2012.27. [DOI] [PubMed] [Google Scholar]
- 25.Bruandet A, Richard F, Bombois S, Maurage CA, Masse I, Amouyel P, et al. Cognitive decline and survival in Alzheimer's disease according to education level. Dement Geriatr Cogn Disord. 2008;25(1):74–80. doi: 10.1159/000111693. [DOI] [PubMed] [Google Scholar]
- 26.Cabeza R, Albert M, Belleville S, Craik F, Duarte A, Grady C, et al. Maintenance, reserve and compensation: the cognitive neuroscience of healthy ageing. Nat Rev Neurosci. 2018;19(11):701–710. doi: 10.1038/s41583-018-0068-2. [DOI] [PMC free article] [PubMed] [Google Scholar]
- 27.Stern Y, Arenaza-Urquijo E, Bartrés-Faz D, Belleville S, Cantilon M, Chetelat G, et al. Whitepaper: Defining and investigating cognitive reserve, brain reserve, and brain maintenance. Alzheimers Dementia. 2020;16(9):1305–1311. doi: 10.1016/j.jalz.2018.07.219. [DOI] [PMC free article] [PubMed] [Google Scholar]
- 28.Richards M, Deary IJ. A life course approach to cognitive reserve: a model for cognitive aging and development? Ann Neurol. 2005;58(4):617–622. doi: 10.1002/ana.20637. [DOI] [PubMed] [Google Scholar]
- 29.O'Toole KJ, Kannass KN. Emergent literacy in print and electronic contexts: The influence of book type, narration source, and attention. J Exp Child Psychol. 2018;173:100–115. doi: 10.1016/j.jecp.2018.03.013. [DOI] [PubMed] [Google Scholar]
Associated Data
This section collects any data citations, data availability statements, or supplementary materials included in this article.
Supplementary Materials
Additional file 1: Supplemental Table 1. Cognitive performance of participants having different reading years.
Additional file 2: Supplemental Table 2. Cognitive performance of participants reading different content.
Additional file 3: Supplemental Table 3. Cognitive performance of participants using different reading materials.
Data Availability Statement
SL and JS had full access to all of the data in the study and takes responsibility for the integrity of the data and the accuracy of the data analysis.