

Abstract
Introduction
Customized intrauterine growth charts are widely used for growth monitoring and research. They are based on three assumptions: (1) estimated fetal weight (EFW) has a normal distribution with a constant coefficient of variation at all gestational ages; (2) Hadlock’s growth curve accurately describes the relation between EFW and gestational ages; (3) associations between EFW and the fetal and maternal characteristics included in the customization model (fetal sex, pre‐pregnancy weight, height, parity) are proportional throughout pregnancy. The aim of this study was to test whether these underlying assumptions are verified.
Material and methods
Data came from (1) the French Longitudinal Study of Children (ELFE) cohort, which recruited births after 32 weeks' gestation in 349 maternity hospitals in France in 2011, and (2) the National Perinatal Survey, which included births from all French maternity hospitals in 2016. The study population included, respectively, 6 920 and 8 969 singleton non‐malformed term live births with data on customization characteristics and EFW. We computed the coefficient of variation by gestational age and then modeled the association of gestational age, maternal and fetal characteristics with EFW at the second and third trimester ultrasound and with birthweight using linear regression. To assess the proportionality of the impact of maternal and fetal characteristics, we computed the percent change in weight associated with these characteristics at these three time points.
Results
The coefficient of variation was close to 12% at each gestational age, but EFW was not normally distributed, leading to small but systematic underestimation of fetuses under the 10th percentile. Weights representing the 50th and 10th percentiles based on Hadlock’s growth trajectory were lower than observed or predicted weights. Most characteristics more strongly impacted weight at birth than during pregnancy. In the French Longitudinal study of Children (ELFE) cohort, boys were 1.8% (95% confidence interval [CI] 1.3–2.4) heavier than girls in the third trimester, whereas this percentage was 4.6% (95% CI 4.0–5.2) at birth. In the National Perinatal Survey, these percentages were 2.3% (95% CI 1.8–2.8) and 4.3% (95% CI 3.8–4.8).
Conclusions
These results from two independent sources revealed discrepancies between routine clinical EFW data used for growth monitoring and the customized growth model’s assumptions.
Keywords: customization, fetal growth, fetal growth restriction, growth charts, small for gestational age
Abbreviations
- CV
coefficient of variation
- EFW
estimated fetal weight
- ELFE
French Longitudinal Study of Children
- FGR
fetal growth restriction
- GA
gestational age
- NPS
National Perinatal Survey
Key message.
Slight violations of two of the three assumptions underlying the customized growth model raise questions about its fit when applied to estimated fetal weight. Modifications to the model may improve its performance for identifying fetuses at risk of growth restriction.
1. INTRODUCTION
Fetal growth restriction denotes the fetus' failure to reach its full growth potential. It is associated with risks of stillbirth, neonatal death and neurodevelopmental impairment. 1 , 2 , 3 When fetal growth restriction is detected during pregnancy, these risks can be reduced by close monitoring and early delivery. 4 , 5 , 6 Therefore, intrauterine growth screening aims to identify fetuses at risk of fetal growth restriction, frequently defined as those with an estimated fetal weight (EFW) under the 10th percentile of a reference population. 7 , 8 , 9 , 10
Customized growth charts, proposed by Gardosi in the 1990s, aim to improve growth screening by differentiating between constitutionally small fetuses and those with suboptimal growth. 11 They adjust for factors that physiologically affect birthweight, including maternal (pre‐pregnancy weight, height, parity, ethnicity) and fetal (sex) factors. 12 , 13 , 14 Customized charts are recommended in the UK, New Zealand and Ireland 8 and were developed in France in 2015. 15 Many studies have shown that taking into consideration these physiological factors identifies births with higher risks of adverse outcomes, such as stillbirth and neonatal death, 16 , 17 , 18 although the model’s impact on population‐level outcomes has been questioned. 19
Customized charts are based on modeling the impact of maternal and fetal characteristics on birthweight in a sample of normal pregnancies (singleton, live, non‐malformed, term births). 11 This model is used to calculate each fetus' optimal birthweight at 40 weeks' gestation; individualized norms are then derived for each gestational age (GA) by applying Hadlock’s growth trajectory formula, 20 and percentiles are calculated using the coefficient of variation (CV) measured at 40 weeks’ GA. The model makes three key assumptions: (1) fetal weight is normally distributed with a constant CV, (2) Hadlock’s growth trajectory accurately describes fetal growth patterns, and (3) the effect of fetal and maternal characteristics is proportional throughout pregnancy, meaning that they increase fetal weight by the same percentage at all GA. 11
Despite the widespread use of customized models in research and clinical care, few studies have investigated these assumptions. 21 Most evaluations of the model have been carried out using birthweight, 16 , 17 , 22 , 23 but results may differ when the model is applied to EFW, used for screening. Indeed, recent comparisons with local or international charts based on EFW have shown no significant differences for the detection of adverse perinatal outcomes. 24 , 25 , 26 The aim of this study was to test the three assumptions of the customized model using routine clinical data on EFW in the second and third trimesters of pregnancy.
1. MATERIAL AND METHODS
1.1. Data sources
Data were sourced from two French population birth studies. By using two sources, we sought to assess the consistency and generalizability of study findings. The first source was the French Longitudinal Study of Children (ELFE) birth cohort, which recruited births from 349 maternity hospitals, randomly selected from 544 maternity hospitals in metropolitan France, over 25 days in 2011. 27 , 28 Inclusion criteria were singleton or twin live births after 33 weeks' gestation with mothers aged ≥18 years and parents understanding French, English, Arabic or Turkish who lived and planned to stay in France for at least 3 years and gave written informed consent (N = 18 329). The second source was the 2016 French National Perinatal Survey (NPS), which included all births with a GA of at least 22 weeks or a birthweight of at least 500 g during a 1‐week period in 2016 in 517 maternity hospitals in France (N = 14 142). 29 Stillbirths, births to minors and mothers refusing to participate in the full study only contributed partial data. For both studies, data were collected from medical records and an interview with mothers after delivery.
1.2. Variable selection and definition
Outcome variables were EFW at the second and third trimester routine ultrasound and birthweight. We also used GA at the ultrasounds and at birth in weeks and days. Second and third trimester ultrasounds are recommended in France for all pregnant women at 20–25 and 30–35 weeks' gestation, respectively,30 and it is also recommended that GA be calculated using crown–rump length measured before 14 weeks' gestation. 31
For the ELFE study, femur length and transverse abdominal diameter or – if the latter was not available – abdominal circumference ultrasound measures were collected from the second and third routine ultrasound reports in obstetrical records. We used Hadlock’s formula based on abdominal circumference and femur length to calculate EFW since the value calculated at the ultrasound was not collected for this study. 32 Information on transverse abdominal diameter was not used as this measure is no longer recommended for use in clinical practice, 33 and there is no validated conversion formula for estimating abdominal circumference. The NPS collected data on EFW at the third trimester scan, as noted in medical records; biometric measurements and data on the second trimester scan were not collected in this study. We did not have information on the formula used to calculate EFW, but Hadlock’s formula based on head circumference, femur length and abdominal circumference is recommended in France. 32 , 33
Our independent variables were those used in Gardosi’s customized model: fetal sex, maternal height and pre‐pregnancy weight, parity, GA and smoking in third trimester, with the exception of ethnicity, as these data are not collected routinely in France. 15 As in Gardosi’s methodology, the model is adjusted on smoking to include all pregnant women in the calculation of customization coefficients, without shifting weight distributions towards lower values due to maternal smoking. However, this characteristic is not used to predict optimal weight. Maternal age and educational level were used to describe and compare the samples but are not included in the customized model.
1.3. Study population
We selected a sample of singleton non‐malformed term live births, as used by Gardosi. 11 After exclusion of births with minimal data (stillbirths and minors) and refusals in the NPS (n = 1 522), exclusions for multiples, congenital anomalies and preterm birth were 1 884 (ELFE) and 1 336 (NPS) (Supporting Information Figure S1). We excluded 942 and 274 women, respectively, for whom data on the variables for the customized model were missing. We then excluded women with ultrasounds done outside the recommended GA ranges (20–25 weeks in the second trimester and 30–35 weeks in the third trimester) in order to focus on routine ultrasounds only (n = 971 [ELFE]; 365 [NPS]).
We included women with data at all time points in order to evaluate the customized model during pregnancy and at birth using the same sample. All ultrasound data could be missing when ultrasound reports were not transcribed in medical records or because women did not have one or both of the ultrasounds (n = 3 470 [ELFE]; 968 [NPS]). This latter occurrence is infrequent as almost all women have these routine ultrasounds. 29 Data could also be missing for one ultrasound parameter or for GA at ultrasound (n = 380 [ELFE]; 649 [NPS]). In the ELFE cohort, data were also missing when transverse abdominal diameter was collected without abdominal circumference (n = 3 762).
1.4. Analysis strategy
First, we compared maternal and infant characteristics between the samples and between included and missing cases in each data source. To check the accuracy of our ultrasound data, we visually assessed concordance of EFW medians and 10th percentiles by GA with French College of Fetal Sonography references. 34
To verify the three assumptions underlying the customized model, we first compared the CV (standard deviation/mean) of EFW in the second and third trimesters and birthweight using the asymptotic test for the equality of CV by Feltz et al. 35 The normality of the distribution of EFW and birthweight was tested using the Shapiro–Wilk test; we also calculated the percentages of fetuses and newborns with a weight under the 10th percentile when assuming a normal distribution.
Next, we estimated linear regression models for EFW at the second and third trimester ultrasound and birthweight, following the specifications used by Gardosi. 11 In these models, continuous covariables were centered at their means. Maternal pre‐pregnancy weight and GA were included in the model using a third‐degree polynomial.
To compare growth trajectories, 18 we plotted proportionality curves of Hadlock’s model expressed as a percentage of EFW calculated at 40 weeks’ gestation (3 619 g) along with the 50th percentile of the predicted weights from our three models calibrated with all characteristics at their mean and the observed sample weights, both expressed as a percentage of mean birthweight at 40 complete weeks’ gestation as done in the customized model. We also plotted the 10th percentile computed by applying the observed CV at 40 weeks’ gestation to Hadlock’s model and to our models’ predicted weights, as specified by the customized model, as well as the 10th percentile observed from the data.
To test the final assumption that the associations of maternal and fetal characteristics with weight were similar throughout pregnancy, we computed the magnitude of the association as a percentage of the mean weight explained by each variable and its 95% confidence interval. This was calculated for each variable using the coefficients from the regression models, keeping other variables at their mean values. For example, the percentage impact of fetal sex was calculated as the ratio of the expected average weight of a boy over the expected average weight of a girl, from which we subtracted 1.
With c: model’s constant, k: model’s coefficient, m: mean, a to l: other predictors.
For maternal weight and height, we calculated the percentage impact for a difference of 10 and 20 units from the mean (i.e. 65 kg and 165 cm, respectively). This value was calculated as a nonlinear combination of the estimated coefficients (formula nlcom in Stata 14.0). 36 Analyses were conducted using complete cases; multiple imputation using chained equations with 100 imputed datasets was carried out as a sensitivity analyses. 37 , 38
1.5. Ethical approval
The ELFE and NPS studies received ethical approval from relevant committees, including the French National Data Protection Authority (CNIL): N° 910504, March 17, 2011 (ELFE), and No 915197, January 14, 2016 (NPS).
2. RESULTS
The study samples included 6 920 births from the ELFE cohort and 8 969 births from the NPS (Figure S1). Women in the ELFE cohort were slightly older, had lower average weight and higher average height than those in the NPS and were more often nulliparous, smokers and more educated (Table 1). Mean EFW and birthweight were slightly higher in the ELFE sample. In both studies, women with missing data had a lower educational level and higher EFW (Tables S1 and S2). In ELFE, women with missing data also delivered slightly earlier and had later third trimester ultrasound scans; those in the NPS were more often multiparous and smoked more. The median and 10th percentiles of EFW by GA were similar in both samples and concordant with French references (Figure S2).
TABLE 1.
Demographic and clinical characteristics of the two samples
| ELFE cohort | NPS | p‐value (χ2 test or Student’s test as appropriate) | |
|---|---|---|---|
| (N = 6 920) | (N = 8 969) | ||
| Mean (SD) or % | Mean (SD) or % | ||
| Maternal age (years) | 30.6 (5.0) | 30.2 (5.1) | <0.001 |
| Education level | |||
| Primary school | 0.5 | 0.9 | <0.001 |
| Middle school | 3.5 | 5.9 | |
| High school | 34.7 | 36.8 | |
| College | 61.0 | 56.0 | |
| Maternal weight before pregnancy (kg) | 63.9 (13.7) | 64.9 (14.1) | <0.001 |
| Maternal height (cm) | 165.0 (6.2) | 164.6 (6.3) | <0.001 |
| Parity | |||
| 0 | 45.8 | 42.4 | <0.001 |
| 1 | 35.0 | 36.1 | |
| 2 | 13.3 | 14.3 | |
| 3 | 4.2 | 4.5 | |
| 4 and more | 1.8 | 2.8 | |
| Smoking status | |||
| Smoker | 20.0 | 15.2 | <0.001 |
| Fetal sex | |||
| Male | 51.6 | 51.0 | 0.545 |
| Gestational age at 2nd trimester ultrasound (weeks) | 22.4 (0.9) | — | — |
| Estimated fetal weight at second trimester (g) | 538 (100) | — | — |
| Gestational age at third trimester ultrasound (weeks) | 32.5 (0.9) | 32.5 (0.9) | 0.062 |
| Estimated fetal weight at third trimester (g) | 2 010 (298) | 1 993 (282) | <0.001 |
| Gestational age at birth (weeks) | 39.8 (1.1) | 39.7 (1.1) | <0.001 |
| Birthweight (g) | 3 371 (446) | 3 334 (447) | <0.001 |
Abbreviations: ELFE, étude longitudinal française depuis l’enfance (French Longitudinal Study of Children); NPS, National Perinatal Survey; SD, standard deviation.
Table 2 displays the mean weights and CV by GA. The CV were close to 12%, with higher variation for GA with fewer data points. The test for the equality of the CV with a null hypothesis that they were all equal and an alternative hypothesis that at least one was not equal to the others was not significant (p = 0.820 [EFLE] and 0.610 [NPS]). The EFW distribution was skewed towards lower values, and Shapiro–Wilk tests rejected the hypothesis of normality at almost all weeks of GA, which led to 5–8% of fetuses with an EFW under the 10th percentile when assuming a normal distribution for all GA (Figures 1A–C).
TABLE 2.
Mean weight and coefficient of variation by gestational age at routine ultrasounds and at birth
| ELFE cohort (N = 6920) |
National Perinatal Survey (N = 8 969) |
|||||||||
|---|---|---|---|---|---|---|---|---|---|---|
| N | Mean weight | SD | CV (%) | 95% CI | N | Mean weight | SD | CV (%) | 95% CI | |
| Second trimester ultrasound | ||||||||||
| 20 | 172 | 391 | 64 | 16.5 | 14.8–18.2 | |||||
| 21 | 1 310 | 456 | 56 | 12.2 | 11.7–12.7 | |||||
| 22 | 3 620 | 527 | 62 | 11.7 | 11.4–12.0 | N/A | ||||
| 23 | 1 361 | 603 | 78 | 12.9 | 12.4–13.4 | |||||
| 24 | 362 | 708 | 112 | 15.9 | 14.7–17.0 | |||||
| 25 | 95 | 815 | 143 | 17.6 | 15.1–20.1 | |||||
| Third trimester ultrasound | ||||||||||
| 30 | 246 | 1 635 | 209 | 12.8 | 11.6–13.9 | 302 | 1 635 | 202 | 12.4 | 11.4–13.3 |
| 31 | 1 242 | 1 820 | 221 | 12.1 | 11.7–12.6 | 1614 | 1 815 | 214 | 11.8 | 11.4–12.2 |
| 32 | 3 383 | 1 987 | 247 | 12.4 | 12.1–12.7 | 4772 | 1 977 | 234 | 11.8 | 11.6–12.1 |
| 33 | 1 550 | 2 152 | 262 | 12.2 | 11.7–12.6 | 1772 | 2 139 | 243 | 11.4 | 11.0–11.7 |
| 34 | 370 | 2 340 | 306 | 13.1 | 12.1–14.0 | 352 | 2 360 | 277 | 11.7 | 10.9–12.6 |
| 35 | 129 | 2 508 | 326 | 13.0 | 11.4–14.6 | 157 | 2 544 | 301 | 11.8 | 10.5–13.1 |
| At birth | ||||||||||
| 37 | 375 | 2 957 | 389 | 13.2 | 12.2–14.1 | 650 | 2 923 | 418 | 14.3 | 13.6–15.1 |
| 38 | 969 | 3 159 | 424 | 13.4 | 12.8–14.0 | 1534 | 3 156 | 420 | 13.3 | 12.8–13.7 |
| 39 | 2 121 | 3 316 | 408 | 12.3 | 11.9–12.7 | 2627 | 3 301 | 403 | 12.2 | 11.9–12.5 |
| 40 | 2 111 | 3 455 | 415 | 12.0 | 11.6–12.4 | 2552 | 3 431 | 408 | 11.9 | 11.6–12.2 |
| 41 | 1 344 | 3 593 | 418 | 11.6 | 11.2–12.1 | 1623 | 3 568 | 417 | 11.7 | 11.3–12.1 |
Note: P‐values of the test for the equality of the coefficients of variation equal 0.820 and 0.610 for ELFE and NPS, respectively.
Abbreviations: CI, confidence interval; CV, coefficient of variation; ELFE, étude longitudinal française depuis l’enfance (French Longitudinal Study of Children); N/A, not applicable; NPS, National Perinatal Survey; SD, standard deviation.
Figure 1.
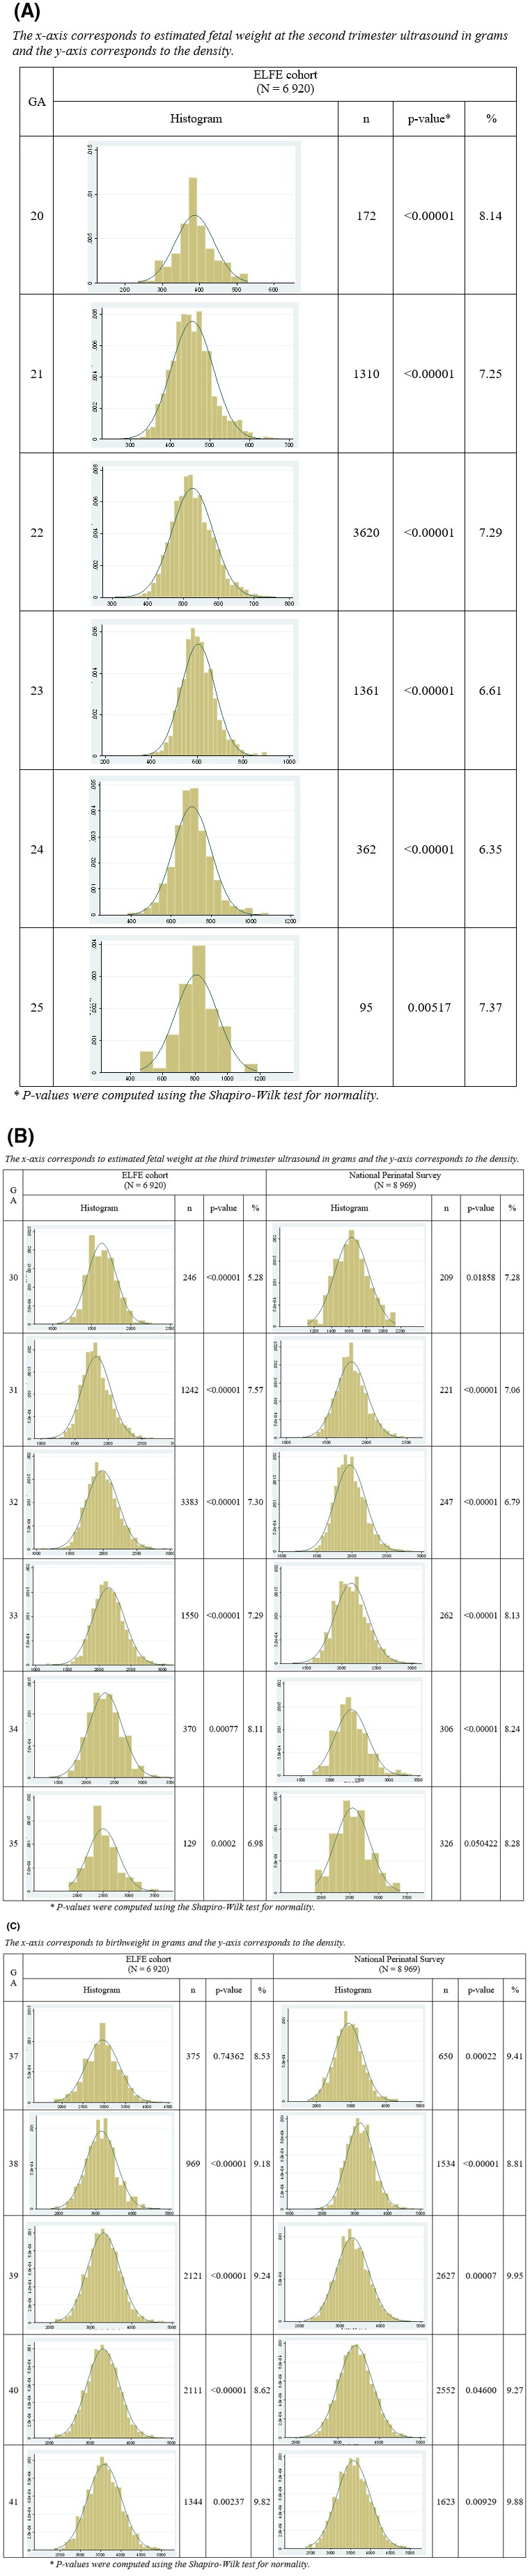
Histogram of fetal weight distribution at (A) second and (B) third trimester in the ELFE and NPS samples and percentage of fetuses with a weight under the 10th percentile when assuming a normal distribution. (C) Histogram of birthweight distribution in the ELFE and NPS samples and percentage of newborns with a weight under the 10th percentile when assuming a normal distribution. ELFE, étude longitudinal française depuis l’enfance (French Longitudinal Study of Children); NPS, National Perinatal Survey
Models of EFW at the second and third trimesters and of birthweight that included GA and maternal and fetal characteristics were computed (Table 3). Most coefficients did not differ by more than 25 (corresponding to 25 g) between the two samples, except for parity 2 at second trimester (26.7) and for parity 4 and smoking at third trimester (85.1 and 47.7). They were first used to derive proportionality curves for the predicted 50th and 10th percentile weights for ELFE and NPS in comparison with Hadlock’s growth trajectories and observed percentiles, all expressed as a percentage of mean birthweight at 40 weeks’ gestation (Figure 2A–C). Results for ELFE and NPS were similar, with slightly higher observed than predicted values. These were both substantially higher than the expected values based on Hadlock’s trajectory from 20 weeks of gestation until 33 weeks of gestation.
TABLE 3.
Modeling of estimated fetal weight at second and third trimester routine ultrasounds and birthweight with maternal and fetal characteristics
| Reference | ELFE cohort (N = 6 920) |
NPS (N = 8 969) |
|||
|---|---|---|---|---|---|
| Coefficient | SE | Coefficient | SE | ||
| Model 1 : EFW at second trimester | |||||
| GA | 22 GA | 11.0 | 0.2 | — | — |
| GA 2 | 0.1 | 0.02 | — | — | |
| GA 3 | −0.001 | 0.001 | — | — | |
| Fetal sex | Female | 14.5 | 1.6 | — | — |
| Centered height | 165 cm | 0.8 | 0.1 | — | — |
| Centered weight | 65 kg | 0.2 | 0.01 | — | — |
| Centered weight 2 | −0.02 | 0.005 | — | — | |
| Centered weight 3 | 0.0004 | 0.0001 | — | — | |
| Parity 1 | Parity 0 | 6.1 | 1.8 | — | — |
| Parity 2 | 3.2 | 2.5 | — | — | |
| Parity 3 | 10.5 | 4.1 | — | — | |
| Parity 4 | 14.9 | 6.1 | — | — | |
| Smoking | No | −0.9 | 2.0 | — | — |
| Constant | 492.5 | 1.8 | — | — | |
| Model 2 : EFW at third trimester | |||||
| GA | 32 GA | 25.0 | 0.7 | 25.8 | 0.6 |
| GA 2 | 0.04 | 0.07 | 0.08 | 0.06 | |
| GA 3 | 0.001 | 0.004 | −0.002 | 0.003 | |
| Fetal sex | Female | 36.8 | 5.8 | 45.7 | 4.7 |
| Centered height | 165 cm | 1.8 | 0.5 | 2.2 | 0.4 |
| Centered weight | 65 kg | 3.9 | 0.3 | 2.9 | 0.2 |
| Centered weight 2 | −0.07 | 0.02 | −0.07 | 0.01 | |
| Centered weight 3 | 0.0009 | 0.0003 | 0.0007 | 0.0003 | |
| Parity 1 | Parity 0 | 35.5 | 6.5 | 10.9 | 5.3 |
| Parity 2 | 41.4 | 9.0 | 14.7 | 7.2 | |
| Parity 3 | 51.8 | 14.8 | 36.2 | 11.8 | |
| Parity 4 | −12.7 | 22.2 | 8.7 | 14.7 | |
| Smoking | No | −39.7 | 7.3 | −50.6 | 6.6 |
| Constant | 1 909.9 | 6.4 | 1 890.6 | 5.4 | |
| Model 3 : Birthweight | |||||
| GA | 40 GA | 19.7 | 1.1 | 18.1 | 0.9 |
| GA 2 | −0.16 | 0.1 | −0.11 | 0.08 | |
| GA 3 | 0.005 | 0.007 | 0.016 | 0.006 | |
| Fetal sex | Female | 151.1 | 9.3 | 140.6 | 8.0 |
| Centered height | 165 cm | 7.1 | 0.8 | 7.5 | 0.7 |
| Centered weight | 65 kg | 6.2 | 0.5 | 5.6 | 0.4 |
| Centered weight 2 | −0.19 | 0.03 | −0.13 | 0.02 | |
| Centered weight 3 | 0.0020 | 0.0005 | 0.0013 | 0.0004 | |
| Parity 1 | Parity 0 | 111.5 | 10.4 | 118.5 | 9.1 |
| Parity 2 | 129.7 | 14.5 | 138.4 | 12.3 | |
| Parity 3 | 145.6 | 23.7 | 135.1 | 20.1 | |
| Parity 4 | 42.3 | 35.6 | 127.4 | 25.2 | |
| Smoking | No | −123.8 | 11.6 | −171.5 | 11.2 |
| Constant | 3 324.1 | 10.6 | 3 289.8 | 9.4 | |
Abbreviations: EFW, estimated fetal weight; ELFE, étude longitudinal française depuis l’enfance (French longitudinal study of children); GA, gestational age; NPS, National Perinatal Survey; SE, standard error.
Figure 2.
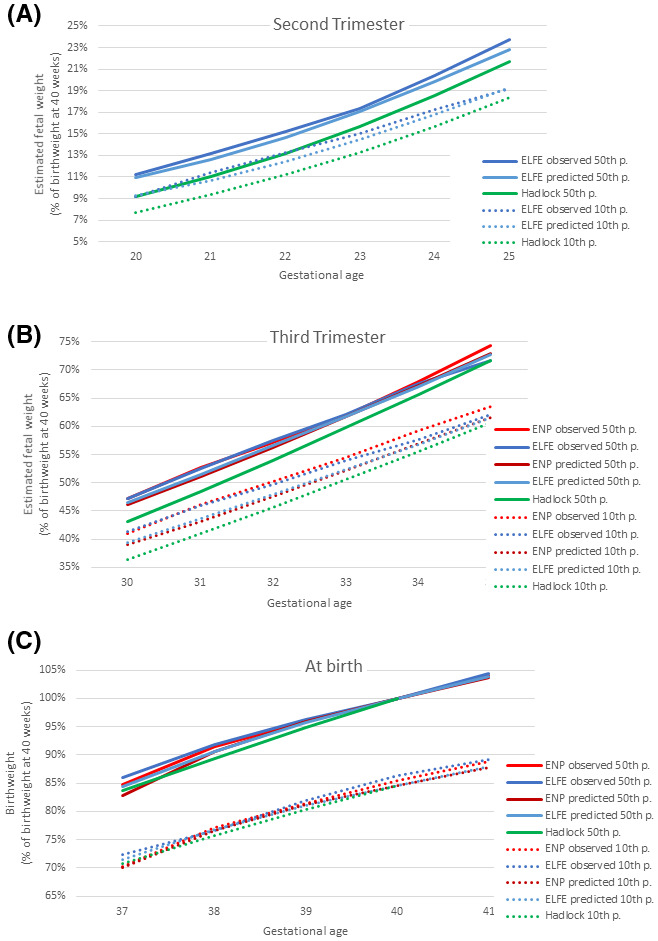
Proportionality curves of predicted and observed mean and 10th percentile weight for ELFE and NPS models compared with Hadlock’s growth chart at (A) second trimester ultrasound, (B) third trimester ultrasound and (C) birth. ELFE, étude longitudinal française depuis l’enfance (French Longitudinal Study of Children); NPS, National Perinatal Survey
As shown in Table 4, percentages of change in weight associated with characteristics were similar between the two samples, except for parity 1 in the second model and smoking status in the third model. Fetal sex and maternal height were associated with an increase in weight in all three periods, but the percentage of mean weight associated with these variables was higher at birth than at the third trimester ultrasound scan. Maternal weight before pregnancy and smoking status were associated with weight only in the third trimester and at birth. The percentage of mean weight associated with smoking status increased as the pregnancy progressed, whereas it was constant at the third trimester and at birth for maternal pre‐pregnancy weight. The association of parity was significant starting in the second trimester in the ELFE cohort but only at birth in the National Perinatal Survey.
TABLE 4.
Percent change in fetal weight and birthweight explained by maternal and fetal characteristics in the two samples
| Reference | ELFE cohort (N = 6 920) |
NPS0 (N = 8 969) |
|||
|---|---|---|---|---|---|
| % | 95% CI | % | 95% CI | ||
| Model 1 : EFW at second trimester | |||||
| 1 week gestation | 22 GA | 16.5 | 16.0–17.1 | — | — |
| Male | Female | 2.7 | 2.1–3.3 | — | — |
| Mean height + 10 cm | 165 cm | 1.5 | 1.0–2.0 | — | — |
| Mean height + 20 cm | 3.0 | 2.0–4.0 | — | — | |
| Mean weight + 10 kg | 65 kg | 0.01 | −0.3–0.3 | — | — |
| Mean weight + 20 kg | −0.3 | −0.9–0.4 | — | — | |
| Parity 1 | Parity 0 | 1.1 | 0.5–1.8 | — | — |
| Parity 2 | 0.6 | −0.3–1.5 | — | — | |
| Parity 3 | 2.0 | 0.5–3.4 | — | — | |
| Parity 4 | 2.9 | 0.5–5.0 | — | — | |
| Smoker | Nonsmoker | −0.2 | −0.9–0.6 | — | — |
| Model 2 : EFW at third trimester | |||||
| 1 week gestation | 32 GA | 9.2 | 8.7–9.7 | 9.7 | 9.2–10.1 |
| Male | Female | 1.8 | 1.3–2.4 | 2.3 | 1.8–2.8 |
| Mean height + 10 cm | 165 cm | 0.9 | 0.4–1.4 | 1.1 | 0.7–1.5 |
| Mean height + 20 cm | 1.8 | 0.9–2.8 | 2.2 | 1.4–3.0 | |
| Mean weight + 10 kg | 65 kg | 1.2 | 0.9–1.4 | 1.2 | 0.9–1.4 |
| Mean weight + 20 kg | 1.9 | 1.2–2.5 | 1.8 | 1.3–2.4 | |
| Parity 1 | Parity 0 | 1.8 | 1.1–2.4 | 0.5 | 0.02–1.1 |
| Parity 2 | 2.1 | 1.2–3.0 | 0.7 | 0.02–1.5 | |
| Parity 3 | 2.6 | 1.1–4.1 | 1.8 | 0.7–3.0 | |
| Parity 4 | −0.6 | −2.8–1.5 | 0.4 | −1.0 to 1.9 | |
| Smoker | Nonsmoker | −2.0 | −2.7 to −1.3 | −2.5 | −3.2 to −1.9 |
| Model 3 : Birthweight | |||||
| 1 week gestation | 40 GA | 3.9 | 3.5–4.3 | 3.8 | 3.4–4.1 |
| Male | Female | 4.6 | 4.0–5.2 | 4.3 | 3.8–4.8 |
| Mean height + 10 cm | 165 cm | 2.1 | 1.7–2.6 | 2.2 | 1.8–2.6 |
| Mean height + 20 cm | 4.2 | 3.3–5.2 | 4.5 | 3.7–5.3 | |
| Mean weight + 10 kg | 65 kg | 1.3 | 1.0–1.6 | 1.3 | 1.1–1.5 |
| Mean weight + 20 kg | 1.9 | 1.3–2.5 | 2.1 | 1.5–2.6 | |
| Parity 1 | Parity 0 | 3.4 | 2.7–4.0 | 3.6 | 3.1–4.2 |
| Parity 2 | 3.9 | 3.1–4.8 | 4.2 | 3.5–5.0 | |
| Parity 3 | 4.4 | 3.0–5.8 | 4.1 | 2.9–5.4 | |
| Parity 4 | 1.3 | −0.8–3.4 | 3.9 | 2.4–5.4 | |
| Smoker | Nonsmoker | −3.6 | −4.3 to −3.0 | −5.1 | −5.8 to −4.5 |
Abbreviations: CI, confidence interval; EFW, estimated fetal weight; ELFE, étude longitudinal française depuis l’enfance (French Longitudinal Study of Children); GA, gestational age; NPS, National Perinatal Survey.
The percentage changes in weight were similar after multiple imputation (Table 5).
TABLE 5.
Effect size on fetal weight and birthweight ratios in samples 1 and 2 after imputation of maternal and fetal characteristics, birthweight, estimated fetal weight and gestational age at ultrasounds and at birth
| Reference | ELFE cohort (N = 12 408) |
NPS (N = 11 464) |
|||
|---|---|---|---|---|---|
| % | 95% CI | % | 95% CI | ||
| Model 1 : EFW at second trimester | |||||
| 1 week gestation | 22 GA | 16.7 | 16.1–17.2 | ||
| Male | Female | 2.3 | 1.7–2.9 | — | — |
| Mean height + 10 cm | 165 cm | 1.5 | 1.0–2.0 | — | — |
| Mean height + 20 cm | 3.0 | 2.0–4.0 | — | — | |
| Mean weight + 10 kg | 65 kg | 0.3 | 0.0–0.6 | — | — |
| Mean weight + 20 kg | 0.3 | −0.3–1.0 | — | — | |
| Parity 1 | Parity 0 | 0.9 | 0.3–1.5 | — | — |
| Parity 2 | 0.6 | −0.2–1.5 | — | — | |
| Parity 3 | 2.1 | 0.6–3.5 | — | — | |
| Parity 4 | 2.3 | 0.1–4.5 | — | — | |
| Smoker | Nonsmoker | −0.4 | −1.1–0.4 | — | — |
| Model 2 : EFW at third trimester | |||||
| 1 week gestation | 32 GA | 9.4 | 8.9–9.9 | 9.5 | 9.0–9.9 |
| Male | Female | 1.5 | 0.9–2.0 | 2.4 | 2.0–2.9 |
| Mean height + 10 cm | 165 cm | 0.8 | 0.3–1.3 | 1.3 | 0.9–1.7 |
| Mean height + 20 cm | 1.6 | 0.6–2.5 | 2.5 | 1.7–3.3 | |
| Mean weight + 10 kg | 65 kg | 1.2 | 1.0–1.5 | 1.1 | 0.9–1.3 |
| Mean weight + 20 kg | 2.1 | 1.5–2.7 | 1.9 | 1.4–2.4 | |
| Parity 1 | Parity 0 | 1.6 | 1.0–2.2 | 0.7 | 0.2–1.2 |
| Parity 2 | 1.6 | 0.8–2.5 | 1.0 | 0.3–1.6 | |
| Parity 3 | 2.6 | 1.3–4.0 | 1.4 | 0.3–2.5 | |
| Parity 4 | 0.3 | −1.8–2.5 | 0.4 | −0.9 to 1.7 | |
| Smoker | Nonsmoker | −2.0 | −2.7 to −1.3 | −2.6 | −3.3 to −2.0 |
| Model 3 : Birthweight | |||||
| 1 week gestation | 40 GA | 3.9 | 3.6–4.2 | 4.0 | 3.7–4.4 |
| Male | Female | 4.5 | 4.1–4.9 | 4.4 | 3.9–4.8 |
| Mean height + 10 cm | 165 cm | 2.1 | 1.8–2.5 | 2.3 | 1.9–2.7 |
| Mean height + 20 cm | 4.3 | 3.6–5.0 | 4.6 | 3.8–5.4 | |
| Mean weight + 10 kg | 65 kg | 1.4 | 1.2–1.6 | 1.3 | 1.0–1.5 |
| Mean weight + 20 kg | 2.3 | 1.8–2.7 | 2.1 | 1.6–2.6 | |
| Parity 1 | Parity 0 | 3.3 | 2.8–3.8 | 3.5 | 3.0–4.0 |
| Parity 2 | 3.8 | 3.1–4.4 | 4.1 | 3.4–4.7 | |
| Parity 3 | 4.3 | 3.2–5.4 | 3.6 | 2.5–4.6 | |
| Parity 4 | 1.9 | 0.3–3.5 | 3.4 | 2.1–4.7 | |
| Smoker | Nonsmoker | −3.9 | −4.4 to −3.4 | −5.0 | −5.6 to −4.4 |
Abbreviations: CI, confidence interval; EFW, estimated fetal weight; ELFE, étude longitudinal française depuis l’enfance (French Longitudinal Study of Children); GA, gestational age; NPS, National Perinatal Survey.
3. DISCUSSION
When applied to routine clinical EFW data, the customized model based on Hadlock’s growth trajectory 20 differed from predicted and observed values at earlier GA, and the magnitude of the associations between EFW and fetal sex, maternal height and parity were less marked during pregnancy than at birth. CVs were similar across gestation, but EFW did not follow a normal distribution, leading to slight underestimation of the percentage of fetuses under the 10th percentile. These small but systematic errors raise questions about how this model performs when applied to EFW during antenatal growth screening as opposed to birthweight, which has been used for the majority of the evaluations of the model. 16 , 17 , 22
The strengths of this study are the use of two large birth samples, confirming the consistency of the results. We assessed results at two time points during pregnancy with the ELFE sample, whereas the nationally representative design of the NPS provided estimates applicable to the French population. Limitations included missing EFW data when ultrasound reports were not available in obstetrical records; however, sensitivity analyses after imputation of missing data yielded similar results. In the ELFE sample, EFW was calculated using two biometric parameters;32 in the NPS sample, EFW was abstracted from the medical files without information on the formula, although Hadlock’s three parameter formula is recommended in France. 34 , 39 Ultrasound measurements were collected retrospectively from clinical data and not a strict protocol, likely resulting in wider variability; nevertheless, this reflects the real‐life conditions in which the model is applied. Measurement errors may bias results towards the null; however, reassuringly, the 50th and 10th percentiles were concordant with French ultrasound references. A final limitation is the absence of data on ethnicity, which are included in the customized model but were not collected in France.
The model’s predicted fetal weights by GA were concordant between the two samples and close to observed values. However, they were not in line with Hadlock’s trajectory used in the customized model, which predicted slightly lower mean and 10th percentile values for EFW. These results raise questions about whether Hadlock’s growth trajectory, constructed from a sample of 392 women in the 1980s, describes fetal growth in France today. 20 Differences were more pronounced for the 10th than for the 50th percentile. The CV in our sample was 12%, which is within the range reported in the literature and used in some models 15 , 40 but larger than the 11% used in Gardosi’s model. 11 The calculation of the 10th percentile also relies on the assumption of normality, which was not verified; statistical techniques to account for skewness could improve the model’s fit.
The coefficients on maternal and fetal characteristics obtained in the birthweight models were similar for both samples and consistent with Gardosi’s model, 11 French customized charts 15 and studies from other countries. 15 , 41 One exception was the low coefficient for high parity (≥4) in ELFE, but few women were in this category. In contrast, we found an inconsistent association of fetal and maternal characteristics with EFW, with magnitudes generally less pronounced than at birth, as has been reported elsewhere for maternal height and body mass index. 21
Maternal pre‐pregnancy weight and smoking had a larger impact at birth and the third trimester, and no association was observed in the second trimester. This could be explained by the extrinsic influence of these factors, which impact the environmental conditions of the fetus rather than growth potential itself. 42 Considering the high prevalence of maternal smoking, the absence of an impact on EFW in the second trimester may lead to a slight overestimation of the model’s predicted optimal weight. In contrast, fetal sex and maternal height had varying proportional impacts but were related to EFW starting in the second trimester. This may reflect the intrinsic genetic and biologic influence of these factors on fetal growth, supported by previous studies showing an impact starting in the first trimester. 43
Our results raise questions about how the customized model performs using ultrasound data. Most evaluations of the model have compared customized and uncustomized charts using birthweight, 17 , 22 , 23 but results may differ for EFW. In particular, our analyses raise questions about whether the model accurately describes the fetal growth trajectory and percentiles at all GA. This could impact on screening and lead to under‐detection of fetuses at risk of fetal growth restriction if percentile values are too low. 22 , 44 How the differences in the impact of maternal and fetal characteristics on EFW vs birthweight affect the model are less clear but highlight the need for research to assess and refine the customized model based on its performance when applied to EFW.
4. CONCLUSION
This study raises questions about the validity of the assumptions underlying the customized growth model. Most importantly, our findings suggest that the modeled growth trajectory and, in particular, the modeled 10th percentile threshold may slightly, but systematically, underestimate true values, which would lead to under‐detection of fetuses with growth restriction. Further evaluations of the performance of the customized growth model when applied to EFW are needed given the intended use of the customized charts for growth monitoring during pregnancy.
CONFLICT OF INTEREST
None.
AUTHOR CONTRIBUTIONS
AH and JZ had full access to all of the data in the study and take responsibility for the integrity of the data and the accuracy of the data analysis. Study concept and design: JZ, AH, IM, BH, BB, MND. Acquisition, analysis, or interpretation of data: JZ, AH, IM, BH, BB, MND. Drafting of the manuscript; AH, JZ. Critical revision of the manuscript for important intellectual content and approval of final version of the manuscript: JZ, AH, IM, BH, BB, NMD. Statistical analysis: JZ, AH, IM, BH.
Supporting information
Table S1 Comparison between cases included in the study and those excluded for missing data on customization and ultrasound scans for the ELFE sample. ELFE: étude longitudinal française depuis l’enfance (French Longitudinal Study of Children).
Table S2 Comparison between cases included in the study and those excluded for missing data on customization and ultrasound scans for the National Perinatal Survey.
Figure S1 Flow chart for the study populations.
Figure S2 Observed medians and tenth percentiles estimated fetal weight in the ELFE cohort and the NPS, and French references. ELFE: étude longitudinal française depuis l’enfance (French Longitudinal Study of Children); NPS: national perinatal survey.
Hocquette AP, Monier I, Blondel B, Dufourg M‐N, Heude B, Zeitlin J. Testing the assumptions of customized intrauterine growth charts using national birth studies. Acta Obstet Gynecol Scand. 2022;101:405–416. doi: 10.1111/aogs.14335
REFERENCES
- 1. Gardosi J, Madurasinghe V, Williams M, Malik A, Francis A. Maternal and fetal risk factors for stillbirth: Population based study. BMJ. 2013. Jan;24(346):f108. [DOI] [PMC free article] [PubMed] [Google Scholar]
- 2. Baschat AA, Viscardi RM, Hussey‐Gardner B, Hashmi N, Harman C. Infant neurodevelopment following fetal growth restriction: Relationship with antepartum surveillance parameters. Ultrasound Obstet Gynecol. 2009;33:44‐50. [DOI] [PubMed] [Google Scholar]
- 3. Flenady V, Koopmans L, Middleton P, et al. Major risk factors for stillbirth in high‐income countries: A systematic review and meta‐analysis. Lancet. 2011;377:1331‐1340. [DOI] [PubMed] [Google Scholar]
- 4. Boers KE, Vijgen SMC, Bijlenga D, et al. Induction versus expectant monitoring for intrauterine growth restriction at term: Randomised equivalence trial (DIGITAT). BMJ. 2010;341:c7087. [DOI] [PMC free article] [PubMed] [Google Scholar]
- 5. Ganzevoort W, Mensing Van Charante N, Thilaganathan B, et al. How to monitor pregnancies complicated by fetal growth restriction and delivery before 32 weeks: post‐hoc analysis of TRUFFLE study. Ultrasound Obstet Gynecol. 2017;49:769‐777. [DOI] [PubMed] [Google Scholar]
- 6. Ego A, Monier I, Skaare K, Zeitlin J. Antenatal detection of fetal growth restriction and risk of stillbirth: Population‐based case‐control study. Ultrasound Obstet Gynecol Off J Int Soc Ultrasound Obstet Gynecol. 2020;55:613‐620. [DOI] [PubMed] [Google Scholar]
- 7. Ego A. Définitions: Petit poids pour l’âge gestationnel et retard de croissance intra‐utérin. [Definitions: Small for gestational age and intrauterine growth retardation]. In French. J Gynecol Obstet Biol Reprod. 2013;42:872‐894. [DOI] [PubMed] [Google Scholar]
- 8. McCowan LM, Figueras F, Anderson NH. Evidence‐based national guidelines for the management of suspected fetal growth restriction: Comparison, consensus, and controversy. Am J Obstet Gynecol. 2018;218:S855‐S868. [DOI] [PubMed] [Google Scholar]
- 9. Fetal Growth Restriction . ACOG practice bulletin, number 227. Obstet Gynecol. 2021;137:e16‐e28. [DOI] [PubMed] [Google Scholar]
- 10. Melamed N, Baschat A, Yinon Y, et al. FIGO (international Federation of Gynecology and obstetrics) initiative on fetal growth: Best practice advice for screening, diagnosis, and management of fetal growth restriction. Int J Gynaecol Obstet. 2021;152(Suppl 1):3‐57. [DOI] [PMC free article] [PubMed] [Google Scholar]
- 11. Gardosi J, Mongelli M, Wilcox M, Chang A. An adjustable fetal weight standard. Ultrasound Obstet Gynecol. 1995;6:168‐174. [DOI] [PubMed] [Google Scholar]
- 12. Ay L, Kruithof CJ, Bakker R, et al. Maternal anthropometrics are associated with fetal size in different periods of pregnancy and at birth. The Generation R Study. BJOG. 2009;116(7):953‐963. [DOI] [PubMed] [Google Scholar]
- 13. Drooger JC, Troe JW, Borsboom GJ, et al. Ethnic differences in prenatal growth and the association with maternal and fetal characteristics. Ultrasound Obstet Gynecol. 2005;26:115‐122. [DOI] [PubMed] [Google Scholar]
- 14. Bromley B, Frigoletto FD Jr, Harlow BL, Evans JK, Benacerraf BR. Biometric measurements of fetuses of different race and gender. Ultrasound Obstet Gynecol. 1993;3:395‐402. [DOI] [PubMed] [Google Scholar]
- 15. Ego A, Prunet C, Lebreton E, et al. Courbes de croissance in utero ajustées et non ajustées adaptées à la population française. I — Méthodes de construction. J Gynecol Obstet Biol Reprod. 2015;45:165‐176. [DOI] [PubMed] [Google Scholar]
- 16. Ego A, Subtil D, Grange G, et al. Customized versus population‐based birth weight standards for identifying growth restricted infants. Am J Obstet Gynecol. 2006;194:1042‐1049. [DOI] [PubMed] [Google Scholar]
- 17. Cha H‐H, Lee S‐H, Park J‐S, et al. Comparison of perinatal outcomes in small‐for‐gestational‐age infants classified by population‐based versus customised birth weight standards. Aust N Z J Obstet Gynaecol. 2012;52:348‐355. [DOI] [PubMed] [Google Scholar]
- 18. Gardosi J, Francis A, Turner S, Williams M. Customized growth charts: Rationale, validation and clinical benefits. Am J Obstet Gynecol. 2018;218:S609‐S618. [DOI] [PubMed] [Google Scholar]
- 19. Hutcheon JA, Walker M, Platt RW. Assessing the value of customized birth weight percentiles. Am J Epidemiol. 2011;173:459‐467. [DOI] [PubMed] [Google Scholar]
- 20. Hadlock FP, Harrist RB, Martinez‐Poyer J. In utero analysis of fetal growth a sonographic weight standard. Radiology. 1991;181:129‐133. [DOI] [PubMed] [Google Scholar]
- 21. Albouy‐Llaty M, Thiebaugeorges O, Goua V, et al. Influence of fetal and parental factors on intrauterine growth measurements: Results of the EDEN mother–child cohort. Ultrasound Obstet Gynecol. 2011;38:673‐680. [DOI] [PubMed] [Google Scholar]
- 22. Clausson B, Gardosi J, Francis A, Cnattingius S. Perinatal outcome in SGA births defined by customised versus population‐based birthweight standards. BJOG. 2001;108:830‐834. [DOI] [PubMed] [Google Scholar]
- 23. Costantine MM, Mele L, Landon MB, et al. Customized versus population approach for evaluation of fetal overgrowth. Am J Perinatol. 2013;30:565‐572. [DOI] [PMC free article] [PubMed] [Google Scholar]
- 24. Odibo AO, Nwabuobi C, Odibo L, Leavitt K, Obican S, Tuuli MG. Customized fetal growth standard compared with the INTERGROWTH‐21st century standard at predicting small‐for‐gestational‐age neonates. Acta Obstet Gynecol Scand. 2018;97:1381‐1387. [DOI] [PubMed] [Google Scholar]
- 25. Morales‐Roselló J, Cañada Martínez AJ, Scarinci E, Perales Marín A. Comparison of cerebroplacental ratio, Intergrowth‐21st standards, customized growth, and local population references for the prediction of fetal compromise: Which is the best approach? Fetal Diagn Ther. 2019;46:341‐352. [DOI] [PubMed] [Google Scholar]
- 26. Savirón‐Cornudella R, Esteban LM, Tajada‐Duaso M, et al. Detection of adverse perinatal outcomes at term delivery using ultrasound estimated percentile weight at 35 weeks of gestation: Comparison of five fetal growth standards. Fetal Diagn Ther. 2020;47:104‐114. [DOI] [PubMed] [Google Scholar]
- 27. Vandentorren S, Bois C, Pirus C, Sarter H, Salines G, Leridon H. Rationales, design and recruitment for the Elfe longitudinal study. BMC Pediatr. 2009;9:58. [DOI] [PMC free article] [PubMed] [Google Scholar]
- 28. Charles MA, Thierry X, Lanoe J‐L, et al. Cohort profile: The French national cohort of children ELFE: Birth to 5 years. Int J Epidemiol. 2019;49:368‐369. [DOI] [PMC free article] [PubMed] [Google Scholar]
- 29. Blondel B, Coulm B, Bonnet C, Goffinet F, Le Ray C, National Coordination Group of the National Perinatal Surveys . Trends in perinatal health in metropolitan France from 1995 to 2016: results from the French National Perinatal Surveys. J Gynecol Obstet Hum Reprod. 2017;46:701‐713. [DOI] [PubMed] [Google Scholar]
- 30. Comite National Technique De L’echographie De Depistage Prenatal . Rapport du Comité National Technique de l’Echographie de Dépistage Prénatal [Report of the National Technical Committee for Prenatal Screening Ultrasound].In French. Internet 2005 [cited 2019 Mar 12]. Available from: http://www.cfef.org/archives/lettres/DocusCTE/rapportCTE.pdf
- 31. Salomon LJ. Comment déterminer la date de début de grossesse ? [How to date pregnancy?]. In French. J Gynecol Obstet Biol Reprod. 2011;40:726‐733. [DOI] [PubMed] [Google Scholar]
- 32. Hadlock FP, Harrist RB, Sharman RS, Deter RL, Park SK. Estimation of fetal weight with the use of head, body and femur measurements ‐ a prospective study. Am J Obstet Gynecol. 1985;151:333‐337. [DOI] [PubMed] [Google Scholar]
- 33. Collège Français d’échographie Fœtale Cfef . Compte rendu du séminaire de travail du Collège français d’échographie fœtal (CFEF) sur les référentiels et standards de biométrie fœtale. Juin 2017. [Report from the CFEF seminar on fetal biometry (June 2017)]. In French. Gynecol Obstet Fertil Senol. 2017;45:545‐551. [DOI] [PubMed] [Google Scholar]
- 34. Massoud M, Duyme M, Fontanges M, Combourieu D. [Chart for estimation of fetal weight 2014 by the French College of Fetal Sonography (CFEF)]. J Gynecol Obstet Biol Reprod. 2016;45(1):80‐85. [DOI] [PubMed] [Google Scholar]
- 35. Feltz CJ, Miller GE. An asymptotic test for the equality of coefficients of variation from K populations. Stat Med. 1996;15:647‐658. [DOI] [PubMed] [Google Scholar]
- 36. StataCorp . Stata statistical software: Release 14. StataCorp LP; 2015. [Google Scholar]
- 37. White IR, Royston P, Wood AM. Multiple imputation using chained equations: Issues and guidance for practice. Stat Med. 2011;30:377‐399. [DOI] [PubMed] [Google Scholar]
- 38. Graham JW, Olchowski AE, Gilreath TD. How many imputations are really needed? Some practical clarifications of multiple imputation theory. Prev Sci. 2007;8:206‐213. [DOI] [PubMed] [Google Scholar]
- 39. Vayssière C, Sentilhes L, Ego A, et al. Fetal growth restriction and intra‐uterine growth restriction: Guidelines for clinical practice from the French College of Gynaecologists and Obstetricians. Eur J Obstet Gynecol Reprod Biol. 2015;193:10‐18. [DOI] [PubMed] [Google Scholar]
- 40. Premru‐Srsen T, Verdenik I, Mihevc Ponikvar B, Hugh O, Francis A, Gardosi J. Customised birthweight standard for a Slovenian population. J Perinat Med. 2019;47:270‐275. [DOI] [PubMed] [Google Scholar]
- 41. Gibbons KS, Chang AMZ, Flenady VJ, et al. A test of agreement of customised birthweight models. Paediatr Perinat Epidemiol. 2013;27:131‐137. [DOI] [PubMed] [Google Scholar]
- 42. Gressens P, Laudenbach V, Marret S. Les mécanismes d’action du tabac Sur le cerveau en développement. [Mechanisms of action of tobacco smoke on the developing brain]. In French.. J Gynecol Obstet Biol Reprod 2003;32:1S30‐1S32. [PubMed] [Google Scholar]
- 43. Pölzlberger E, Hartmann B, Hafner E, Stümpflein I, Kirchengast S. Maternal height and pre‐pregnancy weight status are associated with fetal growth patterns and newborn size. J Biosoc Sci. 2017;49:392‐407. [DOI] [PubMed] [Google Scholar]
- 44. Owen P, Ogah J, Bachmann LM, Khan KS. Prediction of intrauterine growth restriction with customised estimated fetal weight centiles. BJOG. 2003;110:411‐415. [PubMed] [Google Scholar]
Associated Data
This section collects any data citations, data availability statements, or supplementary materials included in this article.
Supplementary Materials
Table S1 Comparison between cases included in the study and those excluded for missing data on customization and ultrasound scans for the ELFE sample. ELFE: étude longitudinal française depuis l’enfance (French Longitudinal Study of Children).
Table S2 Comparison between cases included in the study and those excluded for missing data on customization and ultrasound scans for the National Perinatal Survey.
Figure S1 Flow chart for the study populations.
Figure S2 Observed medians and tenth percentiles estimated fetal weight in the ELFE cohort and the NPS, and French references. ELFE: étude longitudinal française depuis l’enfance (French Longitudinal Study of Children); NPS: national perinatal survey.