

Abstract
Introduction
Childbirth experience is an increasingly recognized and important measure of quality of obstetric care. Previous research has shown that it can be affected by intrapartum care and how labor is followed. A partograph is recommended to follow labor progression by recording cervical dilation over time. There are currently different guidelines in use worldwide to follow labor progression. The two main ones are the partograph recommended by the World Health Organization (WHO) based on the work of Friedman and Philpott and a guideline based on Zhang’s research. In our study we assessed the effect of adhering to Zhang’s guideline or the WHO partograph on childbirth experience. Zhang’s guideline describes expected normal labor progression based on data from contemporary obstetric populations, resulting in an exponential progression curve, compared with the linear WHO partograph. The choice of labor curve affects the intrapartum follow‐up of women and this could potentially affect childbirth experience.
Material and methods
The Labor Progression Study (LaPS) study was a prospective, cluster randomized controlled trial conducted at 14 birth centers in Norway. Birth centers were randomized to either follow Zhang’s guideline or the WHO partograph. Nulliparous women in active labor, with one fetus in cephalic presentation at term and spontaneous labor onset were included. At 4 weeks postpartum, included women received an online login to complete the Childbirth Experience Questionnaire (CEQ). Total score on the CEQ, the four domain scores on the CEQ, and scores on the individual items on the CEQ were compared between the two groups.
Results
There were 1855 women in the Zhang group and 1749 women in the WHO partograph group. There was no difference in the total or domain CEQ scores between the two groups. We found statistically significant differences for two individual items; women in the Zhang group scored lower on positive memories and feeling of control.
Conclusions
Based on our findings on childbirth experience there is no reason to prefer Zhang’s guideline over the WHO partograph.
Keywords: childbirth experience, labor progression, obstetric, WHO partograph, Zhang’s guideline
Abbreviations
- BMI
body mass index
- CEQ
Childbirth Experience Questionnaire
- CI
confidence interval
- LaPS
Labor Progression Study
- OR
odds ratio
- RM
ratios of means
- WHO
World Health Organization
Key message.
Childbirth experience was compared in women following the WHO partograph or Zhang’s guideline for labor progression. Childbirth experience was not significantly different between these groups. Type of partograph used to follow labor progression did not affect childbirth experience.
1. INTRODUCTION
Intrapartum care for a positive childbirth experience, published in 2018 by the World Health Organization (WHO), emphasizes the importance of a positive childbirth experience and has identified important knowledge gaps regarding progress of labor and care throughout labor and birth. 1 Childbirth experience may have immediate as well as long‐term positive or negative effects on well‐being and health. A positive childbirth experience might contribute to an increase in vaginal deliveries, whereas negative experience can contribute to future fear of giving birth. A systematic review confirms the impact of a negative childbirth experience on subsequent reproductive decisions. It is associated with not having another child, delaying the birth of a subsequent child and a preference for cesarean section in subsequent pregnancies. 2 , 3 One of the factors that influences childbirth, and probably childbirth experience, is how labor progression is monitored. 4 Friedman pioneered research in labor progression by graphically describing the cervical dilation over time. 5 Based on this concept, Philpott developed guidelines for graphically assessing labor progression constructing the partograph in 1972. 6 , 7 In 1994, their work became the basis of the WHO partograph that have been used worldwide since. 8 At the start of active labor, a timeline is placed on the woman’s partograph. The linear curve of expected labor progression is constant throughout labor and serves as a reference point for labor dystocia. Due to changes in clinical practices and obstetric populations during the past decades, the use of the WHO partograph in contemporary obstetric populations has been questioned. 9 The guidelines were thought to overestimate the expected speed of cervical dilation compared with the physiological rate in current obstetric populations, thus leading to increased interventions and intrapartum cesarean section rates. 9 In 2010, Zhang et al. presented a labor curve based on a large contemporary cohort. 10 They found an initial slower labor progression pattern that followed an exponential curve and did not find the previously described deceleration phase. Zhang’s approach calls for an evaluation of the woman throughout labor based on her current cervical status, and thus seems to follow labor physiology more than the previously established linear cut‐offs. A recent Cochrane review concludes that there is no consensus concerning which partograph is most beneficial or optimal. 11 Recently, the mathematical methods used by Zhang have been criticized for not being appropriate for describing labor progression data. 12 The WHO requested more studies to fill the knowledge gaps regarding labor progression management. The Labor Progression Study (LaPS) was conducted as the first randomized controlled trial to investigate maternal and neonatal clinical consequences of using a guideline based on Zhang’s normal labor curve compared with the WHO partograph that was recommended between 1997 and 2020. 13 , 14 The Childbirth Experience Questionnaire (CEQ) is developed to assess the multidimensional nature of women’s childbirth experience. 15 This instrument is thoroughly validated, and easily converted to Norwegian, as it was originally developed in Swedish. An optimal tool for assessing labor dystocia may be an important factor in improving childbirth experience, as both unnecessary intervention and failure to take action in prolonged labor may affect childbirth experience. The present study, the LaPS CEQ, is conducted to assess the effect of adhering to Zhang's guideline vs the WHO partograph on childbirth experience. We hypothesized that the use of Zhang’s guideline would improve childbirth experience as it follows the physiological labor curve and evaluates the woman’s progression individually throughout labor. Information on this aspect of obstetric care can help guide recommendations in the ongoing discussion on which partograph is the most beneficial to use.
2. MATERIAL AND METHODS
LaPS, a cluster randomized controlled multicenter study, was conducted in 14 birth centers in Norway between 1 December 2014 and 31 January 2017. Centers with more than 500 deliveries per year were eligible for inclusion and were stratified according to number of deliveries and intrapartum cesarean section rate. Based on mathematical calculations, Zhang presented expected time intervals from one integer centimeter to the next in active labor. 10 Women who had a progression slower than the 95th percentile of Zhang’s defined normal labor curve were diagnosed with labor dystocia. This labor progression assessment tool is denoted as Zhang’s guideline in the LaPS study. The birth centers were randomized to either follow Zhang’s guideline or the WHO partograph, as recommended at the time of the study (WHO 1997–2020). The study randomized birth centers with respect to guidelines assessing labor dystocia. Once diagnosed, labor dystocia was treated according to national best practice guidelines. Nulliparous women in active labor were enrolled in the study if they had a single fetus in cephalic presentation at term, had a spontaneous labor start and could understand and read Norwegian. Upon inclusion women consented to supplying their sociodemographic characteristics as well as labor data. Women were asked to enter a valid email address on the consent form, in order to receive an online login ID to answer questions about their birth experience, 4 weeks postpartum. The CEQ version 1 was used to measure childbirth experience. 15 The CEQ was developed and validated in Sweden. 15 The CEQ questionnaire was translated from Swedish to Norwegian according to the good practice for translation and cultural adaptation process for patient‐reported outcomes. 16 The CEQ consists of 22 items related to childbirth experience, which are categorized into four domains: own capacity, professional support, perceived safety and participation. The first 19 items are to be answered on a four‐point Likert scale from 1 to 4, with category 1 denoting a total agreement and category 4 a total disagreement with the statement. Three items are to be answered on a numerical rating scale with scores 0–100, categorized as 1 (0–40), 2 (41–60), 3 (61–80) and 4 (81–100). The total CEQ score is the mean score of all the items and ranges from 1 to 4. In our analyses, this was rescaled to a scoring range of 0 to 100. Domain scores are calculated as means of included items. We compared the total CEQ scores, as well as scores for all four domains and all of the individual items between the two groups. A web‐based version of the CEQ was developed at the Department for Research Computing, USIT University of Oslo, Norway, approved by the developer of this instrument and used in this study. Data were stored at the Services for Sensitive Research Data at the Department for Research Computing, USIT University of Oslo.
The core outcome set of the LaPS study, evaluating the use of Zhang’s guideline vs the WHO partograph was recording obstetric and neonatal outcomes, as well as childbirth experience measured by the CEQ questionnaire. Comparisons of obstetric and neonatal outcomes between the two groups have been published separately. 13
2.1. Statistical analyses
Descriptive statistics are given as means and standard deviations for continuous variables and as counts and percentages for categorical variables. Total CEQ scores and subscale scores were compared between groups by means of generalized linear models with a log link (ie Poisson regression), from which we present estimated ratios of means with 95% confidence intervals (CI) based on robust (sandwich) standard errors, and with p‐values from Wald tests. Clustering within hospitals was allowed for by including a random intercept term. Since these outcomes were left‐skewed, they were reversed before analysis, so that high scores are interpretable as high dissatisfaction/negative experiences. Individual item scores were compared using ordered logistic regression, from which we present estimated odds ratios with 95% CI and p‐values from Wald tests, applying cluster‐robust standard errors. Descriptive statistics were assessed using SPSS 26.0.0.1 (IBM Corp.). All regression analyses were performed in STATA v. 16.1 with functions mepoisson and ologit. To allow for multiplicity, only p‐values <0.01 were considered statistically significant.
2.1.1. Ethical approval
The study protocol was approved by the Regional Committee for Medical and Health Research Ethics on 11 December 2013 in line with the revised Declaration of Helsinki (2013/1862/REK Sør‐Øst) and published.14 The LaPS Study is registered with the ClinicalTrials.gov, registration number NCT02221427 on 20 August 2014. Initial participant enrolment was on 1 December 2014.
3. RESULTS
A total of 7277 women participated in the LaPS. There was no significant difference in intrapartum cesarean section rate between the two guideline groups. In the LaPS CEQ study, 5810 women were invited to participate, of whom 3652 answered the questionnaire, a 62.9% response rate. We removed 48 cases due to incorrect identification numbers, leaving 3604 cases for statistical analysis (Figure 1). Questionnaires were sent out automatically 4 weeks after inclusion, and 1541 (43.5%) participants answered it the same day. 1411 (39.3%) of participants sent their answers back within a week, and 509 (14.4%) participants within a month. Another 71 answers came in in the next 8 months, for the remaining 72 women this information is not registered. Sociodemographic characteristics of women in the two groups were similar to each other, with the exception of relationship status (Table 1). There were a greater number of single mothers in the Zhang group. We also compared our responder cohort (n = 3652) with the non‐responder group (n = 3625), and found that the sociodemographic characteristics of these two groups did not differ significantly. We have also compared the frequency of intrapartum C‐sections, vacuum deliveries and postpartum hemorrhage over 1000 mL between our responder cohort and the non‐responder group, and found no significant differences (Tables S1 and S2).
FIGURE 1.
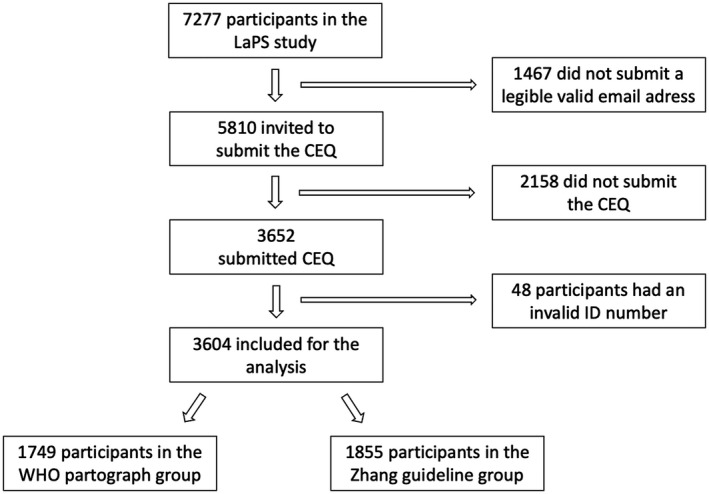
Overview of the inclusion of the Labor Progression Study Childbirth Experience Questionnaire participants
TABLE 1.
Sociodemographic characteristics of women in the Labor Progression Study Childbirth Experience Questionnaire compared between those randomized to the Zhang and those randomized to the WHO group
| Zhang | WHO | |
|---|---|---|
| Age a | 27.6 (4.5) | 27.7 (4.5) |
| Age groups (years) | ||
| <25 | 460 (24.8) | 419 (24.0) |
| 25–35 | 1249 (67.3) | 1208 (69.1) |
| >35 | 146 (7.9) | 122 (7.0) |
| Relationship status | ||
| Single | 112 (6.0) | 62 (3.5) |
| Cohabitant | 1159 (62.5) | 1269 (72.6) |
| Married | 577 (31.1) | 403 (23.0) |
| Other | 7 (0.4) | 15 (0.9) |
| Education | ||
| Elementary school | 89 (4.8) | 69 (3.9) |
| High school | 635 (34.2) | 607 (34.7) |
| Higher education ≥12 years | 1131 (61.0) | 1073 (61.3) |
| Smoking first trimester | 106 (5.7) | 96 (5.6) |
| BMI b | 23.6 (4.3) | 23.7 (4.2) |
| BMI groups | ||
| <18.5 | 75 (4.0) | 74 (4.3) |
| 18.5–24.9 | 1264 (68.3) | 1155 (66.3) |
| 25.0–29.9 | 359 (19.4) | 369 (21.2) |
| ≥30.0 | 154 (8.3) | 143 (8.2) |
| Gestational age at onset of labor c | 281.3 (7.7) | 281.2 (7.4) |
Total n = 3604. Results presented as n (%) unless where otherwise indicated.
Abbreviations: BMI, body mass index; WHO, World Health Organization.
Mean maternal age in years (standard deviation).
Mean prepregnancy BMI in kg/m2 (standard deviation).
Mean gestational age at onset of labor in days (standard deviation).
The mean for the CEQ total score and the means for the four domains were comparable between the groups, and we found no statistically significant differences (Table 2). When we compared the odds for higher levels of satisfaction on the individual items of the CEQ, women in the Zhang group scored significantly lower on positive memories and feeling of control (Table 3). Adjustment for relationship status did not change the estimated differences between the groups to any substantial degree for the findings reported in Tables 2 and 3.
TABLE 2.
Comparison of total and sub scale Childbirth Experience Questionnaire (CEQ) scores between the Zhang and the WHO groups
| CEQ score | Mean score Zhang | Mean score WHO | RM (95% CI) | p |
|---|---|---|---|---|
| Total | 69.5 | 70.0 | 1.00 (0.97–1.04) | 0.80 |
| Domains | ||||
| Own capacity | 49.2 | 50.0 | 1.01 (0.97–1.04) | 0.67 |
| Professional support | 89.3 | 89.3 | 0.98 (0.89–1.08) | 0.69 |
| Perceived safety | 75.0 | 75.6 | 1.01 (0.95–1.07) | 0.84 |
| Participation | 78.9 | 80.0 | 1.01 (0.96–1.06) | 0.81 |
Results from regression analysis. Absolute scores were converted to a scale 1–100 for comparability. Ratios of means (RM) with 95% confidence intervals (CI). An RM > 1 indicates that the women in the Zhang group were less satisfied than the women in the WHO group. Total n = 3604: 1749 in the Zhang group, 1855 in the WHO group.
Abbreviations: CEQ, Childbirth Experience Questionnaire; WHO, World Health Organization.
TABLE 3.
Comparison of single item Childbirth Experience Questionnaire (CEQ) scores between women in the Zhang and the WHO groups
| CEQ item | OR (95% CI) | p |
|---|---|---|
| Labor and birth went as I had expected | 0.90 (0.78–1.05) | 0.17 |
| I felt strong during labor and birth | 0.96 (0.79–1.17) | 0.72 |
| I felt scared during labor and birth | 1.00 (0.92–1.08) | 0.90 |
| I felt capable during labor and birth | 0.99 (0.88–1.12) | 0.92 |
| I was tired during labor and birth | 0.96 (0.82–1.13) | 0.64 |
| I felt happy during labor and birth | 0.94 (0.88–1.01) | 0.11 |
| I have many positive memories from childbirth | 0.89 (0.82–0.97) | 0.005 |
| I have many negative memories from childbirth | 0.96 (0.85–1.08) | 0.48 |
| Some of my memories from childbirth make me feel depressed | 1.02 (0.87–1.20) | 0.80 |
| I felt I had a say whether I could be up and about or lie down | 0.97 (0.86–1.09) | 0.59 |
| I felt I had a say in deciding my birthing position | 0.96 0.91–1.02) | 0.20 |
| I felt I had a say in the choice of pain relief | 0.98 (0.89–1.07) | 0.59 |
| My midwife devoted enough time to me | 0.90 (0.78–1.04) | 0.14 |
| My midwife devoted enough time to my partner | 0.94 (0.80–1.11) | 0.49 |
| My midwife kept me informed about what was happening during labor and birth | 1.02 (0.90–1.17) | 0.74 |
| My midwife understood my needs | 0.96 (0.85–1.09) | 0.56 |
| I felt very well cared for by my midwife | 0.97 (0.81–1.16) | 0.73 |
| My impression of the team`s medical skills made me feel secure | 0.99 (0.79–1.24) | 0.93 |
| I felt that I handled the situation well | 0.94 (0.84–1.06) | 0.34 |
| As a whole, how painful did you feel childbirth was? | 1.02 (0.86–1.19) | 0.86 |
| As a whole, how much control did you feel you had during childbirth? | 0.87 (0.78–0.96) | 0.007 |
| As a whole, how secure did you feel during childbirth? | 0.95 (0.85–1.06) | 0.33 |
Results from regression analysis. Group differences assessed in ordered logistic regression models with cluster‐robust standard errors. We present odds ratios (OR) with 95% confidence intervals (CI). OR > 1 indicates that the Zhang group had higher odds of responses indicating a more positive birth experience compared with the WHO group. Total n = 3604: 1749 in the Zhang group, 1855 in the WHO group.
Abbreviations: CEQ, Childbirth Experience Questionnaire; WHO, World Health Organization.
4. DISCUSSION
We found no difference in the total and domain CEQ scores for women in the Zhang vs the WHO group. Women allocated to use Zhang’s guideline scored lower on positive memories and feeling of control during childbirth than women allocated to use the WHO partograph, and the differences between the two groups were statistically significant. Both of these items are on the perceived safety subscale. Women in our study reported overall good birth experience.
Previous studies show that cesarean section and instrumental delivery rates, as well as medical interventions and adverse neonatal outcomes, all influence childbirth experience. These factors were all primary and secondary outcomes in the LaPS study, and their occurrence did not differ significantly between the two guideline groups. 13 , 17 , 18 , 19 This can explain the similarities in childbirth experience we found between the groups. However, we also found differences that could be clinically relevant. An experienced level of control during labor has previously been described as an important factor of determining childbirth experience, 20 and we found this parameter to be significantly better for women in the WHO group compared with the Zhang group. One possible explanation is that Zhang’s partograph allows longer time intervals between vaginal examinations before 6 cm of dilation. Thus, women possibly receive less attention and less contact with midwives in this part of labor. There are positive sides to limiting the number of vaginal examinations, yet women may feel less cared for in this scenario, especially if they later experience labor dystocia. Furthermore, following the WHO partograph, women with labor dystocia will cross an alert line prior to crossing the action line. This means intensified follow‐up and care at an earlier point in time, as well as earlier warning of possible upcoming labor dystocia. The woman may in this scenario have time to prepare mentally for labor dystocia and its consequences. Women following Zhang’s guideline are diagnosed with labor dystocia without previous warning, when reaching a pre‐set point in time. This may lead to the labor quite suddenly becoming reclassified as pathological, thus reducing the sense of control. Less sense of control in turn can also lead to less positive memories from the labor and delivery process. Labor duration has also been indicated to influence childbirth experience. 21 , 22 , 23 A Swedish study found that prolonged labor is independently associated with worsening women’s childbirth experience. A Danish study found that women who were in labor for less than 12 hours scored higher on all dimensions of the CEQ. 24 In the LaPS study, women in the Zhang group had significantly longer overall duration of labor by 0.84 h difference in median. The first stage was longer by 0.66 h, as well as the second stage by 0.18 h in the Zhang group. 25 We cannot rule out an association between duration of labor and childbirth experience in our study.
Our study contributes important information to the ongoing discussion on which partograph is most beneficial to use. Our results support the previous notion that differences that are found in description of the normal labor curve may be merely methodological, and that finding and testing the most optimal partograph should be the primary aim of research. 26 , 27 The comparison that our study made was between Zhang’s guideline and the WHO partograph in clinical use on nulliparous women. Although these partographs are constructed from available cervical dilation and time data differently, the most important difference between these two guidelines is how they define labor dystocia: Zhang’s guideline defines pathology at the 95th centile, while the WHO partograph defined pathology at the 90th centile. It is plausible that the two study groups are actually quite similar, but can have some differences in labor management that affect some aspects of perceived safety in a woman’s birth experience.
Strengths of our study include its size, the randomization and the careful patient selection, including only nulliparous women, which reduces the risk of type 1 error and confounding bias. Another strength is that women were asked to report their childbirth experience 4 weeks postpartum: a point in time when the new mothers are settled into their new roles, have a little distance from labor and delivery, but close enough to still have detailed memory of it. In all, 82.8% of our responders sent in their answers within a week. However, this can also be viewed as a weakness of the study. Previous research has shown that childbirth experience of women can change over time, both for the positive and the negative, 28 , 29 , 30 and the optimal point in time for measuring childbirth experience remains unknown. Another weakness of our study is the relatively low response rate. Furthermore, looking at differences between the groups at the level of individual questions on a questionnaire amounts to multiple hypothesis testing, with the associated risk for incidental findings. This was addressed by lowering the significance level to 0.01, thus lowering the risk for type 1 error.
5. CONCLUSION
Overall score and the four domains of childbirth experience did not show significant differences between women in the Zhang guideline or the WHO partograph group. Women in the Zhang group scored significantly lower on positive memories and feeling of control.
Based on our findings on childbirth experience there is no reason to prefer Zhang’s guideline over the WHO partograph. Childbirth experience is an important perinatal outcome, and further research is needed to identify measures to improve it.
AUTHOR CONTRIBUTIONS
All authors interpreted the data. All authors contributed to the manuscript and approved the final version, and accept responsibility for the paper as published. DR took part in writing the protocol, data collection, data acquisition, data analysis and the writing of the paper. RD took part in the study design, data collection and the writing of the paper. SB initiated the trial, took part in the study design, writing the protocol, data collection and the writing of the paper. EB initiated the trial, took part in the study design, data collection, and the writing of the paper. ID did the statistical analysis and took part in the writing of the paper. GSB gave input to the analysis and took part in the writing of the paper. TME took part in data collection and the writing of the paper. PØ initiated the trial, took part in the study design, data collection and the writing of the paper. RKS took part in writing the protocol, the data analysis and the writing of the paper.
Supporting information
Table S1
Table S2
Rozsa DJ, Dalbye R, Bernitz S, et al. The effect of Zhang’s guideline vs the WHO partograph on childbirth experience measured by the Childbirth Experience Questionnaire in the Labor Progression Study (LaPS): A cluster randomized trial. Acta Obstet Gynecol Scand. 2022;101:193–199. doi: 10.1111/aogs.14298
Funding information
Sykehuset Østfold Hospital Trust (Grant AB3293), University of Stavanger (Grant HV‐AOE30087843).
REFERENCES
- 1. WHO . WHO recommendations: intrapartum care for a positive childbirth experience 2018. Accessed March 1, 2020. http://apps.WHO.int/iris/bitstream/handle/10665/260178/9789241550215‐eng.pdf;jsessionid=F1F5397399F448885328491174AC61C6?sequence=1 [PubMed]
- 2. Shorey S, Yang YY, Ang E. The impact of negative childbirth experience on future reproductive decisions: a quantitative systematic review. J Adv Nurs. 2018;74:1236‐1244. [DOI] [PubMed] [Google Scholar]
- 3. Pang MW, Leung TN, Lau TK, Hang Chung TK. Impact of first childbirth on changes in women's preference for mode of delivery: follow‐up of a longitudinal observational study. Birth. 2008;35:121‐128. [DOI] [PubMed] [Google Scholar]
- 4. Waldenstrom U, Rudman A, Hildingsson I. Intrapartum and postpartum care in Sweden: women's opinions and risk factors for not being satisfied. Acta Obstet Gynecol Scand. 2006;85:551‐560. [DOI] [PubMed] [Google Scholar]
- 5. Friedman E. The graphic analysis of labor. Am J Obstet Gynecol. 1954;68:1568‐1575. [DOI] [PubMed] [Google Scholar]
- 6. Philpott RH, Castle WM. Cervicographs in the management of labour in primigravidae. I. The alert line for detecting abnormal labour. J Obstet Gynaecol Br Commonw. 1972;79:592‐598. [DOI] [PubMed] [Google Scholar]
- 7. Philpott RH, Castle WM. Cervicographs in the management of labour in primigravidae. II. The action line and treatment of abnormal labour. J Obstet Gynaecol Br Commonw. 1972;79:599‐602. [DOI] [PubMed] [Google Scholar]
- 8. World Health Organization . World Health Organization partograph in management of labour. Maternal Health and Safe Motherhood Programme. Lancet. 1994;1994:1399‐1404. [PubMed] [Google Scholar]
- 9. Zhang J, Troendle JF, Yancey MK. Reassessing the labor curve in nulliparous women. Am J Obstet Gynecol. 2002;187:824‐828. [DOI] [PubMed] [Google Scholar]
- 10. Zhang J, Landy HJ, Ware Branch D, et al. Contemporary patterns of spontaneous labor with normal neonatal outcomes. Obstet Gynecol. 2010;116:1281‐1287. [DOI] [PMC free article] [PubMed] [Google Scholar]
- 11. Lavender T, Cuthbert A, Smyth RM. Effect of partograph use on outcomes for women in spontaneous labour at term and their babies. Cochrane Database Syst Rev. 2018;(8):CD005461. [DOI] [PMC free article] [PubMed] [Google Scholar]
- 12. de Vries BS, Mcdonald S, Joseph FA, et al. Impact of analysis technique on our understanding of the natural history of labour: a simulation study. BJOG. 2021;128:1833‐1842. [DOI] [PubMed] [Google Scholar]
- 13. Bernitz S, Dalbye R, Zhang J, et al. The frequency of intrapartum caesarean section use with the WHO partograph versus Zhang's guideline in the Labour Progression Study (LaPS): a multicentre, cluster‐randomised controlled trial. Lancet. 2019;393:340‐348. [DOI] [PubMed] [Google Scholar]
- 14. Bernitz S, Dalbye R, Oian P, Zhang J, Eggebo TM, Blix E. Study protocol: the Labor Progression Study, LAPS—does the use of a dynamic progression guideline in labor reduce the rate of intrapartum cesarean sections in nulliparous women? A multicenter, cluster randomized trial in Norway. BMC Pregnancy Childbirth. 2017;17:370. [DOI] [PMC free article] [PubMed] [Google Scholar]
- 15. Dencker A, Taft C, Bergqvist L, Lilja H, Berg M. Childbirth experience questionnaire (CEQ): development and evaluation of a multidimensional instrument. BMC Pregnancy Childbirth. 2010;10:81. [DOI] [PMC free article] [PubMed] [Google Scholar]
- 16. Wild D, Grove A, Martin M, et al. Principles of good practice for the translation and cultural adaptation process for Patient‐Reported Outcomes (PRO) measures: report of the ISPOR task force for translation and cultural adaptation. Value Health. 2005;8:94‐104. [DOI] [PubMed] [Google Scholar]
- 17. Soet JE, Brack GA, DiIorio C. Prevalence and predictors of women's experience of psychological trauma during childbirth. Birth. 2003;30:36‐46. [DOI] [PubMed] [Google Scholar]
- 18. Waldenstrom U, Borg IM, Olsson B, Skold M, Wall S. The childbirth experience: a study of 295 new mothers. Birth. 1996;23:144‐153. [DOI] [PubMed] [Google Scholar]
- 19. Waldenstrom U, Hildingsson I, Rubertsson C, Radestad I. A negative birth experience: prevalence and risk factors in a national sample. Birth. 2004;31:17‐27. [DOI] [PubMed] [Google Scholar]
- 20. Goodman P, Mackey MC, Tavakoli AS. Factors related to childbirth satisfaction. J Adv Nurs. 2004;46:212‐219. [DOI] [PubMed] [Google Scholar]
- 21. Lavender T, Alfirevic Z, Walkinshaw S. Partogram action line study: a randomised trial. Br J Obstet Gynaecol. 1998;105:976‐980. [DOI] [PubMed] [Google Scholar]
- 22. Lavender T, Wallymahmed AH, Walkinshaw SA. Managing labor using partograms with different action lines: a prospective study of women's views. Birth. 1999;26:89‐96. [DOI] [PubMed] [Google Scholar]
- 23. Adams SS, Eberhard‐Gran M, Eskild A. Fear of childbirth and duration of labour: a study of 2206 women with intended vaginal delivery. BJOG. 2012;119:1238‐1246. [DOI] [PubMed] [Google Scholar]
- 24. Boie S, Lauridsen HH, Glavind J, Smed MK, Uldbjerg N, Bor P. The Childbirth Experience Questionnaire (CEQ)—validation of its use in a Danish‐speaking population of new mothers stimulated with oxytocin during labour. PLoS One. 2020;15:e0233122. [DOI] [PMC free article] [PubMed] [Google Scholar]
- 25. Dalbye R, Blix E, Frøslie KF, et al. The Labour Progression Study (LaPS): duration of labour following Zhang's guideline and the WHO partograph—a cluster randomised trial. Midwifery. 2020;81:102578. [DOI] [PubMed] [Google Scholar]
- 26. Cohen WR, Friedman EA. Perils of the new labor management guidelines. Am J Obstet Gynecol. 2015;212:420‐427. [DOI] [PubMed] [Google Scholar]
- 27. Cohen WR, Friedman EA. Misguided guidelines for managing labor. Am J Obstet Gynecol. 2015;212(753):e1‐e3. [DOI] [PubMed] [Google Scholar]
- 28. Donate‐Manzanares M, Rodríguez‐Cano T, Gómez‐Salgado J, et al. Quality of childbirth care in women undergoing labour: satisfaction with care received and how it changes over time. J Clin Med. 2019;8:434. [DOI] [PMC free article] [PubMed] [Google Scholar]
- 29. Waldenstrom U. Why do some women change their opinion about childbirth over time? Birth. 2004;31:102‐107. [DOI] [PubMed] [Google Scholar]
- 30. Stadlmayr W, Amsler F, Lemola S, et al. Memory of childbirth in the second year: the long‐term effect of a negative birth experience and its modulation by the perceived intranatal relationship with caregivers. J Psychosom Obstet Gynaecol. 2006;27:211‐224. [DOI] [PubMed] [Google Scholar]
Associated Data
This section collects any data citations, data availability statements, or supplementary materials included in this article.
Supplementary Materials
Table S1
Table S2