

Abstract
This study uses administrative health care data from Ontario, Canada, to assess whether changes in diabetes management practices have affected trends in the association between diabetes vs prior cardiovascular disease and risk of cardiovascular events from 1994 to 2019 among adults aged 20 to 84 years.
Between 1982 and 2000, people with diabetes had the same risk of cardiovascular events as those with prior cardiovascular disease (CVD).1,2 Consequently, diabetes is considered a “cardiovascular risk equivalent.”3 Because diabetes management practices have changed substantially, we examined secular trends in the association of diabetes and prior CVD with cardiovascular events from 1994 to 2019 to see whether the risk equivalence persists.
Methods
We conducted a retrospective, population-based study using administrative health care data from Ontario, Canada. Physician- and hospital-based services for Ontario residents are publicly funded through the Ontario Health Insurance Plan (OHIP).
We created 5 population-based cohorts of adults aged 20 to 84 years who were alive on the index date (April 1) during each of the following years: 1994, 1999, 2004, 2009, and 2014. Because of computational limitations, we selected a random sample of 25% of each cohort. We excluded those who became eligible for OHIP less than 5 years before the cohort-specific index date to ensure adequate baseline data. Individuals were followed up for up to 5 years (final date of follow-up, March 31, 2019) and censored at departure from Ontario. We identified diabetes using a validated algorithm with 99.1% specificity.4
The exposures were diabetes, prior CVD, or both (3 separate categories); people with neither diabetes nor CVD served as the reference group. We characterized exposure status at the index date separately for each cohort. The primary outcome was cardiovascular events, defined as a composite of hospitalization for acute myocardial infarction or stroke, or all-cause mortality (eTable in Supplement 1).
We used modified Poisson regression to compute adjusted relative risks (RRs) describing the association between each exposure and the outcome, compared with the reference group. We adjusted for prespecified covariates (age, sex, socioeconomic status) (eTable in Supplement 1). We replicated the analyses in an independent manner for each cohort, so individuals could appear in more than 1 cohort if they fulfilled the inclusion criteria. These data sets were linked using unique encoded identifiers and analyzed at ICES. This study was exempted from ethics review and informed consent as per Ontario’s Personal Health Information Protection Act. We used SAS Enterprise Guide version 7.1 (SAS Institute Inc) and considered 95% CIs that do not cross 1 significant.
Results
Mean age increased from 44.4 to 47.5 years between 1994 and 2014, reflecting Ontario’s aging population, with a stable percentage of women (51%) (Table). Prevalence of diabetes increased from 3.1% (n = 57 560) to 9.0% (n = 225 611) and CVD from 2.5% (n = 46 103) to 3.7% (n = 92 426).
Table. Baseline Characteristics of the Study Cohorts.
| Characteristics | Cohort, No. (%)a | ||||
|---|---|---|---|---|---|
| 1994 (n = 1 870 791) | 1999 (n = 2 028 663) | 2004 (n = 2 227 576) | 2009 (n = 2 331 593) | 2014 (n = 2 512 790) | |
| Age at index, mean (SD), y | 44.4 (16.2) | 45.4 (16.1) | 46.2 (16.0) | 46.9 (16.2) | 47.5 (16.4) |
| 20-29 | 387 226 (20.7) | 365 165 (18.0) | 381 030 (17.1) | 401 999 (17.2) | 437 645 (17.4) |
| 30-39 | 465 922 (24.9) | 479 163 (23.6) | 459 720 (20.6) | 429 969 (18.4) | 437 871 (17.4) |
| 40-49 | 376 042 (20.1) | 439 965 (21.7) | 520 249 (23.4) | 518 994 (22.3) | 495 691 (19.7) |
| 50-59 | 252 629 (13.5) | 316 216 (15.6) | 388 438 (17.4) | 438 919 (18.8) | 509 171 (20.3) |
| 60-69 | 211 981 (11.3) | 221 400 (10.9) | 244 057 (11.0) | 295 379 (12.7) | 358 350 (14.3) |
| ≥70 | 176 991 (9.5) | 206 754 (10.2) | 234 082 (10.5) | 246 333 (10.6) | 274 062 (10.9) |
| Female | 959 426 (51.3) | 1 036 142 (51.1) | 1 133 046 (50.9) | 1 186 123 (50.9) | 1 279 589 (50.9) |
| Male | 911 365 (48.7) | 922 521 (48.9) | 1 094 530 (49.1) | 1 145 470 (49.1) | 1 233 201 (49.1) |
| Socioeconomic status, income quintile | |||||
| 1 (Lowest) | 371 974 (19.9) | 402 005 (19.8) | 452 180 (20.3) | 440 493 (18.9) | 505 190 (20.1) |
| 2 | 376 774 (20.1) | 418 649 (20.6) | 452 949 (20.3) | 461 998 (19.8) | 506 888 (20.2) |
| 3 | 375 502 (20.1) | 407 711 (20.1) | 434 417 (19.5) | 466 311 (20.0) | 501 674 (20.0) |
| 4 | 366 815 (19.6) | 391 277 (19.3) | 436 712 (19.6) | 481 880 (20.7) | 488 635 (19.4) |
| 5 (Highest) | 372 663 (19.9) | 402 384 (19.8) | 443 076 (19.9) | 472 386 (20.3) | 506 229 (20.1) |
| Urban residence | 1 594 999 (85.3) | 1 761 658 (86.8) | 1 955 878 (87.8) | 2 057 418 (88.2) | 2 244 056 (89.3) |
| Previous comorbidities | |||||
| Diabetes | 57 560 (3.1) | 90 235 (4.4) | 130 757 (5.9) | 182 957 (7.8) | 225 611 (9.0) |
| Cardiovascular disease | 46 103 (2.5) | 67 157 (3.3) | 82 593 (3.7) | 88 550 (3.8) | 92 426 (3.7) |
| Hypertension | 226 847 (12.1) | 344 229 (17.0) | 468 024 (21.0) | 563 902 (24.2) | 621 183 (24.7) |
| Congestive heart failure | 19 278 (1.0) | 30 272 (1.5) | 36 210 (1.6) | 38 259 (1.6) | 41 587 (1.7) |
| Chronic kidney disease | 9441 (0.5) | 17 360 (0.9) | 29 522 (1.3) | 48 706 (2.1) | 64 162 (2.6) |
Each cohort includes a randomly selected sample of all adult residents of Ontario on April 1 of the year indicated.
In the 1994 cohort, compared with no disease, diabetes was associated with an increased risk of cardiovascular events (28.4 vs 12.7 per 1000 person-years; absolute risk increase [ARI], 4.4% [95% CI, 4.2%-4.5%]; RR, 2.06 [95% CI, 2.02-2.10]) (Figure), as was prior CVD (36.1 per 1000 person-years; ARI, 5.1% [95% CI, 4.9%-5.2%]; RR, 2.16 [95% CI, 2.12-2.21]). A history of both diabetes and CVD was associated with the highest risk of cardiovascular events (74.0 per 1000 person-years; ARI, 12.0% [95% CI, 11.5%-12.5%]; RR, 3.81 [95% CI, 3.69-3.93]).
Figure. Trends in the Standardized Event Rate and Adjusted Relative Risk of Cardiovascular Events.
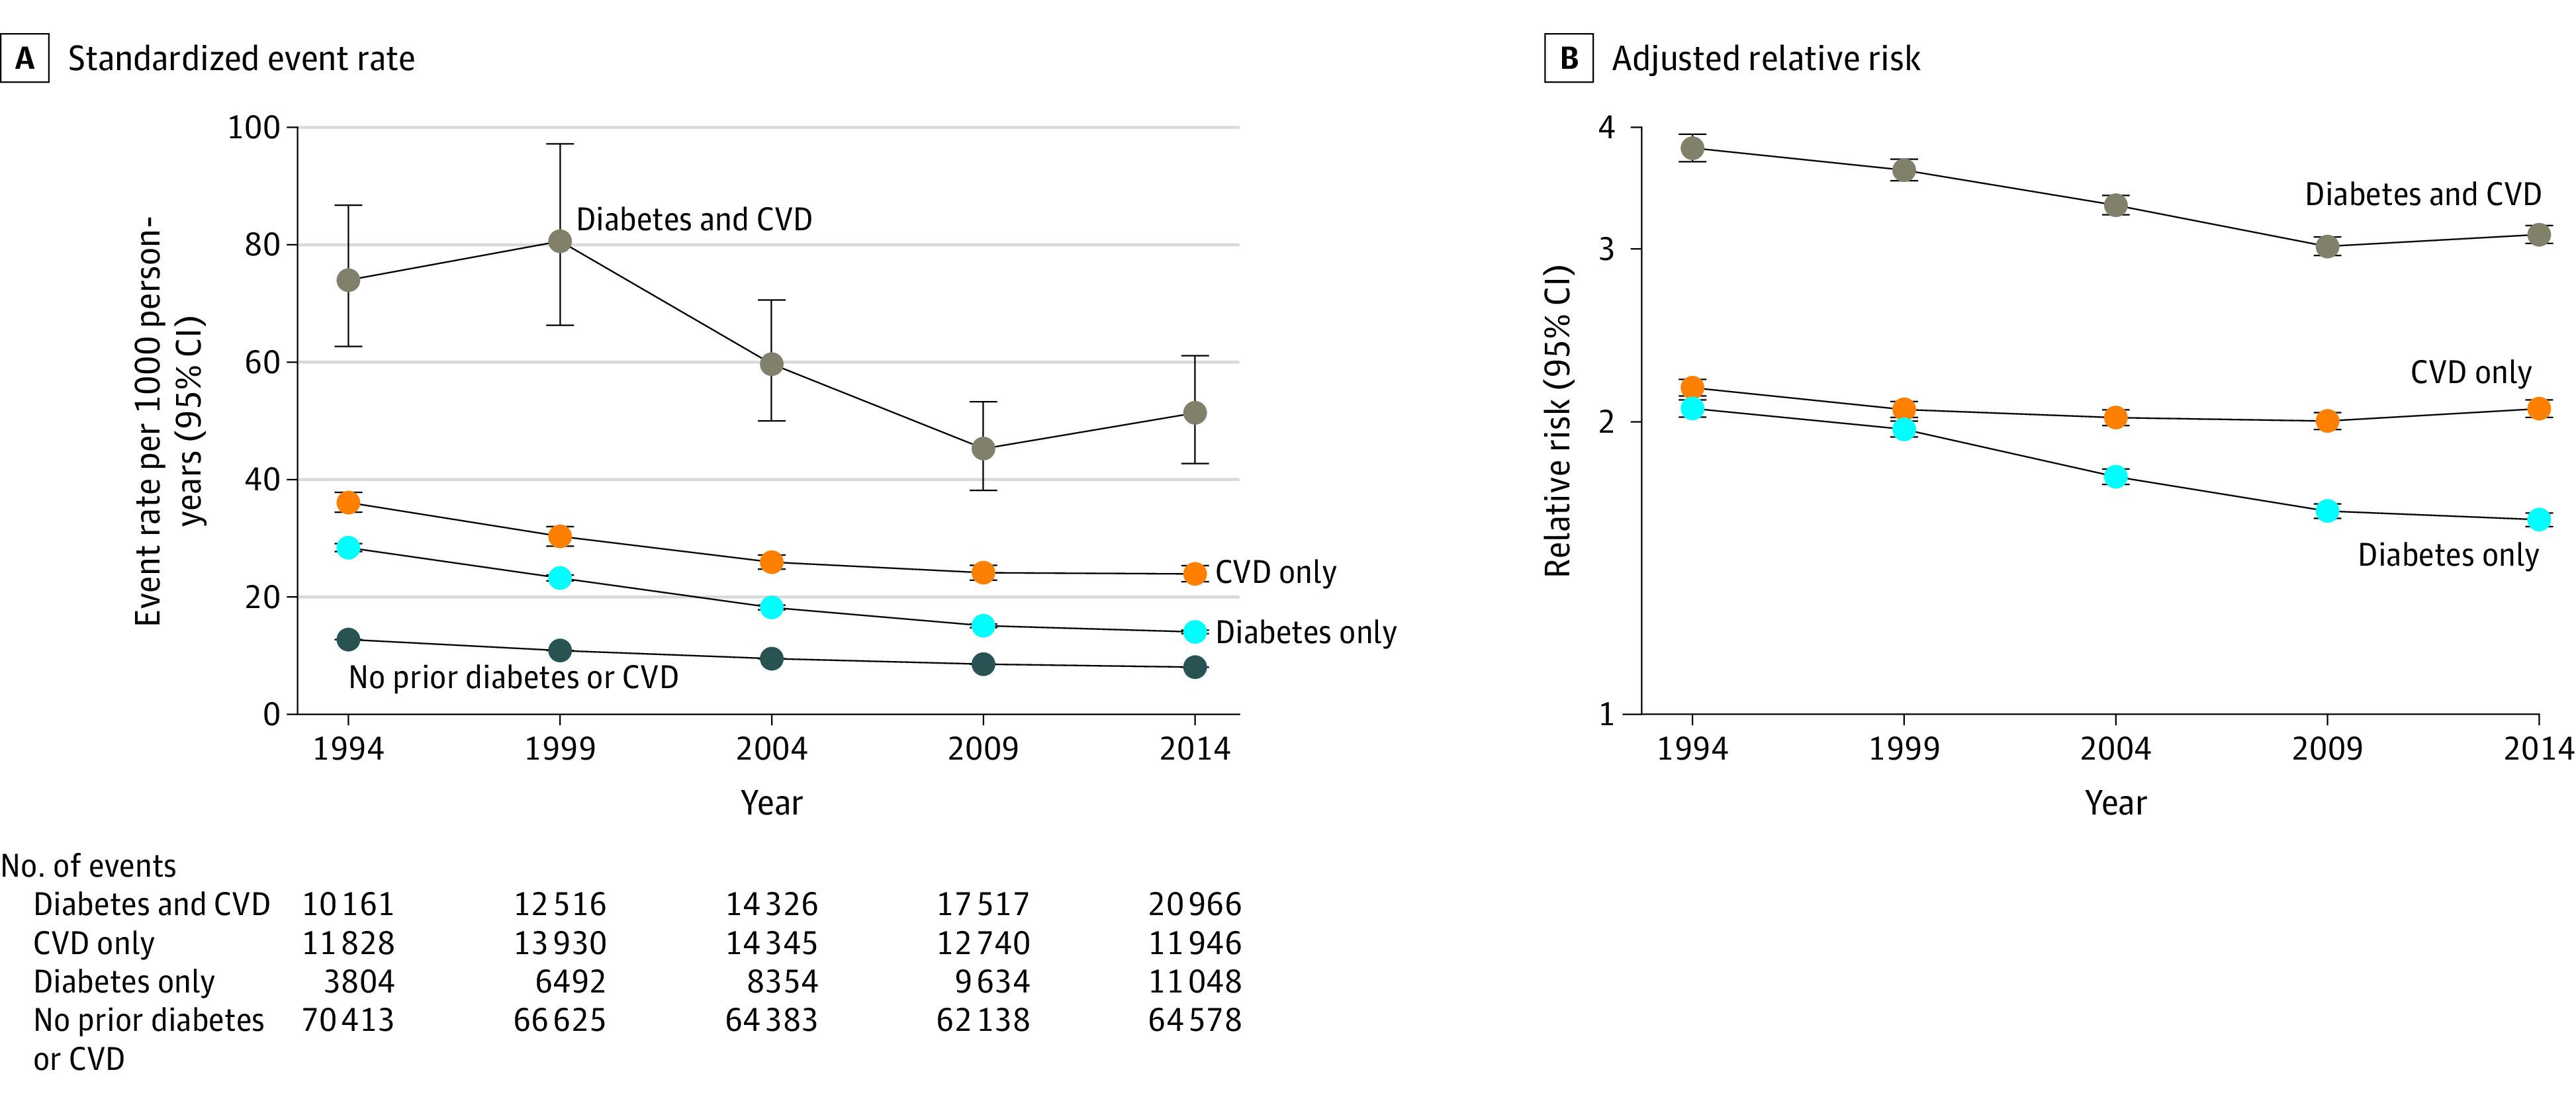
Cardiovascular events were defined as acute myocardial infarction, stroke, or all-cause mortality. Results are stratified by diabetes and prior cardiovascular disease (CVD) at baseline. A, Event rates were standardized by age and sex to the 2021 population of Ontario, Canada. B, Five-year relative risks were computed using individuals with no diabetes or CVD as the reference group, adjusting for age, sex, and socioeconomic status.
In the 2014 cohort, diabetes was associated with an increased risk of cardiovascular events compared with disease-free individuals (14.0 vs 8.0 per 1000 person-years; ARI, 2.0% [95% CI, 1.9%-2.0%]; RR, 1.58 [95% CI, 1.56-1.61]), as was prior CVD (23.9 per 1000 person-years; ARI, 3.7% [95% CI, 3.6%-3.9%]; RR, 2.06 [95% CI, 2.02-2.10]). A history of both diabetes and CVD remained associated with the highest risk of cardiovascular events (51.3 per 1000 person-years; ARI, 7.6% [95% CI, 7.3%-7.8%]; RR, 3.10 [95% CI, 3.04-3.17]).
Event rates decreased from the 1994 cohort to the 2014 cohort across categories (rate ratios: diabetes only, 0.49; prior CVD only, 0.66; diabetes and prior CVD, 0.69; neither diabetes nor CVD, 0.63).
Discussion
In this large, population-based study, the magnitude of the association between diabetes and risk of cardiovascular events decreased, while that between CVD and such events remained stable. These results suggest that diabetes is still an important cardiovascular risk factor but no longer equivalent to CVD—a change that likely reflects the use of modern, multifactorial approaches to diabetes.5,6 Limitations include lack of data on changes in certain risk factors (eg, blood pressure), protective factors (eg, statins), and cause-specific mortality; changing surveillance practices affecting diabetes misclassification rates; and potential residual confounding. Better prevention and optimal management of diabetes and CVD remain essential.
Section Editors: Jody W. Zylke, MD, Deputy Editor; Kristin Walter, MD, Senior Editor.
eTable. Variable Definitions
eMethods
eReferences
Data Sharing Statement
References
- 1.Haffner SM, Lehto S, Rönnemaa T, Pyörälä K, Laakso M. Mortality from coronary heart disease in subjects with type 2 diabetes and in nondiabetic subjects with and without prior myocardial infarction. N Engl J Med. 1998;339(4):229-234. doi: 10.1056/NEJM199807233390404 [DOI] [PubMed] [Google Scholar]
- 2.Booth GL, Kapral MK, Fung K, Tu JV. Relation between age and cardiovascular disease in men and women with diabetes compared with non-diabetic people: a population-based retrospective cohort study. Lancet. 2006;368(9529):29-36. doi: 10.1016/S0140-6736(06)68967-8 [DOI] [PubMed] [Google Scholar]
- 3.Bloomgarden ZT. Diabetes and cardiovascular disease. Diabetes Care. 2011;34(3):e24-e30. doi: 10.2337/dc11-0007 [DOI] [PMC free article] [PubMed] [Google Scholar]
- 4.Lipscombe LL, Hwee J, Webster L, Shah BR, Booth GL, Tu K. Identifying diabetes cases from administrative data: a population-based validation study. BMC Health Serv Res. 2018;18(1):316. doi: 10.1186/s12913-018-3148-0 [DOI] [PMC free article] [PubMed] [Google Scholar]
- 5.Fang M, Wang D, Coresh J, Selvin E. Trends in diabetes treatment and control in US adults, 1999-2018. N Engl J Med. 2021;384(23):2219-2228. doi: 10.1056/NEJMsa2032271 [DOI] [PMC free article] [PubMed] [Google Scholar]
- 6.Rigobon AV, Kalia S, Nichols J, et al. Impact of the Diabetes Canada guideline dissemination strategy on the prescription of vascular protective medications: a retrospective cohort study, 2010-2015. Diabetes Care. 2019;42(1):148-156. doi: 10.2337/dc18-0935 [DOI] [PubMed] [Google Scholar]
Associated Data
This section collects any data citations, data availability statements, or supplementary materials included in this article.
Supplementary Materials
eTable. Variable Definitions
eMethods
eReferences
Data Sharing Statement