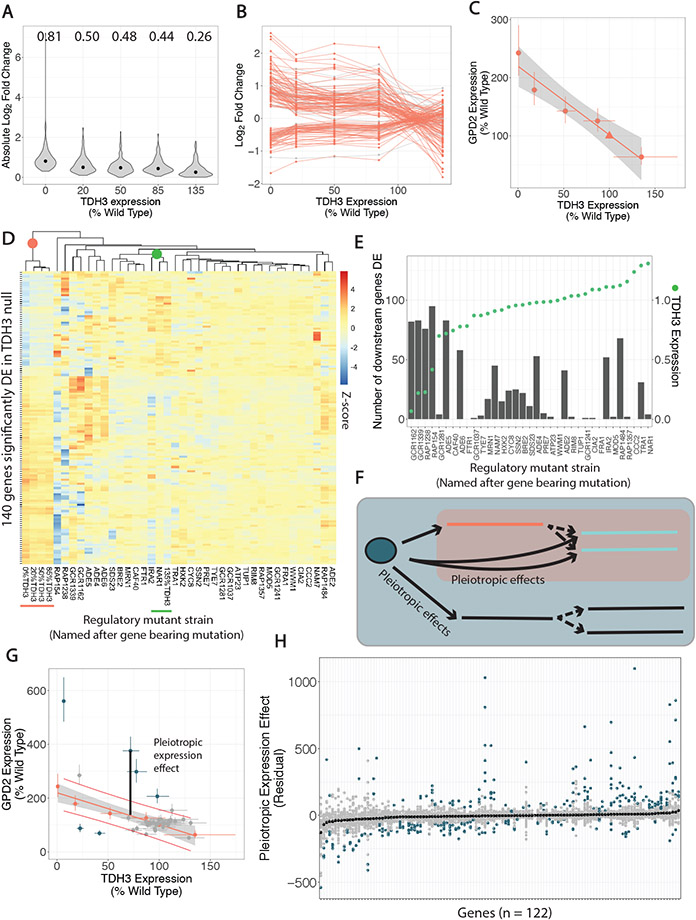
Fig. 3. cis- and trans-regulatory mutants have distinct effects on expression of genes downstream of TDH3.
(A) Violin plots show absolute log2 fold changes in the cis-regulatory mutants for the 140 genes identified as downstream of TDH3 because they were significantly differentially expressed (DE) in the TDH3 null mutant. Median absolute log2 fold changes are shown above each plot and indicated with black dots. (B) Log2 fold changes in cis-regulatory mutants are shown for the same 140 genes downstream of TDH3 connected by line segments. Genes whose expression was not significantly linearly correlated with TDH3 expression are shown in grey. (C) Expression of TDH3 and GPD2 is shown for the cis-regulatory mutants (circles) and the wild type strain (triangle). The best fit linear regression line and 95% confidence interval (grey shaded area) are shown. (D) A heatmap of the 140 genes downstream of TDH3 shows log2 fold changes in all cis- and trans-regulatory mutants in which genes are rows and mutants, named after the gene bearing the mutation in that mutant, are columns. Color intensity is scaled by row (by gene) and represents z-scores. Mutants are hierarchically clustered as shown by the dendrogram. (E) The number of downstream genes that are also significantly differentially expressed in each trans-regulatory mutant is shown as a column relating to the left y-axis. The expression level of TDH3 in that mutant is shown as a green point relating to the right y-axis. (F) Schematic shows that trans-regulatory mutants can have pleiotropic effects on genes downstream of TDH3 not mediated by their impact on TDH3 as well as pleiotropic effects on genes in parallel to TDH3. (G) Expression of GPD2 and TDH3 is shown for the trans-regulatory mutants, with the expression and linear regression from cis-regulatory mutants from (C) included in orange. Red lines delineate 95% prediction intervals for the cis-regulatory mutant relationship between TDH3 and GPD2. Effects of trans-regulatory mutants on GPD2 that are not explained by their impact on TDH3 (pleiotropic expression effects, example illustrated by black line) are colored blue. (H) For each of the 122 genes downstream of TDH3 with a significant linear relationship to TDH3 expression in the cis-regulatory mutants (x-axis), the pleiotropic expression effect (y-axis), as illustrated in (G), is shown. For each gene, each point represents a different trans-regulatory mutant. Genes are ordered on the x-axis by median residual (black points). Blue points indicate mutants with significant pleiotropic expression effects, while grey points indicate non-significant pleiotropic expression effects.

