

Abstract
Although few performance evaluation instruments have been used conventionally in different machine learning-based classification problem domains, there are numerous ones defined in the literature. This study reviews and describes performance instruments via formally defined novel concepts and clarifies the terminology. The study first highlights the issues in performance evaluation via a survey of 78 mobile-malware classification studies and reviews terminology. Based on three research questions, it proposes novel concepts to identify characteristics, similarities, and differences of instruments that are categorized into ‘performance measures’ and ‘performance metrics’ in the classification context for the first time. The concepts reflecting the intrinsic properties of instruments such as canonical form, geometry, duality, complementation, dependency, and leveling, aim to reveal similarities and differences of numerous instruments, such as redundancy and ground-truth versus prediction focuses. As an application of knowledge representation, we introduced a new exploratory table called PToPI (Periodic Table of Performance Instruments) for 29 measures and 28 metrics (69 instruments including variant and parametric ones). Visualizing proposed concepts, PToPI provides a new relational structure for the instruments including graphical, probabilistic, and entropic ones to see their properties and dependencies all in one place. Applications of the exploratory table in six examples from different domains in the literature have shown that PToPI aids overall instrument analysis and selection of the proper performance metrics according to the specific requirements of a classification problem. We expect that the proposed concepts and PToPI will help researchers comprehend and use the instruments and follow a systematic approach to classification performance evaluation and publication.
Keywords: Classification, Knowledge representation, Machine learning, Performance evaluation, Performance measures, Performance metrics, Periodic table
Introduction
Numerous binary-classification performance evaluation instruments have been developed and used independently for different requirements of classification problems in various domains for decades. The choice of an instrument for classification performance evaluation (i.e. measurement of closeness between a classifier’s prediction and ground truth) generally relies on domain knowledge and previous related studies. Hence, although these instruments might be frequently used in their specific domain, they could be unknown to the researchers working in the other domains. This paper aims to fill an elemental gap in the literature by reviewing 57 performance instruments compiled from different domains in-depth, and proposes a methodology to reveal their intrinsic properties, similarities, and differences. To our knowledge, this is the first time that such an ultimate set of classification performance instruments is addressed in the literature.
Performance instruments originated, and the related terms and notations appeared in different domains including statistics (i.e. 2 × 2 contingency table, binary similarity/distance measures), biology (i.e. binary association measures), signal processing (e.g., area under the receiver operating characteristic curve), information retrieval (e.g., ‘precision’, ‘recall’), medical diagnosis (e.g., ‘sensitivity’, ‘specificity’), statistical pattern recognition (e.g., ‘accuracy’) and marketing analysis (e.g., ‘lift’) at different times. For example, ‘precision’ and ‘recall’ metrics were proposed by Mooers as a necessity for measuring performance in the information retrieval domain [1]. Then, the terminology was established among different alternatives gradually.
In 1964, a group of researchers discussing the proper terminology for ‘positive predictive value’ (PPV) suggested the use of ‘acceptance rate’ instead of ‘relevance ratio’ to avoid confusion [2]. They also discussed the use of terms under different names in different domains, most of which are still used today. For example, ‘recall ratio’, ‘sensitivity’, ‘hit rate’ for ‘true positive rate’ (TPR), ‘Snobbery ratio’ for ‘false-negative rate’ (FNR), ‘precision ratio’, ‘relevance ratio’, ‘pertinency factor’, ‘acceptance rate’ for PPV, ‘noise factor’ (borrowed from signal processing) for ‘false discovery rate’ (FDR), ‘specificity’ for ‘true negative rate’ (TNR), and ‘fallout ratio’ for ‘false positive rate’ (FPR). Additionally, ‘inverse recall’ and ‘inverse precision’ are used for TNR and ‘negative predictive value’ (NPV), respectively [3]. Based on the inverse relationship (i.e. increasing the classification performance in terms of one metric generally decreases the performance in terms of the other) between recall (TPR) and precision (PPV), some individual metrics have been proposed, for example, F, which is a transformation of F1 metric [4]. It was later expressed as an unnamed coefficient version of F1 by Sokal and Sneath [5]. Note that the earliest record of the F1 metric’s usage is by Jaccard, as he called it ‘coefficient de communauté’ [6].
Classification research problems requiring Machine Learning (ML)-based solutions have increased and varied significantly in recent years. Researchers mostly used the ones they have already known for the problem they have been studying. Otherwise, they either adapted the ones used in similar domains or even implemented new performance evaluation instruments for specific research problems. Besides instrument choice, different approaches in the literature to describe performance evaluation instruments also cause variations in terminology. In the literature, the definitions of some performance instruments are not clear, such as ‘performance metrics’ and ‘performance measures’ are undistinguished.
As a result, each community conventionally adapted the performance instruments according to their domain-specific practices and considerations [7]. Although numerous instruments have been proposed and used, their properties, similarities, and differences have not been thoroughly analyzed in the literature. Several works reviewed in “Semantic/formal definitions and organization of performance evaluation instruments” address the class imbalance effect on well-known instruments, especially accuracy (ACC). Relationships between different instrument types, as well as confusion-matrix-derived instruments (i.e., entropic, graphical-based, and probabilistic instruments) were not studied together. The review studies express performance evaluation instruments with different notations, abbreviations, and symbols [8–10]. The contributions of this research can be summarized as follows:
To the best of our knowledge, this study is the first to review the interchangeable naming of the instruments in general and the alternating terminology of the ones from both semantic and formal perspectives.
The study also identifies three relationships between the instruments, namely duality, complementation, and class counterparts.
Instruments are categorized into metrics and measures by determining whether they can be used to evaluate classification results directly in the performance context (e.g., ACC) or they are related to the non-performance aspects such as ground-truth or prediction class-related measurements (e.g., PREV or IMB for ground-truth and BIAS for prediction). The categorization is described semantically and defined formally.
We also propose different forms by which the instruments' equations are expressed, such as canonical, high-level, equivalent, and base-measure forms.
The axioms about the summarization of the confusion matrix to reflect the performance and the leveling of the instruments per instrument category to observe their dependencies are defined.
A geometry concept is developed to identify ground-truth or prediction dimensions of the instruments.
Finally, a visual exploratory table is proposed to represent all the concepts for the comprehensive set of performance instruments in one place, including the instruments for single-threshold ML models or crisp binary classifiers, as well as graphical-based performance metrics based on varying model thresholds, entropy-based instruments, and the measures based on the probabilistic interpretation of classification error or loss. The table covers 57 instruments along with 12 variant and parametric instruments.
The rest of the paper is structured as follows. The next section presents and discusses the results from the conducted case study, summarizes the related works in the literature, and describes the research questions addressed in this study. The subsequent section categorizes performance instruments, and describes the axioms and formal definitions for the proposed concepts about them. It also presents a new leveling approach by defining the base and higher-level measures/metrics and introducing new measures followed by which the proposed binary-classification performance instrument table PToPI as a knowledge organization tool is introduced. It describes the design methodology, meaning of visual design elements, and its practical applications by examples in the literature. The final section outlines the contribution of this study and summarizes its potential use. Appendix 1 lists abbreviations and alternative names of performance measures and metrics in levels. Appendix 2 presents the instrument equations as a complete reference. Appendix 3 gives a full view of the proposed exploratory table. Appendix 4 describes the selection methodology for Android malware classification studies surveyed. Finally, Appendix 5 lists survey references.
Online Data and Materials
The following data and materials are provided online for researchers:
The detailed data and findings for the case study in “Case study: performance evaluation in android mobile-malware classification” are made online at 10.17632/5c442vbjzg.3 via the Mendeley Data platform.
An online repository is also maintained at https://www.github.com/gurol/ptopi, which includes the proposed exploratory table as a spreadsheet (PToPI.xlsx) along with full-resolution PToPI images (full view: online Fig. C.1 and plain view: Fig. 4).
Fig. 4.

Plain view of PToPI (see online Fig. C.1 for the full view)
The spreadsheet also provides extra materials such as an instrument list (showing proposed concepts: instrument category, level, symbol, derivatives, complements, duals, geometries, alternating terms, range, error types, etc.), a probabilistic error instrument list, and probabilistic error/loss, confusion matrix-based, and entropic instruments calculator/simulation tool for hypothetical classifiers on synthetic datasets.
Case Study: Performance Evaluation in Android Mobile-Malware Classification
A case study was conducted to clarify the issues described above. We selected “mobile-malware classification” as a case study domain to analyze performance evaluation approaches systematically. The domain was chosen because it is a recent rapidly changing classification research problem, where ML-based binary classification (whether it is malicious (positive) or benign (negative) software) is frequently used [11, 12]. Our survey included 78 studies from 2012 to 2018, which reported their performances with different ML algorithms on Android mobile-malware binary classification problems. The results showed that even within the same domain, several researchers used alternative terminology, as listed in Table 1 (see Appendix 4 for the details of the systematic literature review and online Table E.1 for the references of the studies).
Table 1.
The distribution of alternative terms per individual performance metrics referred by the surveyed studies
| Metrics | Terms |
|---|---|
| ‘Accuracy’ (ACC) | ‘Accuracy’ (80%), ‘Detection Rate/Ratio’ (11%), ‘Detection Accuracy’ (7%). ‘Success Rate/Ratio’, and ‘Overall Accuracy/Efficiency’ |
| ‘F metric’ (F1) | ‘F-measure’ (43%), ‘F-score’ or ‘F1 score’ (39%), F1 (22%), Fm |
| ‘True Positive Rate’ (TPR) | ‘True Positive Rate’ (39%), ‘Recall’ (26%), ‘True Positive Rate’ and ‘Recall’ (at the same time) (15%), ‘Detection Rate’ (9%), ‘Sensitivity’ (5%), and ‘Accuracy Rate’ |
| ‘Positive Predictive Value’ (PPV) | ‘Precision’ (86%), ‘Positive Predictive Value’ (8%), and ‘Detection Rate’ |
| ‘False Positive Rate’ (FPR) | ‘False Positive Rate (96%) and ‘False Alarm Rate’ (7%) |
| ‘True Negative Rate’ (TNR) | ‘True Negative Rate (60%), ‘Specificity’ (27%), and ‘Recall Benign’ (13%) |
The metrics referred to with a single term are: FNR (‘False Negative Rate’), NPV (‘Negative Predictive Value’), CK (‘Cohen’s Kappa’), MCC (‘Matthews Correlation Coefficient’), MCR as ERR (‘Misclassification Rate’)
In mobile-malware classification, positive class detection success in class-imbalanced datasets is referred to as ‘detection rate’. The overall performance is stated as ‘malware detection’. Besides, “malware classification” corresponds to “binary classification” encapsulating “malware detection”. This is due to the reason that the studies we surveyed reported other binary classification metrics such as CK and MCC. The researchers also used a limited number of instruments to evaluate and compare the performance of their classifiers, as listed in “Case study: performance evaluation in android mobile-malware classification”. Additionally, the findings show that they prefer using different terms for the instruments. Mainly, some used the same term (e.g., ‘detection rate’) to refer to various instruments (ACC, TPR, and PPV, as shown double underlined). Moreover, different terms for the same metrics were expressed in the same study. For example, 15% used both ‘true positive rate’ and ‘recall’ in the same context as shown in underlined.
More interestingly, we even found that six of the surveyed studies (7.7%) published the same metrics (referring to as TPR and ‘recall’) with the same values redundantly.1 Although it is a typical binary classification domain, some researchers used conventional terms that are rather semantic, namely ‘precision’, ‘recall’, ‘sensitivity’, and ‘specificity’. For the rest, the findings show that researchers are familiar with syntactic terms. For example, (‘True’/‘False’) + ‘Positive’/‘Negative’ + ‘Rate’/‘Predictive Value’ (e.g., ‘True Positive Rate’, ‘Positive Predictive Value’).
The above brief history and our survey on the mobile-malware classification domain showed that classification performance evaluation approaches in different domains were affected by the other deep-rooted domains such as information retrieval, biology, and medicine. Note that referring to one alternative instrument naming instead of the others is not wrong essentially. However, these alternative terms can lead to misunderstanding or unnecessary use of equivalent terms in knowledge transfer and communication between researchers from different disciplines.
Related Works
A comprehensive study by Japkowicz and Shah provided an ontology of performance instruments and a general classifier evaluation framework, including selecting a performance metric [7]. Some studies compared metrics by testing standard ML algorithms on real-world or synthetic datasets. The examples of such experimental studies are as follows: Sokolova et al. covered three measures and six metrics using naïve Bayes and support vector machine classifiers [10]. Tharwat gives preliminary information for four measures and thirteen metrics [3]. Luque et al. analyzed the symmetry of ten metrics under three types of transformation, such as labeling transformation that exchanges positive and negative class labels [9].
Most of the related literature addressed the issues researchers encounter when they seek to use performance instruments, especially class imbalance, where the number of examples in positive and negative classes is not the same or close [13–17]. Valverde-Albacete and Peláez-Moreno focused on the so-called “accuracy paradox,” where a classifier with lower accuracy might have higher predictive power and vice versa [18]. Bradley earlier addressed several desirable properties of AUCROC over ACC [19]. Chicco and Jurman suggested MCC as a more informative metric compared with F1 and ACC [20]. Hu and Dong studied the cost-based evaluation of twelve metrics for class-imbalance conditions [21]. They individually check whether a misclassification from the class with fewer number of examples (e.g., positive, P = 100) will cause a higher cost than that from the other class with a higher number of examples (e.g., negative, N = 900). Another aspect reviewed in the literature is the chance correction in metrics (e.g., CK) that eliminates a potentially high performance exhibited by a random classifier [22]. Wang and Yao focused on the relationship between diversity (i.e. the degree of disagreement within classification ensembles) and performance metrics [23].
Other studies examined instruments and their properties from specific perspectives such as invariance in switching confusion matrix elements [24], a chronology of the instruments [25], and the patterns in the instruments’ equations [26]. Yan et al. discussed the metrics’ decomposability into the sum or average of individual losses on each example in the dataset due to incorrect classifications [27]. Forbes proposed constraints, which evaluate metrics in terms of whether they are statistically principled, readily interpretable, and generalizable to k-class situations [28]. Straube and Krell suggested the following criteria for choosing a proper metric: (i) performance-oriented (not data-oriented), (ii) intuitive (interpretable), and (iii) comparable (accepted in the literature) [13]. Huang and Ling recommended “consistency” and “discriminancy” degrees for comparing performance metrics through ACC and AUCROC example metrics in balanced and imbalanced datasets [29]. The robustness of binary classification performance instruments is examined via a benchmarking method [30]. Multi-class/multi-labeled performance evaluation was also addressed [24, 31, 32].
Many binary-classification performance instruments are the same as binary similarity or distance metrics [33] because all are derived from a 2 × 2 contingency table. For example, F1 and ACC were referred to as ‘Sørensen–Dice coefficient’ and ‘simple matching coefficient’, respectively. Tulloss suggested requirements and recommendations for binary similarity instruments such as sensitivity to the relative size of two compared lists (similar to the class imbalance in classification) and having a lower and upper bound for identical and unequal lists, respectively [34].
Theoretically, performance instruments, as well as similarity/distance and association instruments, can be formed in numerous ways by changing the coefficients or weights in the equations. Hence, generalized instruments (i.e. representing the instruments in other forms) are suggested. Koyejo et al. described the equations as the ratio of two polynomials with one degree in four variables: TP, FP, FN, and TN [35]. Paradowski formed a function combining joint probability, marginal probabilities, and the mean of marginal probabilities for binary class variables (P and N) [36]. These forms might also be used in classification performance evaluation.
We observe that in the literature on performance evaluation instruments, limited issues were examined, most of which were related to class imbalance on a few customary metrics, especially F1 and ACC. Besides, the instruments were compared at a high level without taking their intrinsic properties into account. To the best of our knowledge, an extensive analysis of performance evaluation instruments in broad coverage has not been conducted in the literature. This study also provides a baseline for the performance evaluation of classifications with a higher number of classes, because binary-classification evaluation metrics can be used for multi-class or multi-label classification by micro- or macro-averaging binary metrics [37, 38] or making specific adaptions such as one-versus-all approach [31, 32, 39]. Moreover, the literature has recently focused on the need for reliable measurement [40]. Note that the preliminary work of this study provides only a few concepts without formal definitions with a limited scope [41].
Research Questions
The paper has three main research questions:
RQ.1. How can we differentiate performance instruments semantically and formally?
‘Performance evaluation instruments’ (shortly ‘performance instruments’) are generally expressed by various terms such as ‘performance metrics’, ‘performance measures’, ‘evaluation measures’, and ‘prediction scores’. The evaluation based on a 2 × 2 contingency table is named ‘diagnostic accuracy’ or ‘test accuracy’ in medicine [42] or ‘skill score’ or ‘forecast skill’ in meteorology (forecast vs. observation classes) [43]. Concerning the literature, we observed that.
Performance ‘measures’, ‘indicators’, ‘metrics’, ‘scores’, ‘criteria’, ‘factors’ or ‘indices’ terms are used interchangeably.
Despite the semantic differences between the terms, the studies directly related to classification performance use the terms interchangeably [22, 24, 29, 44, 45].
In our surveyed studies, 42% use ‘performance metrics’, 15% use ‘performance measures’, and 25% use both terms interchangeably.
In this paper, we present a recommendation to clarify the definitions of these terms to express and distinguish the instruments. We also give conventional naming and abbreviations in a generic classification context for the instruments.
RQ.2 How can we formally identify the properties of binary-class performance instruments and their similarities, redundancies, and dependencies?
Performance evaluation instruments summarize the confusion matrix via a mathematical function that can be expressed in numerous ways in terms of other instruments. Interpreting the functions and the dependencies among the instruments brings out difficulties in comprehension and comparison of the instruments. In this study, we examine 57 instruments methodically and present novel concepts that reveal their inherent properties formally. We refer to the intrinsic properties enabling the comparison of those instruments as “concepts”. This study introduces canonical forms and two basic measures, namely TC (True Classification) and FC (False Classification), to enhance comprehension and interpretation of instrument equations. Then, it defines geometry, duality, complementation, and leveling concepts formally to uncover the similarity, redundancy, and dependency among instruments.
RQ.3 How can we effectively select instruments in performance reporting and publication?
For performance reporting, it is not clear what and how many instruments should be used even in a specific application domain. The performance of a classifier can be examined from the standpoint of failure instead of success. In this case, the number of false classifications, namely FP or FN (or both), becomes the primary concern. The choice of metrics in performance reporting depends on the classification problem domain. Type I error (false positives) is critical in many binary classification problems. For example;
In information retrieval applications such as document filtering [37], FP might be critical.
In malware (also known as “malicious software”, e.g., computer viruses) analysis, it might be better to label a “benign” software example incorrectly as “malign” (“malware”) than to omit malware by labeling benign incorrectly. Because the examples labeled as malware could be prioritized, then an expert could later go through further manual analysis to eliminate FP [46].
An anti-malware product (also known as “anti-virus”) classifying a given computer file instance as malware or benign should behave with decreased FPs to prevent displaying excessive malware warnings.
However, according to our survey of studies involving Android mobile-malware classification, we found that most studies focused more on type I errors (63% report FPR, whereas 19% report FNR). Table 2 shows the key findings of our survey in reporting ML-based malware classification performance to answer “how many”, “which”, and “what combination of” metrics the researchers report.
Table 2.
The statistics of performance metrics reported from 69 applicable studies of 78 surveyed studies

As seen in Table 2a, the number of performance evaluation instruments reported in a single study has a wide range. The studies tend to publish two or three instruments, but they may choose from only one instrument (ACC or F1) to seven instruments inclusive. TPR, FPR, and ACC are the most reported metrics, as shown in Table 2b. Note that the same variance in selected metrics was also observed in multi-labeled performance reporting [31].
Consequently, we develop a solution to facilitate the selection of performance measures with an exploratory table called PToPI, which is similar to a periodic table of elements to represent the concepts proposed in this study. The periodic table of elements can be considered an unprecedented example application of information or knowledge organization. The classification of the elements (i.e. grouping, ordering, positioning the elements) is pragmatic (e.g., producing the most helpful one) and methodological suggesting new hypotheses, explanations, and theories [47]. Likewise, PToPI is also a schematic representation of available performance evaluation instruments conveying different forms of intrinsic properties (i.e. concepts) [48, 49]. Additionally, as people are familiar with the periodic table, there are other adaptations of periodic tables in different scopes, such as in data science [50]. Covering these research questions, in this paper, we studied 57 instruments including the following instrument types:
confusion-matrix derived instruments for a single/final classification model-threshold;
entropy-based instruments (a subset of confusion-matrix derived instruments) such as mutual information (MI), outcome entropy (HO), class entropy (HC), joint entropy (HOC), and normalized mutual information (nMI);
graphical-based performance metrics such as area-under-ROC-curve (AUCROC, ROC: receiver operating characteristic) or area-under-precision-recall-curve (AUCPR); and
the instruments dependent on classification error’s probabilistic interpretation such as mean squared error (MSE, also known as Brier score), mean absolute error (MAE), root mean square error (RMSE), and LogLoss (also known as binary cross-entropy or relative entropy).
Considering entropy as an information-theoretic concept, mutual information indicating the strength of association in the contingency table [51] is also used for binary classification, namely prior (“ground truth”: P or N) and posterior (“prediction”: OP or ON) distributions [44]. For the entropy-based instruments, which are the subtype of confusion-matrix-derived instruments, the following equation is valid: MI = HC + HO − HOC [52]. Note that entropy-based instruments are measures of uncertainty with the true distribution of a random variable: HC for positive class distribution (PREV), HO for outcome-positive distribution (BIAS), and HOC for confusion-matrix elements (TP, FP, FN, TN). On the other hand, binary cross-entropy (LogLoss) is about the uncertainty with the approximate distribution of the variable with a probability function.
Although graphical-based performance metrics are not based on a single instance of a confusion matrix, they are calculated by varying a decision threshold (i.e. full operating range of a classifier) for different TPR and false-positive rate (FPR) or positive predictive value (PPV) and TPR pairs in a specific binary-classification application [53, 54]. Such metrics are the summary statistics of the graphical measurements of paired base metrics to rank classifiers according to performances [7]. Graphical-based metrics give insight into the performance of a classifier modeled for the whole possible model threshold range. In contrast, confusion-matrix-derived instruments represent the final performance of the classifier for an optimum threshold. In other words, the former is for model development, and the latter is for production.
Although probabilistic error/loss instruments are not based on a confusion matrix generated for single-threshold classification models or crisp classifiers [55], most of the proposed concepts and definitions are applicable. For example, they can be categorized as ‘measures’ with a half-bounded/unbounded interval or ‘metrics’ with a finite interval, indicating the performance failure (i.e. the smaller values, the better predictions). The instruments and their variants that summarize the deviation from the true probability are for regression problems rather than classification. While MAE (also known as Mean Absolute Deviation and abbreviated as MAD) is computationally less expensive and more resistant to outlier errors, MSE is more often used in practice [56]. LogLoss that is the predicted probability of the ‘true’ class measures the prediction uncertainty. It is also preferred for multi-class classification and modeling with artificial neural networks. Contrary to zero–one loss metrics (e.g., MCR, FPR, FNR, FDR, and FOR), probabilistic error/loss instruments evaluate the performance error of scoring or non-crisp classifiers that label instances with a reported or attached belief value (score, probability, or likelihood) according to a decision boundary.
For example, instead of labeling an instance as positive (one) or negative (zero) absolutely (also known as a “hard label”), a classifier model with a 0.5 internal decision-boundary value (the right side is for positive labels, the left side is for negative ones) in [0, 1] interval can label an instance as positive correctly with a 0.85 score (also known as “soft label”). In contrast, it labels another instance as negative correctly with a 0.40 score. Hence, we can interpret the probabilistic classification error for those instances such that the former labeling is more probable than the latter (|0.85 − 0.50|= 0.35 > 0.10 =|0.40 − 0.50|). A significant difference in probabilistic error/loss instruments measured for test and training datasets might reveal over/underfitting (bias-variance trade-off) unless it appeared due to the different statistical properties of the datasets or modeling errors [57] (e.g., RMSEtest > RMSEtraining for overfitting).
Note that probabilistic instruments are also used in the evaluation of ordinal classification, where there is an inherent (but without a meaningful numeric difference), order between the classes [58]. Another related use of probabilistic instruments is to assess candidate classification models in the same dataset by checking the trade-off between models’ fit and complexity. Akaike Information Criterion (AIC) and Bayesian Information Criterion (BIC), two inter-model complexity criteria, put a penalty for the number of model parameters (i.e. model complexity) and reward goodness-of-fit via negative MSE as a likelihood function (the equations are given in Appendix 2) [59, 60].
We reviewed 30 probabilistic instruments based on the summary of errors via different summary functions (see the last row for the summary functions of Probabilistic Error/Loss Measures/Metrics equations in Appendix 2). Then we prepared a calculator and analyzed these instruments based on the hypothetical classifiers using synthetic datasets in ten cases. The calculator and example simulation results provided in the online PToPI spreadsheet showed the following specific deficiencies exhibited in some of the instruments:
In ME and MPE, positive and negative errors are neutralized in summation.
In all percentage error instruments (e.g., MPE and MAPE), division-by-zero occurs when the samples have at least one negative class (N > 0).
Scaled error instruments (MASE, MdASE, and RMSSE) for time series regressions and forecasting are not applicable in binary classification because there is no innate sequence/order in classification dataset samples.
Critically, Normalized Mean Squared Error (nMSE) in five variants, ME, and percentage error instruments yield unbalanced over-prediction (pi > ci, false positive) − under-prediction (pi < ci, false negative) errors.
Based on the findings, out of 30 instruments, we distinguished and presented five instruments (with a total of 9 variants) that are proper for binary classification, namely LogLoss, MRAE (MdRAE, GMRAE), MSE (RMSE), MAE (MdAE, MxAE), and nsMAPE. Note that we excluded recently proposed binary-classification performance metrics such as
SAR (an abbreviation of Squared Error, Accuracy, and ROC area) by Caruana and Niculescu-Mizil [61],
Optimized Precision (OACC) by Ranawana and Palade [62],
Index of Balanced Accuracy (e.g., IBAα(G)) by Garcia, Mollineda, and Sanchez [63] and
probabilistic error instruments with unconventional summary functions such as Mean Arctangent Absolute Percentage Error (MAAPE) by Kim and Kim [64],
because they are derived from well-known standard metrics, or their use in the literature is limited. However, the concepts proposed in this study are also applicable to those metrics. Finally, this study focused on the performance instruments’ properties and their relations, but it does not aim to compare the superiority of an instrument over the other.
Semantic/Formal Definitions and Organization of Performance Evaluation Instruments
This section, first, proposes a semantic categorization of performance evaluation instruments as ‘measure’ and ‘metric’. Second, we provide a formal definition of the categories consistent with measure and metric in mathematics and the semantic approach. We also propose another organization of multiple instruments per category to see their similarities and dependencies.
Semantic Categorization of Performance Evaluation Instruments
This section addressing RQ.1 aims to clarify ‘measure’ and ‘metric’ terms that are used interchangeably. By definition at a high level,
A measure is defined as “the dimensions, capacity, or amount of something ascertained by measuring”2 and a metric (often metrics) is “a standard of measurement”.3
A measure is quantitatively derived from measurement, while a metric is close to inferring qualitative subjects.
A metric is a calculated or composite measure based on two or more measures and is typically stated as percentages, ratios, or fractions.
We distinguish ‘measures’ and ‘metrics’ referring to different but dependent concepts. This categorization was also examined by Texel from a general perspective [65]. Measures are numerical values providing incomprehensible or no context. In contrast, metrics have a compilation of measures within a comprehensible context. Figure 1 illustrates our proposed categorization with performance measures/metrics with their relative characteristics and typical intervals. Note that the literature in specific disciplines also focuses on similar terminologies. For example, Olsina and de Los Angeles Martín pointed out the lack of consensus in terminology about the assurance of the non-functional requirements of software such as quality, accessibility, and productivity (like classification performance) [66]. They proposed a comprehensive ontology covering various terms, including ‘measures’, ‘metrics’, and ‘indicators’. The ontology exhibits a metric's dependency on one or more measures via value interpretation.
Fig. 1.
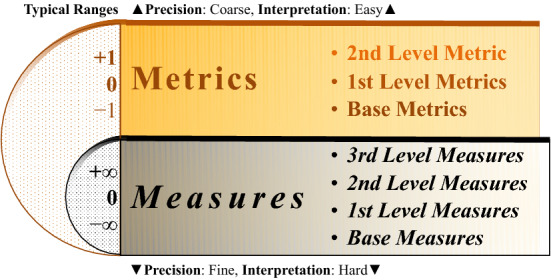
Dependency and relative characteristics of performance evaluation instrument categories. The attached semicircles on the left show the typical intervals for each category. For classification performance measures and metrics, the intervals are usually [0, ∞) and [0, 1], respectively
Measures are produced by a measurement activity, whereas metrics quantify an attribute of any entity in software domain such as process, product, and resource. The analogies ‘data’ to ‘measures’ and ‘information’ to ‘metrics’ might also be insightful. García et al. mainly reviewed and discussed ‘measures’ and ‘metrics’ terms concerning software management and proposed another ontology [67]. Our interpretation of ‘measures’ and ‘metrics’ described above is also in line with those studies.
Formal Definitions and Organization of Performance Evaluation Instruments
This section addresses RQ.1 for distinguishing instruments formally and RQ.2 for the identification of their intrinsic properties formally. Table 3 shows the notation proposed for instruments as well as their transformations (dual and complement) described in this study.
Table 3.
Performance instrument notations
| Notation | Style | Meaning | Examples |
|---|---|---|---|
| M | Italic | Any instrument (measure or metric) | ACC in [0, 1], MCC in [− 1, 1], PREV in [0, 1] |
| M | +Bold | Unlimited measures having positive integer values (recommended when used in a text, the notation optional in equations) | TP, P, Sn, DET |
| M* | * Super-script | The dual of an instrument | PREV = BIAS*, HC = HO* |
| Over bar | The complement of an instrument |
First, we propose the following axioms setting out a base for the formal definitions for the confusion-matrix-derived instruments, including entropic instruments.
Axiom 1
(Atomicity). The only indivisible instruments to evaluate binary-classification performance are TP, FP, FN, and TN, which are the elements of a confusion matrix (2 × 2 contingency table).
Axiom 2
(Atomic Expression). Any binary-classification performance evaluation instrument can be expressed with the confusion matrix elements.
Axiom 3
(Basic Summary). A basic summary includes the summation of the pairwise or all of the confusion matrix elements.
Axiom 4
(Binary-classification Performance Instrument Expression). All performance instruments can be expressed via functions of individual or basic summaries of confusion matrix elements.
The axioms are valid for graphical-based metrics and probabilistic error/loss measures, which also depend on or have a similar relationship with the confusion-matrix-derived instruments, as depicted in Fig. 3b and c. Namely, AUCROC and AUCPR depend on multiple TPRs vs. TNRs and TPRs vs.. PPVs, respectively. Probabilistic instruments measuring classification uncertainty or type I/II errors are similar to FPR and FNR. An example of Axiom 2 could be given for PREV: PREV = P/Sn can be expressed in an atomic manner as PREV = (TP + FN)/(TP + FP + FN + TN). The other axioms are described in the sections below. We proposed the following formal definitions for organizing and describing binary-classification performance evaluation instruments.
Fig. 3.

Instrument dependencies graphs. The full-resolution graphs and the DOT (graph description language) files to produce them via Graphviz are provided online at https://github.com/gurol/ptopi
The Base Measures (TP, FP, TN, FN)
Based on Axiom 1, we called the four atomic confusion matrix elements “base measures”. As stated in Axiom 2, all other instruments can be expressed by these base measures. PToPI full-view in online Fig. C.1 provides different names of the base measures.
The First-Level Measures (P, N, OP, ON, TC, FC, Sn)
Based on Axiom 3, the first-level measures are the composition of the four base measures by summation (pairwise and total):
P and N are column (marginal) totals of a confusion matrix. They represent the ground truth denoting the real number of the two observed classes (known labels). For example, a classification test dataset with 3000 malign and 2000 benign application samples is expressed as P = 3000 and N = 2000.
OP and ON measures that are row totals (the other marginal totals in probability theory) of a confusion matrix represent the prediction (test or classification result/outcome) of the two classes, where OP = TP + FP and ON = FN + TN. For the same example, the outcome of a decision tree classifier that predicts 3,100 malign and 1,900 benign applications is expressed as OP = 3100 and ON = 1900. These measures correspond to predicted, hypothesized, or estimated (classification) output.
Moreover, True Classification (TC) and False Classification (FC) are defined as the totals of diagonal base measures (TP and TN) and off-diagonal ones (FP and FN), respectively. Substituting those totals simplifies the instruments’ equations and their interpretation. For instance, ACC that is defined as (TP + TN)/Sn (even as (TP + TN)/(TP + FP + FN + TN)) could be expressed merely as TC/Sn with TC. Including TC and FC, where appropriate, makes the equation easy to interpret. Note that this notation also simplifies the multi-class performance instruments. For example, the accuracy of a ternary classification is again TC/Sn.
Finally, Sn is the total of all the base measures (Sn = TP + FP + FN + TN). As specified in Axiom 3, P, N OP, ON, TC, and FC are pairwise and Sn is the overall summation of confusion matrix elements.
Canonical Form and Formal Instrument Categorization
This subsection proposes and defines a formal logic that determines whether a given equation of a performance evaluation instrument is a ‘metric’ or ‘measure’. The first step in the proposed formal definition is to standardize the equations satisfying Axiom 4. In canonical form, the equations are expressed with the base and first level measures (namely TP, FP, FN, TN, P, N, OP, ON, TC, FC, and Sn) that are also called “canonical measures” in this study.
For example, MCR = FC/Sn and F1 = 2TP/(2TP + FC) are expressed in canonical form. Note that any part of the given equations matched in the where clause of the definition above must be reduced into its complete form (P, N, OP, ON, TC, FC, Sn) while converting an equation into canonical form (e.g., a TP + FP + FN + TN should always be reduced into Sn and likewise a remaining TP + FN into P).
Definition 1
(Canonical Form).
M is a binary-classification performance instrument expressed in the canonical form
, and where basic summaries defined in Axiom 3 are reduced for .
To find the canonical form, first, the equations should be in “base-measure form” (i.e. atomic expression in Axiom 2, expanded until all the terms are four base measures, namely TP, FP, FN, TN). Then the substitutions can be carried out according to Definition 1. As stated in Definition 2, a binary-classification performance evaluation measure expressed in canonical form has only P, N, OP, ON, or Sn base measures, or its range is infinite as imposed in semantic interpretation (i.e. numerical values with limited or no context derived from measurement).
Definition 2
(Measure/Metric).
M is a binary-classification performance ‘measure’ if it can be expressed in the canonical form where and ( or ()).
Otherwise, M is a ‘metric’.
The first condition states that an instrument consisting of only any of P, N, OP, ON, or Sn is a ‘measure’. P, N, and Sn, which are even available before a classifier is modeled, depend on datasets (i.e. they are numerical values with no performance context). In contrast, OP and ON show the pure outputs of a classifier (i.e. numerical values with limited performance context). An instrument in canonical form that has any of four base measures (TP, FP, FN, and TN) and two diagonal 1st level measures (TC and FC), represent the performance context. However, if the range of the instrument is unlimited, it is a ‘measure’ as dictated by the second condition because the precision is fine, and interpretation is challenging, as depicted in Fig. 1. For example, PREV = P/Sn and NER = N/Sn are measures because their domains are equal to {P, Sn} and {N, Sn}, respectively, whereas is still a measure even though dom(OR) = {TP, FP, FN, TN} {P, N, OP, ON, Sn} because the interval of OR is left-bounded, i.e. [0, ∞). is a metric because neither dom(G) is a subset of {P, N, OP, ON, Sn} (because of TP and TN) and nor its interval is unbounded (range(G) = [0, 1]).
Comparison with Measures and Metrics in Mathematics
Performance measures and metrics defined formally above have similarities with measures and metrics in mathematics. Measure in mathematics is a function (μ) from Σ (an σ-algebra over a set X) to affinely extended real numbers () like performance measures. Various types of measures are defined according to different properties or conditions, such as negativity, intervals, empty sets, additivity, and monotonicity properties. 26 of 29 performance measures correspond to mathematical (positive) measures. “Signed measures” do not require negativity. Only DET, DPR, and DP are identified as signed (±) measures in (− ∞, ∞).
Canonical performance measures (X in Definition 1, e.g., TP and P) correspond to “counting measures”, another type of measure in mathematics (i.e. number of elements (cardinality), a function to natural numbers: ). The performance measures in [0, 1] for a specific aspect of classification datasets, namely class or outcome ratios (e.g., PREV or BIAS), class or outcome entropies (HC vs. HO), and chance factor (CKc), correspond to “finite measures” (for example, a probability measure in [0, 1] yielding 0 for empty sets and its entire measure (probability) space is 1). Additivity is determined by two operations on subsets in X, namely “union”: and “sum”: . A measure is “countable additive” when union = sum, “subadditive” when union ≤ sum, and “superadditive” when union ≥ sum. For example, PREV satisfies “subadditivity” for two datasets (e.g., Sn = 20): dataset1 with samplei (i = 1, …, Sn/2 = 10) and dataset2 with samplei (i = 11, …, Sn = 20).
We evaluated all performance measures for two datasets and observed that all canonical performance measures satisfy “countable additivity” and the remaining performance measures, except signed ones, satisfy “subadditivity” (see “Measures and additivity” worksheet in the online PToPI file). The additivity of DET, DPR, and DP signed measures is nondeterministic (subadditive, countable additive, or superadditive like the determinant of nonnegative Hermitian matrices).4 The measure values of the sub-datasets might cancel out each other. Canonical measures satisfy all five properties with the countable additive property.
Mathematically, metrics are defined as a distance function D between pairwise elements in a set. Both metrics and performance metrics are in a bounded interval [a, b] where 0 ≤ a < b < ∞.5 However, performance metrics correspond to “similarity functions” as an inverse of (distance) metrics (e.g., S = 1 − D) in mathematics (how similar are classification labels and class labels?). Performance metrics can be expressed as a similarity function S(o, c) between ground-truth (c) and prediction (o, classifier’s outcome) for all the binary examples (i = 1, …, Sn) in a dataset where ci and oi ∈ {0 for positive and outcome positive, 1 for negative or outcome negative}.
The maximum similarity or the minimum distance (dissimilarity) is the better performance (e.g., ACC = 1). Error or loss metrics such as FPR, FNR, FDR, FNR, and MCR, described in “Instrument complement”, as well as probabilistic instruments, are directly distance metrics (D) in mathematics. As described in “Semantic/formal definitions and organization of performance evaluation instruments”, binary similarity measures are a well-studied domain historically in the literature where a fourfold table is used to calculate the similarity/distance between two binary vectors in a convenient manner instead of the comparison of pairwise elements.
The conventional notation concerning binary classification is a = TP, b = FP, c = FN, and d = TN. As addressed in Ref. [26], binary-classification performance metrics had been studied as similarity coefficients, for example, ACC by Sokal and Michener (1958) and Rand (1971), F1 by Gleason (1920), Dice (1945), and Sørenson (1948), CK by Cohen (1960), and MCC by Yule (1912) and Pearson and Heron (1913).
Three axioms are defined for mathematical metric definition:
-
(i)
identity of indiscernibles: D(o, c) = 0 ⇔ o = c,
-
(ii)
symmetry: D(o, c) = D(c, o)), and
-
(iii)
subadditivity or triangle inequality: D(o, c) = D(o, x) + D(x, c).
Performance metrics either satisfy all three axioms (e.g., ACC) or the first and second axioms (“semimetrics” in mathematics, e.g., F1, CK, and MCC). Probabilistic error metrics correspond to Euclidian distance in mathematics (e.g., MAE and its variants are Euclidian distance whereas MSE and RMSE are squared Euclidean distance).
Probabilistic error measures are not metrics in mathematics. MRAE and its variants are not symmetric (exchanging ci ↔ pi, see Eqs. (B.pi, B.piii, and B.piv) and relative absolute error measure equations in Appendix 2). LogLoss is not a mathematical metric because it does not satisfy the first axiom completely (LogLoss = 0 for ci = pi = 1, but LogLoss is undefined for ci = pi = 0). LogLoss > 0 for ci = 0 ≈ pi. For example, LogLoss = 6.64 (➝∞) for ci = 0 and pi = 0.01 (➝0+) whereas MSE = MdSE = 0, RMSE = MAE = 0.01 (➝0+), and nsMAPE = 1. Note that probabilistic metrics such as MAE, MSE, and RMSE in binary classification that are in [0, 1] are usually expressed in a right-open interval [0, ∞) in regression for convenience. Nevertheless, they become bounded according to the dependent variable’s range.
Comparing a classification and a regression model on the weather temperatures on Earth, which range ± 40 °C (100 °F to − 40 °F) annually, for example. The binary scoring classifier with “cold” (0) and “hot” (1) labels yield minimum 0 and maximum 1 absolute errors (ci ∈ {0, 1}, pi [0, 1]). The regression classifier yields a minimum of 0 °C/°F and a maximum of 80 °C (140 °F) absolute errors (a threshold, for example, 20 °C/68 °F, could be used to categorize the scalar outcomes into cold and hot labels). Even MRAE and LogLoss also measure the same classification error; they have a right-open interval in both (binary) classification and regression because of the nature of their summary functions. As addressed by the practitioners, the interpretation of probabilistic performance measures is not convenient, comparing the metrics [68].
The performance measures with open intervals, namely DPR, LRP, LRN, DET, LIFT, OR, DP, MRAE, and LogLoss, violating the first condition in Definition 2 (i.e. having at least one canonical measure different from {P, N, OP, ON, Sn} such as base measures, TC, and FC) are not used in the literature for performance evaluation, comparison, and publishing for different classifiers because they are not easy to interpret (unbounded and having non-linear distribution). The attempts to categorize their unbounded range are subjective, indecisive, and not accepted by the literature (e.g., DP [10], OR [69, 70], LRP/LRN [71]). They have domain-specific usages to reflect the specific aspects of the classifiers.
We propose measure/metric categorization of instruments consistent with the mathematical definition and semantical interpretation of ‘measures’ and ‘metrics’ to clarify the terminology as well as enhance the initial interpretation of the instruments. Metrics can be directly and conveniently used for performance evaluation, whereas measures are auxiliary to evaluate other factors such as datasets. Of the 57 performance instruments covered, almost half of them are measures and half of them are metrics.
Instrument Geometry
Figure 2a depicts the following geometry of the 1st level measures defined above:
P and N are column types (total of elements in vertical cells in confusion matrix) that are related to ground truth only.
OP and ON are row types (total of elements in horizontal cells) related to prediction only.
TC and FC are mixed types (total of elements in diagonal or off-diagonal cells).
Sn is mixed geometry and does not affect determining geometry type when it is involved in other instruments’ equations. In this study, we extend this column/row geometry to any performance instrument apart from canonical measures via Definition 3.
Figure 2b depicts the geometries of all the measures and metrics that are determined via Definition 2. The figure is used as a starting point for the proposed exploratory table to position the different instruments in the table layout. Note that pale and dark solid edges represent geometry types, as depicted in the “Box edges” group as described in “Interpretation of PToPI visual design elements”. In our survey, 26% of the studies published column-geometry metrics (e.g., TPR, TNR, FPR, or FNR). 19% published true-classification-only metrics (i.e. having TP or TN, e.g., TPR, TNR, PPV, NPV, or ACC). Interestingly, 3% published FPR with FNR, which is a subset of false-classification-only metrics (the other one is MCR).
Definition 3
(Column, Row, and Mixed Geometry).
M is a binary-classification performance instrument expressed in a canonical form where
The geometry of M is ‘column’ (depicted as )
if and
The geometry of m is “row” (depicted as )
if and
Otherwise, the geometry of M is ‘mixed’ (depicted as ).
Figure 2c depicts the possible confusion matrix examples for probabilistic error/loss performance measures. The classifier labels both the first and second examples as positives with a score greater than the decision boundary. Nevertheless, the second one is a negative example (i.e. false positive). Likewise, the third example is misclassified as negative (i.e. false negative) even if the classifier’s score falls under the threshold. As described in “PToPI: an exploratory table for binary-classification performance evaluation instruments”, those instruments give a score (pi) about the labeling predictions for the actual class of the example (ci). Figure 2d lists the corresponding calculations for each example for LogLoss and MAE, which is a variant of MSE. Note that the parts yielding zero in the pairs of the sum function in LogLoss are not shown for the sake of simplicity. The evaluation of each case in both measures shows that probabilistic error/loss instruments measure;
either uncertainty/type-II-error in P, namely FN (like FNR = FN / P)
or uncertainty/type-I-error in N, namely FP (like FPR = FP / N).
Fig. 2.

The origin of laying out of performance evaluation instruments in PToPI and probabilistic error/loss instruments for four samples labeled as one TP, FP, FN, and TN
This reveals that the measures are a typical mathematical function for FPR and FNR like (FPR + FNR)/2, which is also examined in “Instrument complement”. The instruments are column-geometry because their domains {P, N} satisfy the first condition in Definition 3.
Transforming Geometry: Instrument Duality
The extended geometry divides classification performance instruments into two orthogonal dimensions besides the mixed ones: column (ground-truth only) vs. row (prediction only). This approach brings about transformations in corresponding instruments expressed in Definition 4.
Definition 4
(M*, Duality).
M is a binary-classification performance instrument expressed in a canonical form, where and the geometry of M is “column”, “row”, or “mixed”. The dual of M, M* is produced by
if the geometry of M is “column” (),
if the geometry of M is “row” (), or
if the geometry of M is “mixed” (),
where , , and .
Essentially, duality is to transform one concept into another concept in a bilateral manner. It could be perceived as an interchanging antecedent and consequent [8]. A transformation via switching column to row geometries and vice versa corresponds to ground-truth versus prediction perspective change. The introduced transformation via duality facilitates researchers to see the special relations in corresponding instruments. A dual of a column/row type instrument is formed by swapping between {P} and {OP} and between {N} and {ON}, respectively. For instance, TPR = PPV* and PPV = TPR* (dual metrics) or HC = HO* and HO = HC* (entropy-based dual measures). As seen in the examples, the symmetry (involution) is valid for duality ( and , i.e. if is the dual of , then is the dual of ). The duality is essential for two dual concepts or dimensions where a mapping identified in one can be transferred into the other by duality. For example, a function (f) of two column-geometry instruments ( and ) could be transformed or sought in their corresponding dual (row-geometry) instruments ( and ) as described below:
| 1 |
For example, LRP is a mapping between TPR and TNR. The dual of LRP = TPR/(1 – TNR) is TPR*/(1 – TNR*) = PPV/(1 – NPV), which is not a common instrument in existing classification performance evaluations. It is called “relative risk” which is mainly used in statistics, epidemiology, clinical research, and diagnostic tests [72]. The relation revealed by duality can connect classification performance evaluation with these domains. The example given for LRP is related to the transformations of the column- or row-geometry instruments. As for mixed geometry, duality transformation of high-level mixed-geometry instruments reveals different dependencies (note that the dual of a mixed type instrument is equal to itself as expressed in the third condition of Definition 4). For instance, the following transformation of mixed-type ACC from Eq. (2) showing PREV dependency further reveals BIAS (the dual of PREV) dependency of ACC:
| 2 |
| 3 |
| 4 |
Increasing prevalence leads to a higher performance value in terms of ACC, as shown in Eq. (2), which also causes a higher bias, as shown in Eq. (4). However, dual instruments should be interpreted correctly. For example, Powers’ statement that the goal of the classification model is achieving the equality of dual instruments such as PREV = BIAS, TPR = PPV, or TNR = NPV should be clarified by adding “in the highest possible metric values” constraint (e.g., TPR = PPV = TNR = NPV ≈ 1.0) [8]. Because a random classifier yielding the base measures equal (e.g., TP = FP = FN = TN = 50) also satisfies all these three equalities. The duals of column-geometry probabilistic error/loss measures depicted in Fig. 2c and d switch ground-truth measures (P and N) to the prediction measures (OP and ON), see Appendix 2 for their equations. They are similar to (FPR* + FNR*)/2 = (FDR + FOR)/2 but not common in the literature.
Instrument Complement
Binary-classification performance metrics and some measures are normalized ratios having bounded intervals, such as [0, 1] (also known as the unit interval) or [− 1, 1]. The complement of those instruments is defined below. For instance, TPR is a metric M, which has an interval [0, max(M) = 1], the complement of TPR is . Likewise, INFORM is a metric M, which has an interval [min(M) = − 1, max(M) = 1].
Definition 5
().
M is a binary-classification performance instrument where . The complement of the M is , where
The second condition is given for the sake of completeness because there is no well-known instrument having zero and negative values (e.g., interval [− 1, 0]). Complements are useful.
to simplify equations,
to change the performance perspective (from a positive class perspective to a negative one (e.g., TPR to FNR or PPV to FDR), or
to switch focus on correctness to both error types (I and II) (i.e. ACC to MCR).
Without any complements and duals practically observed in the literature, all probabilistic error/loss measures focus on classification errors (type I/II) or losses.
As an example of the third condition in Definition 5,
The complement of INFORM in [− 1, 1] is simply − INFORM,
However, the complement of normalized INFORM in [0, 1] is 1 − ((INFORM + 1)/2) = (2 − (TPR + TNR − 1 + 1))/2 = (FPR + FNR)/2.
The former is not a common metric whereas the latter (mean false positive/negative rates or mean type I/II errors) is similar to the probabilistic error/loss measures interpreting the errors for both classes (e.g., mean absolute error). Note that zero–one loss complement metrics (e.g., MCR, FPR, FNR, FDR, and FOR) along with probabilistic error/loss instruments are negatively oriented (i.e. negative performance where zero is the best).
HC and HO entropy-based instruments measure the uncertainty associated with given distributions of PREV and BIAS, respectively, along with their corresponding complements (i.e. 1 − PREV and 1 − BIAS). In comparison to duality, reporting an instrument along with its complement does not provide extra information. This redundancy in performance reporting (i.e. reporting both a metric and its complement) is occasionally observed in the literature. Out of 51 surveyed studies reporting classification performance, 16% have redundant metrics, namely TPR with FNR (14%), TNR with FPR (12%), and ACC with MCR (2%).
Class Counterparts
Class-specific instruments have counterpart instruments that are defined per class (positive class only and negative class only). For example, TPR and TNR are class counterparts. The former is for positive classes and the latter is for negative classes. Likewise, FNR and FPR, the complements of TPR and TNR, are class counterparts. The other examples are PPV with NPV (and their complements, FDR with FOR) and LRP with LRN. Not all counterpart relations are common. For example, the counterpart of PREV (PREV = P/Sn) is NER (NER = N/Sn), which is not commonplace in the literature. However, the counterpart of BIAS (BIAS = OP/Sn) (i.e. ON/Sn) or the counterpart of F1 (i.e. 2TN/(2TN + FC)) is not used at all. Counterparts are also applicable in multi-class performance evaluations above binary classification. Generic examples of n-ary classification are also provided in “Summary functions”.
Duality, complementation, and class counterparts together help to identify the characteristics of performance instruments. For example, in Eq. (B.23) can be re-formulated as and , which is easier to interpret and extendable to multi-class (X ∈ {‘P’, …, ‘N’}).
More Geometries: Dependencies, Levels, and High-Level Dependency Forms
Performance instruments can be expressed in terms of others in numerous ways. For example, in addition to Eqs. (2)–(4), Eq. (5) reported by Powers that expresses ACC in terms of BIAS/PREV and INFORM metrics can be transformed into Eq. (6) in terms of BIAS/PREV and MARK metrics [8].
| 5 |
| 6 |
However, such expression derivations (i.e. equivalent form) are exhaustive and might be confusing. Therefore, we suggest a leveling approach based on high-level dependencies among the existing instruments to simplify their summarization relationships and interdependencies. We prepared a dependency graph among binary classification instruments. Figure 3 shows partial views of the dependency graph. We use high-level equation forms (i.e. substituting instruments other than base level measures/metrics and 1st level measures) where possible to identify direct dependencies. Otherwise, the dependencies are calculated based on the equations in canonical form. For example,
TPR, TNR, PPV, and NPV metrics and their complements depend on canonical measures. Therefore, they are considered base metrics
INFORM depends on TPR and TNR; MARK depends on PPV and NPV base metrics. Therefore, they are 1st level metrics.
shows that MCC has direct dependencies on INFORM and MARK 1st level metrics at a high level. Therefore, MCC is a 2nd level metric.
Beyond the well-known ones, the literature rarely examines the instrument equations with different expressions like in Eqs. (2)–(6). Press, for example, found the equivalent form of PPV and NPV by expressing them with TPR and TNR [73]. Sokolova et al. expressed INFORM and DP in terms of LRP and LRN [10]. The high-level dependency reveals another kind of redundancy observed in performance evaluation publications (i.e. reporting a metric with its direct dependencies). For example, out of 51 surveyed studies reporting classification performance, 27% published F1 along with the two direct dependencies (the harmonic mean of TPR and PPV).
Upper-Level Measures (the 2nd and 3rd Level Measures) and Metrics Leveling (the Base, 1st, and 2nd Level Metrics)
As a result of applying the leveling approach described above, measures have four levels and metrics have three levels, including base levels. The complete list of levels and corresponding instruments is listed in Appendix 1 in alphabetic order.
Summary functions
High-level metrics summarize the dependent metrics into a single figure, as listed in Table 4. In parametric instruments such as wACC or Fβ (see Eqs. (B.18) and (B.21.1) in Appendix 2), the summary function depending on two or more instruments can be adjusted according to the importance given to each dependent [37]. For example, wACC puts more weight on one of the high-level dependent metrics TPR and TNR, as shown in Table 4.
Table 4.
The instruments’ summary functions and their class counterparts or dual high-level dependencies
| Instrument | Summary functions | High-level dependencies | |
|---|---|---|---|
| Column geometry | Class counterparts (positive vs. negative) | ||
| INFORM | Addition | TPR | TNR |
| BACC | Arithmetic mean | TPR | TNR |
| G | Geometric mean | TPR | TNR |
| wACC | Weighted mean | TPR | TNR |
| Mixed geometry | Duals (column vs. row) | ||
| nMI | MI / Arithmetic/geometric means or minimum/maximum of | HC | HO |
| MI / joint (HOC) | – | – | |
| Fβ | Weighted harmonic mean | TPR | PPV |
| MCC | Geometric mean | INFORM | MARK |
| Probabilistic error instrumentsa | |||
| ME, MSE, RMSE, MdSE, SSE, nMSE (in five variants), MAE, MdAE, MxAE, GMAE, MRAE, MdRAE, GMRAE, RAE, RSE, MPE, MAPE, MdAPE, RMSPE, RMdSPE, sMAPE, nsMAPE, nsMdAPE, MASE, MdASE, RMSSE, and LogLoss | |||
| Summary functions | |||
| Normalized/Symmetric/Root/Geometric mean/Mean/Median/Max/Sum/Square(d)/Relative/Absolute/Percentage/Scaled + ‘Error’ along with Logarithmic function for LogLoss | |||
The equations are given in Appendix 2
aTotal of 31 probabilistic error instruments are reviewed. More details are provided in the online PToPI spreadsheet
High-level dependency and summary functions are key to understanding the properties of performance instruments. In information retrieval, for instance, the single metric properly summarizing dual TPR and PPV metrics is Fβ parametric metric (usually F1 where β = 1). Because the datasets available for information retrieval are extremely skewed (over 99% of the documents are irrelevant), some metrics, especially ACC, are not appropriate.
Using harmonic mean in F1 as a summary function instead of simple arithmetic/geometric means suppresses the extreme performance values in cases where PPV is exceedingly high (e.g., by returning all documents for a specific query) [74]. Note that β > 1 emphasizes PPV and type I error whereas 0 < β < 1 emphasizes TPR and type II error.
Leveling not only allows the researchers to distinguish similar instruments from a large number of instruments but also shows the dependencies among levels and their summarization degree. For example, MCC depends on and summarizes the 1st level metrics that depend on and summarize the base metrics. Table 5 summarizes complementation, duality, and class-counterpart concepts applicable to the reviewed performance instruments.
Table 5.
Summary of the concepts for the instruments with column/row geometry and suggested notation and naming for multi-class classification instruments (3-ary, 4-ary, …, n-ary classification)
| Concept | For measures | For metrics | |||
|---|---|---|---|---|---|
| Complements | Positive | Negative | Success | Failure | |
| PREV | NER | TPR | FNR | ||
| TNR | FPR | ||||
| PPV | FDR | ||||
| NPV | FOR | ||||
| ACC | MCR | ||||
| Duals | Column | Row | Column | Row | |
| PREV | BIAS | TPR | PPV | ||
| HC | HO | TNR | NPV | ||
| INFORM | MARK | ||||
| Class Counterparts | Positive | Negative | Positive | Negative | For n-ary classification (e.g., class "X") |
| LRP | LRN | TPR | TNR | TXR (True X Rate) | |
| FPR | FNR | FXR (False X Rate) | |||
| PPV | NPV | XPV (X Predictive Value) | |||
| FDR | FOR | FPXR (False Predictive X Rate) | |||
PToPI: An Exploratory Table for Binary-Classification Performance Evaluation Instruments
We designed a compact exploratory table for a total of 57 binary-classification performance evaluation instruments. The table is the pictorial specification or blueprint of instruments from multiple perspectives covering all the proposed concepts that we described and formally defined in “Conclusion and discussion”. Figure 4 and online Fig. C.1 show its plain (simplified) and full view versions, respectively.
PToPI Design Methodology
The proposed exploratory table is designed with the following methodology:
Reviewing the literature to compile the instruments and related information such as alternative names and equations;
Equations are converted into different forms where possible, such as canonical form (Definition 1) and high-level dependency form (see “More Geometries”);
Measure and metric categories are identified by canonical form equations (via Definition 2);
Geometry types are determined as “column”, “row”, or “mixed” (via Definition 3);
A dependency graph is prepared to formulate the levels and discover the similarities and dependencies (see dependency graph in Fig. 3);
The determined levels and dependencies along with the geometry types are used to position and level the measures/metrics around base measures shown in a 2 × 2 contingency table;
Entropic instruments are noticeable by positioning them beneath or right of the base measures;
After the layout is completed, the dual and complement of measures/metrics are determined (via Definitions 4 and 5, respectively);
Unique background colors are used to distinguish measures (grey) and metrics (gold) along with their levels (shades of grey or gold color);
Geometry is depicted by dark and pale (greyed-out) lines (pale bottom/top edges for column geometry, pale left/right edges for row geometry, and all dark for mixed geometry, see Table 6);
Measures and metrics are separately numbered according to levels and dependencies from the innermost (measures are underlined). Within each level, the numbers are assigned from column to row and mixed geometry and from positive to negative class dependencies. Graphical-based metrics and probabilistic instruments are numbered separately with ‘g’ and ‘p’ prefixes, respectively;
Instrument abbreviations, names, and alternative names (for common instruments) are displayed. The metrics in the [− 1, 1] interval is indicated in name via a ‘±’ suffix (e.g., ‘MCC ± ’).
The complement pairs are displayed only for the instrument indicating classification errors (e.g., is shown in FDR where 0 is the best performance value, but is not shown in PPV);
Dual instrument pairs are stated (e.g., INFORM* is shown in MARK and vice versa);
For the full view:
The error types, if exist, are indicated (type I: I, type II: II, and type I/II errors: I/II);
Instrument value intervals (other than [0, 1]) and whether an instrument yields not-a-number (i.e. 0/0) are calculated and indicated by “NaN” (i.e., instruments yield not-a-number in extreme cases, e.g., on datasets without any positive samples where P = 0); and
Equations are displayed per instrument.
Table 6.
Descriptions of the visual design elements used in PToPI

Note that Appendix 2 also suggests corrections for common performance metrics to avoid indeterminacies.)
Interpretation of PToPI Visual Design Elements
Table 6 lists the visual design elements employed in PToPI to represent the properties of individual instruments or instrument categories. The full view also presents abbreviated names, full names, alternative names, and particular attributes of measures and metrics such as error types, whether having not-a-number value (i.e. no 0/0), intervals that are different from [0, 1].
Recall that the names of measures with integer values are written in bold, as shown in Table 3. Measures are numbered with underlined text. The instruments above or below the confusion matrix frame are the column-geometry type with only these dependencies: base measures, Sn, P, and/or N.
In contrast, the ones located on the left or right of the confusion matrix are the row-geometry type with only base measures and/or Sn but with OP, and/or ON. F0.5 emphasizing TPR is positioned closer to TPR and F2, emphasizing PPV is placed closer to PPV.
Demonstration of PToPI Usage
PToPI enables standardized specifications of a large number of performance evaluation instruments, provides terminological relations, and avoids the uninformed choice of a metric. Knowing the limitations of the instruments eliminates unnecessary performance reporting and allows for the selection of the most appropriate instruments according to specific requirements. The table is intended to be a single comprehensive reference that will be updated upon new instrument proposals. The practical use of PToPI can be described in two pillars:
Overall instrument analysis (addressing RQ.2): Seeing and comparing the relationships, differences, and similarities of all the instruments.
The proper metric choice for performance reporting and comparison (addressing RQ.3): Deciding which instruments are suitable for establishing classification models, comparing different classifiers, and reporting classification performances.
Overall Instrument Analysis
The exploratory table shows the similarities of the performance instruments. For instance, comparing INFORM and MARK dual metrics in the 1st level, three additional column-geometry metrics are shown near INFORM, namely BACC, wACC, and G. However, the duals of those additional metrics corresponding to row geometry are not present near MARK. For example, there is no metric taking the arithmetic mean of PPV and NPV like BACC (arithmetic mean of TPR = PPV* and TNR = NPV*). No metric in row geometry is found that corresponds to G taking the geometric mean of the dependents (i.e. geometric mean of PPV and NPV). Probabilistic error/loss measures are located near INFORM, because they are similar to the normalized complement of INFORM (i.e. (FPR + FNR)/2) as described in “Instrument complement”. The reason for the lack of dual metrics in row geometry is attributed to the fact that performance metrics based on the prediction of a classifier (i.e. depending on OP and ON) are not as significant as the ones based on the ground truth (i.e. depending on P and N). The duals of LRP, LRN, and OR column-type measures are also missing due to the same reason. We revealed such findings that were not addressed in the literature after seeing the big picture via the developed table.
The Proper Metric Choice for Performance Reporting and Comparison
The following performance evaluation examples are compiled from different domains in the recent literature to show the practical assistance of PToPI in selecting suitable metrics in performance comparison and reporting. Note that we used those papers to reflect performance instrument choices in practical in various problem domains in the literature. Therefore, they are selected for demonstration purposes. In the examples below, we present different conventions across different domains.
Example 1: F1 is frequently used as a single metric in many domains, especially in information retrieval. Referring to PToPI, we can see that F1 is the harmonic mean of TPR and PPV, which then depends on positive-class-only measures (TP, P, and OP). While using F1 could be acceptable because of the domain requirements focusing on positive performance (i.e. excluding the negative class counterparts, namely TNR and NPV), it would be better to report a supporting metric with F1 to distinguish the negative class performance. The best alternative is TNR or NPV which is shown near TPR and PPV. Briefly, the primary metric (i.e. used as a single figure in a performance comparison and ranking of different classifiers) is F1 and the supporting metric (i.e. additional metrics used in performance reporting to indicate other perspectives) is TNR in this case. A classifier with higher performance in terms of a primary metric could have a lower performance in terms of supporting metrics.
Example 2: Another common approach in performance reporting, as shown in Table 2c, is reporting F1 along with its direct dependencies, namely TPR and PPV (e.g., in predicting hospital admissions from emergency department medical records [75]). Following the same approach above and addressing the negative class performance, F1 can be reported as the primary metric. Furthermore, TNR and one of the TPR and PPV direct dependent metrics can be published as supporting metrics. In the medical example given, PPV can be selected as a supporting metric along with F1 primary metric because PPV values are less than TPR. Thus, the lower PPV performances are also disclosed to the readers.
Example 3: Some domains prioritize false classifications (either or both FPR and FNR). For example, an intrusion detection system focuses on and reports FPR (type I error) and then FNR (type II error) along with TPR and ACC [76]. Because, high false positives can be annoying for end-users, in the example given, reporting TPR, which is the complement of FNR, is redundant. Reporting a metric (INFORM, BACC, and G groups in PToPI) above FPR and FNR is also redundant unless focusing on both error types. As an alternative to reporting ACC, a mixed geometry metric above FPR and FNR level such as CK or MCC can be used as a primary metric besides supporting FPR and FNR metrics (e.g., reporting three metrics: MCC, FPR, FNR instead of ACC, TPR, FPR, FNR).
Example 4: ad hoc increasing reported metrics does not necessarily guarantee the revelation of the superiority of a classification method. Reporting an excessive number of metrics might make comprehension and interpretation of the performance results harder. For example, an e-mail spam detection study reports performance via three base metrics, namely ACC, TPR, and PPV [77]. Besides, TNR, NPV, and G metrics are also published in detailed performance tables. Going up in one level in PToPI per reported column and row base metrics, INFORM could be reported instead of TPR and TNR, and MARK (as the dual of INFORM) could be reported instead of PPV and NPV. There is no need to report G because it is similar to INFORM. Reporting MCC is also appropriate by not only summarizing INFORM and MARK dependents but also including FP and FN. Hence, three metrics (MCC as the primary metric and INFORM and MARK as the supporting metrics) are sufficient for this example of performance comparison and reporting instead of six metrics.
Example 5: Another performance reporting example that classifies “code smells” (issues in software codes potentially causing error or failure) reports ten instruments: ACC, TPR, TNR, FPR, FNR, PPV, TPR, F1, PREV, and NER. As shown in PToPI, three instruments are redundant: FPR, FNR, and NER. From a class-balanced performance view (covering both positive and negative classes), CK or MCC can be used instead of ACC and F1 along with supporting INFORM. PREV should also be reported as a supporting instrument indicating a class imbalance in datasets. Hence, four instruments (either CK, F1, and INFORM or MCC, F1, and INFORM along with PREV) can be reported instead of ten. Supporting instruments can be further taken into account where ACC and F1 yield the maximum performance (1.000).
Example 6: The last example extends the reporting of Example 2 (F1 with TPR and PPV) with a probabilistic error/loss measure (LogLoss) where five ML models classify SARS-CoV-2 (COVID-19) via the early-stage symptoms [78]. Because both LogLoss and TPR are column-geometry instruments, the other direct dependent of F1, namely PPV with row geometry, can be distinguished. Hence, three instruments, namely F1 as the primary metric along with LogLoss and PPV supporting instruments, could be reported instead of four instruments.
Above examples showed that researchers need assistance on metrics selection. PToPI can provide a visual guidance on selecting proper and sufficient metric(s) in classification performance evaluation and performance reporting in the literature. Specifically;
Avoiding redundant metric reporting via dual metrics and/or direct dependencies (for example, publishing F1 with or without TPR or PPV instead of F1 with TPR and PPV)
Avoiding redundant metric reporting via false classifications (for example, publishing TPR or FNR instead of TPR and FNR)
Reporting most representative metric instead of several similar metrics (for example, publishing MCC instead of INFORM, G, and/or BACC)
Conclusion and Discussion
This study presents a multi-perspective analysis in the literature to review a large number of binary-classification performance evaluation instruments (29 measures and 28 metrics, a total of 57 instruments or 69 instruments, including variant and parametric ones) in detail. It initially proposes a holistic set of novel formally defined concepts to identify the intrinsic properties of any performance instrument and to reveal the relationship among the instruments. Second, it introduces a new exploratory table to represent all the instruments, their properties, and their relationships. The study covered the graphical-based performance metrics (AUCROC and AUCPR), the instruments based on the probabilistic interpretation of classification error and entropy-based instruments as well as the instruments derived from the confusion matrix. To present all the instrument alternatives, we included and analyzed the metrics that have been recently recommended by the literature, such as CK, G, MCC, or nMI [52, 79–81].
The paper aimed to shed light on the properties of performance instruments, which have been in use in different domains, along with their differences and similarities. The instruments are the means of comparing the performances of different machine learning algorithms applied to different datasets [82]. Considering a few research in the literature reviewing a small number of instruments by focusing on a few issues such as the class imbalance effect causing biased performance metric values [16], this study is also the first systematic, self-consistent, and solid attempt in the literature to bring out standardization in describing performance instruments via formally defined novel concepts and to clarify overall terminology.
Although the analysis of metric behaviors under dataset irregularities such as class imbalance or label ambiguity is out of scope of this paper, we provide additional insights here by reviewing the PToPI with respect to the results of a comprehensive benchmark of performance metrics called BenchMetrics [30]. BenchMetrics analyzed and compared the robustness of fifteen binary classification performance metrics based on eighteen criteria including class imbalance, which revealed that MCC, BACC, INFORM, CK, and MARK are the most robust five metrics. When we evaluate those robust metrics and the findings of BenchMetrics with PToPI perspective, we can draw the following inferences and relations:
The most robust metric MCC is also the only 2nd (the highest) level metric in PToPI (MCC is distinctively located at the top left of PToPI).
The remaining most robust metrics, namely BACC, INFORM, CK, and MARK are also the 1st level metrics in PToPI.
The least robust metrics (e.g., TNR, TPR, NPV, and PPV) are the base (the lowest) level metrics in PToPI.
Above three findings suggest that the metrics in higher level in PToPI are more robust in BenchMetrics (see Table 10 in BenchMetrics [30]) than the ones in lower level.
Considering class imbalance effect on metrics, BenchMetrics provide two benchmarking criteria: Meta-metric-2 Class imbalance uncorrelation (UIMBucor) and class imbalance uncorrelation in stratified random and random synthetic classifiers. For the former, BenchMetrics measured that PPV, NPV, F1, nMI, CK, and G are correlated with class imbalance in some degree indicating a caution to use in class imbalanced datasets. For the later, BenchMetrics identifies that TPR, TNR, PPV, NPV, ACC, G, and F1 (base and 1st level metrics in PToPI) are directly affected by class imbalance (see Fig. 6 in BenchMetrics [30]).
The inferences and relations above suggests a future work for us to indicate or put a reference of the core findings of BenchMetrics in each performance metric (such as class imbalance sensitivity or robustness rank) so that user will be aware of those robustness issues. As a future work, the potential relations will be investigated between the level positioning of metrics in PToPI and the robustness rank of the metrics found in BenchMetrics.
Generally, the instruments used in established domains such as information retrieval are well founded and have become de facto standards. However, in emerging domains or interdisciplinary topics, choosing the right metrics for performance evaluation, comparison, and reporting might be challenging. We have initially shown that the variation in reported instruments is quite high in the mobile-malware classification problem domain via a systematic literature analysis. The selected metrics and the combination of metrics reported per study are highly diverse within a specific domain. The researchers reported one to seven metrics among the limited customary alternatives (i.e. TPR, FPR, ACC, PPV, and F1, from the most to the least reported one). In this study, we specifically addressed three research questions explained in “Research questions”:
RQ.1. How can we differentiate performance instruments semantically and formally?
Studying whether all the performance instruments derived from a confusion matrix are the same:
We semantically and formally differentiated ‘performance measures’ and ‘performance metrics’ that were often used interchangeably in the literature.
We further examined that the proposed categorization is consistent with ‘measure’ and ‘metric’ definitions in mathematics.
The new categorization allows us to distinguish, for example, ACC or F1 as a ‘metric’ whereas PREV and BIAS as a ‘measure’ reflecting class imbalance in ground-truth and prediction, respectively. Such categorization will avoid the possible terminology confusion around ‘performance measures’ and ‘performance metrics’, which is widely observed in the literature. Hence, this study has made a clear distinction between performance ‘measures’ and ‘metrics’ in a semantic sense supported by a formal definition. We recommend researchers use performance ‘instruments’ to refer to them generically. The suggested terms and notation summarized in Tables 3 and 5 are more explicit and extendible to multi-class classification (e.g., in ternary classification: TXR for class ‘X’, TYR for class ‘Y’, and TZR for class ‘Z’). These definitions and terminological clarification will establish a common performance evaluation language among the researchers.
Considering the terms referring to individual instruments, we observe that alternative terms are still emerging, particularly in new domains. For instance, in remote sensing, the metrics that are referred to as ‘producer’s accuracy’, ‘user’s accuracy’, ‘errors of commission’, and ‘errors of omission’ are the one-versus-all form of TPR, PPV, FNR, and FDR where ‘P’ is the class of interest and ‘N’ is for all the other classes.
RQ.2 How can we formally identify the properties of binary-class performance instruments and their similarities, redundancies, and dependencies?
Addressing the second research question, we proposed a formal way of expressing performance instruments, which shows their intrinsic properties and any relationship between them. The contributions can be expressed in the following headings:
Axioms: Four axioms, namely “atomicity”, “atomic expression”, “basic summary”, and “performance instrument expression,” are defined in “Formal definitions and organization of performance evaluation instruments” to provide a basis for our multi-perspective analysis.
Canonical form: Because there are numerous ways of expressing binary-performance instruments, which can be exhaustive, we proposed and identified a canonical form to represent the equations of the instruments.
Diagonal/off-diagonal measures: We also made use of TC (the ratio of total true or correct classifications) and FC (the proportion of overall false or incorrect classifications) measures (i.e. the sum of the diagonal and off-diagonal elements of the confusion matrix) to simplify instrument equations and enable formal analysis.
Leveling, dependency, and redundancy: A leveling scheme for each instrument category was also developed. The scheme groups the measures and metrics into the base, the first, or higher levels. It was shown that it is possible to systematically derive instruments on top of each other using the proposed leveling scheme. Hence, any dependency between them could be explicit. For instance, knowing that MCC has direct dependencies on INFORM and MARK and then INFORM has direct dependencies on TPR and TNR might help researchers to avoid using dependent measures in performance reporting redundantly.
Summary functions: The instruments were also investigated in terms of summary functions such as arithmetic, geometric, or harmonic means, where the effects of extreme performance values can be either suppressed or not, due to the inherent calculations.
Geometry, duality, complementation, and class-counterpart relations concepts: We defined a geometry concept (column, row, and mixed geometries) for performance instruments. This concept, along with the canonical form, enabled us to establish duality, complementation, and class-counterpart relations of the instruments, which simplified the interpretation and expressions of the instruments. Besides, we achieved to show various mappings between the instruments. For instance, TPR (the ratio of TP to P) and its dual PPV (the ratio of TP to OP) measure the performance of the ground-truth class and prediction class, respectively. Redundancy in performance reporting such as TPR and FNR together (TPR = 1 – FNR) can also be spotted using complementation concepts.
Parametric instruments and instrument variants: This study also highlights subtypes of instruments such as parametric metrics (Fβ with β parameter and wACC with w parameter) and metric variants (nMI with arithmetic, geometric, min, max, and joint summary functions).
The role of class imbalance in performance evaluation: This study has explicitly integrated the class imbalance that is the most addressed issue in the literature into performance evaluation as a critical ‘performance measure’ for the first time. It also brings different forms of class imbalance together, namely PREV, SKEW, IMB, and NIR as well as presents BIAS as a dual measure of PREV.
RQ.3 How can we effectively select instruments in performance reporting and publication?
Considering the third research question, we presented a practical solution to increase the effectiveness of the performance evaluation process for the researchers. Because the comprehension of the proposed concepts and identifying them for all the available instruments might be complicated, we provided a new exploratory table for performance evaluation instruments named PToPI (Periodic Table of Performance Instruments), which is like the periodic table of elements, covering 29 measures and 28 metrics (total of 69 instruments including parametric ones and variants).
The exploratory table was developed by a formulated design methodology described in “PToPI design methodology” represents the multi-dimensional concepts in a single picture. Besides visualizing the proposed concepts, PToPI can help researchers to select the right ones for performance reporting among an ultimate set of instruments. In “Interpretation of PToPI visual design elements”, we also demonstrated the practical usage via the example studies from various domains in the literature.
As people are familiar with the periodic table of elements that conveys various information about the elements, our table provided online at https://github.com/gurol/ptopi can also be a powerful teaching and decision-making tool for establishing classification models, comparing different classifiers, and reporting classification performances.
The proposed concepts not only increase comprehensibility but also enable the right choice among many instruments by allowing clear identification of relationships, differences, and similarities between instruments. Qualifying performance instruments in a solid manner will avoid confusion and prevent unnecessary or excessive reporting of performance instruments observed in the literature. Proposing a conceptualization not only provides a better understanding of the fundamental aspects but also reveals the intrinsic characteristics of the instruments.
To the best of our knowledge, this is the first time that such a wide range of instruments have been reviewed in this scope. As a growing body of literature conducts isolated reviews and uses different types of instruments (either graphical [83, 84], probabilistic [55], or entropic [51]) and researchers use binary-classification instruments in multi-class classification [31, 38, 39] as well as regression and time-series forecasting applications [85], such a holistic identification and representation of those instruments is critical to see and analyze the whole as well as to adapt or transfer the knowledge and practices into those applications.
We acknowledge a limitation in our research for a case study. Although a single case study was used to demonstrate the problems of alternating and redundant instruments in performance reporting, they can still be observed in other domains. For example, the studies regarding “intrusion classification” in network security (Example 3), “e-mail spam classification” in cyber security (Example 4), and “software design defects classification” (Example 5) covered in “Demonstration of PToPI usage” were shown to have similar issues. All these findings and observations suggest that the issues are domain-independent and the results can be generalized. Our research will serve as a base for future studies exploring such issues in other domains.
In the future, the exploratory table can also be systematically evaluated in terms of usability by researchers. Besides, the validity or extendibility of proposed concepts and the table in multi-class performance evaluation instruments will be further explored and studied. The proposed approach and contributions summarized above are expected to have both theoretical and practical implications for further ML classification studies and researchers working with classification problems. Not only would they facilitate the selection of performance metrics for a classification problem domain, but also they could aid disciplines, particularly the ones that are emerging and interdisciplinary, to adapt proper instruments for performance evaluation.
Besides, the instruments developed independently in different domains are unified to enable knowledge transfer among researchers from different disciplines through an exploratory table called PToPI. Having analyzed and described the instruments from multi perspectives also provides a comprehensive insight into existing instruments for the researchers who attempt to propose a new instrument as an improved alternative. It is expected that this study and the PToPI exploratory table provided online will be a familiar complete reference and an efficient tool for researchers who evaluate, compare, and report their classifiers’ performances and contribute toward systematic classification performance evaluation and publication.
Appendix 1: Instrument Abbreviation and Name List
The list of performance instrument abbreviations (symbols) in alphabetic order per level per instrument category and their names and alternative names are given below. We suggest using the first full name (not the one in square braces) to standardize the terminology in the classification context.
PERFORMANCE MEASURES (29 measures)
(Canonicals: 11 measures: base measures and 1st level measures).
Base Measures (BM) (4 measures):
FN: False Negatives, FP: False Positives, TN: True Negatives, TP: True Positives.
1st Level Measures (7 measures):
N: Negatives, P: Positives, ON: Outcome Negatives, OP: Outcome Positives,
FC: False Classification, TC: True Classification, Sn: Sample Size.
2nd Level Measures (11 measures):
BIAS: Bias, CKc: Cohen's Kappa Chance, DET: Determinant,
DPR: D Prime, IMB: (Class) Imbalance, LRN: Negative Likelihood Ratio, LRP: Positive Likelihood Ratio, NER: Null Error Rate, NIR: No Information Rate (non-information rate), PREV: Prevalence, SKEW: (Class) Skew.
Probabilistic error/loss measures (2 measures):
LogLoss (binary cross-entropy), MRAE (MdRAE / GMRAE): Mean (Median/Geometric Mean) Relative Absolute Error.
3rd Level Measures (5 measures):
DP: Discriminant Power, HC: Class Entropy, HO: Outcome Entropy, LIFT: Lift, OR: Odds Ratio.
PERFORMANCE METRICS (28 metrics)
Base Metrics (14 metrics):
ACC: Accuracy (efficiency, rand index), CRR: (Correct) Rejection Rate, DR: Detection Rate, FDR: False Discovery Rate, FNR: False Negative Rate (miss rate), FOR: False Omission Rate (imprecision), FPR: False Positive Rate (fall-out), HOC: Joint Entropy, MCR: Misclassification Rate, Zero–One Loss (normalized), MI: Mutual Information, NPV: Negative Predictive Value, PPV: Positive Predictive Value (precision, confidence), TNR: True Negative Rate (inverse recall, specificity), TPR: True Positive Rate (recall, sensitivity, hit rate, recognition rate).
1st Level Metrics (13 metrics):
Confusion-matrix derived metrics (8 metrics): BACC: Balanced Accuracy (strength), CK: Cohen's Kappa (Heidke skill score, quality index), F1: F metric (F-score, F-measure, positive specific agreement), (Fm: F-metrics for all weights, F2, F0.5, and Fβ: F metric with weight 2, 0.5 and β), G: G metric (G-mean, Fowlkes-Mallows index), INFORM: Informedness (Youden’s index, delta P', Peirce skill score), MARK: Markedness (delta P, Clayton skill score, predictive summary index), nMI: Normalized Mutual Information, wACC: Weighted Accuracy.
Graphical metrics (2 metrics): AUCROC: Area-Under-ROC-Curve (ROC: Receiver Operating Curve) (GINI), AUCPR: Area-Under-Precision–Recall Curve.
Probabilistic error/loss measures (3 metrics): MSE: Mean Squared Error (Brier score), MAE/MdAE/MxAE Mean/Median/Maximum Absolute Error, RMSE: Root Mean Square Error, nsMAPE: Normalized Symmetric Mean Absolute Percentage Error.
2nd Level Metric (1 metric):
MCC: Matthews Correlation Coefficient (Phi correlation coefficient, Cohen’s index, Yule phi).
Appendix 2: Performance Instrument Equations
The equations of performance instruments are listed below as a complete reference. Equations (with complements and duals if any) are provided in high-level and/or canonical forms. Equivalent forms are also provided for some instruments.
| Measures’ Equations (underlined numbered as in PToPI) | |||||||
| (B.1) | (B.2) | (B.3) | (B.4) | ||||
| (B.5) | (B.6) | (B.7) | (B.8) | ||||
| (B.9) | (B.10) | ||||||
| (B.11) | |||||||
| (B.12) | (B.13) | (B.14) | (B.15) | ||||
| (B.16) | (B.17) | (B.18) | |||||
| (B.19) | (B.20) | ||||||
| (B.21) | (B.22) | ||||||
| (B.23) | (B.24) | ||||||
| (B.25) | (B.26) | ||||||
| (B.27) | |||||||
| Metrics’ Equations (numbered as in PToPI) | |||||||
| (B.1) | (B.2) | (B.3) | (B.4) | ||||
| (B.5) | (B.5) | (B.7) | (B.8) | ||||
| (B.9) | (B.10) | (B.11) | (B.12) | ||||
| (B.13) | |||||||
| (B.14) | |||||||
| (B.15) | |||||||
| (B.16) | (B.17) | ||||||
| (B.18) | |||||||
| (B.19) | |||||||
|
Correction: CK is undefined (NaN) due to the zero division by zero (0/0) in case of P = 0 and OP = 0 (TP = Sn) or N = 0 and ON = 0 (TN = Sn). Therefore, CK should be 1 (one) for these cases |
(B.20) | ||||||
| (B.21) | |||||||
| (B.21.1) | |||||||
| (B.21.2) | |||||||
| (B.21.3) | |||||||
| nMI variants: | |||||||
| (B.22) | (B.22.1) | ||||||
| (B.22.2) | (B.22.3) | ||||||
| (B.22.4) | (B.22.5) | ||||||
| (B.23) | |||||||
| Graphical Performance Metrics (numbered with ‘g’ prefix) | |||||||
| AUCROC: area-under-ROC-curve (TPR versus TNR) | (B.g1) | ||||||
| (B.g1.1) | |||||||
| AUCPR: area-under-PR- curve (PPV versus TPR) | (B.g2) | ||||||
| Probabilistic Error/Loss Base Equations (numbered with ‘p’ prefix) | |||||||
| (Summary Functions) | |||||||
| (B.pi) | (B.pii) | (B.piii) | (B.pvi) | ||||
| (B.piv) | (B.pv) | ||||||
|
: ground-truth class label for ith example (0 for negative, 1 for positive class), In LogLoss; scores produced by a model C for each of Sn examples, In others: : predicted class membership score where outcome is positive otherwise the outcome is negative (decision threshold ). is the arithmetic mean of class labels |
|||||||
| Probabilistic Error/Loss Measures (‘x’ in equation numbers mean “not a proper binary-classification instrument and excluded in PToPI”) | |||||||
| (B.p1) | |||||||
| (Relative absolute/squared error measures) | |||||||
| (B.p2.1) | (B.p2.2) | ||||||
| (B.p2.3) | (B.p2.3x) | ||||||
| (B.p2.4x) | |||||||
|
(Squared error measures, continued from MSE, RMSE, and MdSE squared error metrics below) |
|||||||
| (B.p1.4x) | (B.p1.5x.1) | ||||||
| (B.p1.5x.2) | (B.p1.5x.3) | ||||||
| (B.p1.5x.4) | (B.p1.5x.5) | ||||||
| Probabilistic Error Metrics | |||||||
| (B.p0x) | |||||||
| (Squared error metrics) | |||||||
| (B.p1) | (B.p1.1) | ||||||
| (Absolute error metrics) | |||||||
| (B.p2.1) | (B.p2.2) | ||||||
| (B.p2.2) | (B.p2.4x) | ||||||
| (Percentage error metrics) | |||||||
| (B.p4.1x) | (B.p4.1x) | (B.p4.1x) | |||||
| (B.p4.4x) | (B.p4.5x) | ||||||
| (Symmetric percentage error metrics) | |||||||
| (B.p3.0x) | (B.p3) | ||||||
| (B.p3.1x) | |||||||
| Probabilistic Error Metrics (Absolute scaled errors for time-series forecasting, not applicable for binary classification) | |||||||
| (B.px.1) | (B.px.2) | (B.px.3) | |||||
| Inter/intra-model complexity criteria based on probabilistic error metrics (k: number of model parameters) | |||||||
| (B.i) | (B.ii) | ||||||
Appendix 3: (Online) PToPI: Periodic Table of Performance Instruments (Full View)
The proposed binary-classification performance instruments exploratory table for a total of 57 performance instruments is provided online at https://github.com/gurol/ptopi as in two files: PToPI.xlsx spreadsheet file and ‘Fig. C.1.png’ high-resolution image file). The full view (Fig. C.1) presents all the information such as canonical or high-level dependency equations. See the legend in Table 6 for the design elements used in PToPI.
Appendix 4: Case Study (Performance Evaluation in Android Mobile-Malware Classification) Selection Methodology
The case study described in “Case study: performance evaluation in android mobile-malware classification” surveys 78 academic studies about Android malware classification from 2012 to 2018. The references are given in online Table E.1. Additional to 35 symposia, conference, and journal articles published that had already been reviewed by us, 43 articles were included using the following methodology:
Selecting the relevant journal articles by searching the IEEE academic database with having "((Android and malware) and (accuracy or precision or "True Positive" or "False Positive") and (Classification OR Detection))" words in the articles’ title, abstract, or body on 27 March 2018.
Selecting the relevant conference/journal articles by searching Google Scholar by matching the same keywords above and reviewing the first ten related articles per year from 2012 to 2018 in May 2018, excluding the patents.
Among the relevant surveyed studies, all the articles were included in performance evaluation terminology findings where available. For other statistics, only the related studies were included, as specified in Appendix 5.
Appendix 5: (Online) References of the Surveyed Studies and the Detailed Results of the Case Study in “Case study: performance evaluation in android mobile-malware classification”.
The detailed data and results are provided online at 10.17632/5c442vbjzg.3 via the Mendeley Data platform. Besides, the online Table E.1, which is provided at (AppendixE_Table_E1.pdf) at https://www.github.com/gurol/ptopi, lists the references of the surveyed studies selected by the methodology described in Appendix 4 above.
Author Contributions
GC: conceptualization, methodology, software, validation, formal analysis, investigation, data curation, writing—original draft, writing—review and editing, and visualization. TTT: validation, writing—review and editing, and supervision. SS: validation, writing—review and editing, and supervision.
Declarations
Conflict of interest
The authors declare that they have no conflict of interest.
Footnotes
Surveyed studies: S#17 (in Table 9); S#32 (in Tables 9, 7, and 8); S#39 (in Table 8); S#40 (in Table 2); S#57 (in Table 8); and S#18 (in Table 8, TPR and recall equations are given at the same time). The tables given here are numbered as they appear in the studies listed in online Table E.1. described in Appendix 5.
⇒Examples (Sn = 20 = 10 + 10): subadditive: (− 10 ≤ 6 + − 10), superadditive: (4 ≥ − 4 + 6), countable additive: (0 = 5 + − 5).
Performance metrics that are represented in [-1, 1] (e.g., CK and MCC) can be transformed into [0, 1].
Publisher's Note
Springer Nature remains neutral with regard to jurisdictional claims in published maps and institutional affiliations.
References
- 1.Mooers CN. Making information retrieval pay. Boston: Boston Portland State University; 1951. [Google Scholar]
- 2.Cleverdon C, Mills J, Keen M. Factors affecting the performance of indexing systems. Cranfield: Cranfield University; 1966. [Google Scholar]
- 3.Tharwat A. Classification assessment methods. Appl Comput Informa. 2020 doi: 10.1016/j.aci.2018.08.003. [DOI] [Google Scholar]
- 4.Cleverdon C, Keen M. Factors affecting the performance of indexing systems. Cranfield: Cranfield University; 1966. [Google Scholar]
- 5.Sokal RR, Sneath PHA. Principles of numerical taxonomy. San Francisco: W. H. Freeman and Company; 1963. [Google Scholar]
- 6.Jaccard P. Nouvelles recherches sur la distribution florale. Bull la Société Vaudoise Des Sci Nat. 1908;44:223–270. [Google Scholar]
- 7.Japkowicz N, Shah M. Evaluating learning algorithms: a classification perspective. Cambridge: Cambridge University Press; 2011. [Google Scholar]
- 8.Powers DMW. Evaluation: From precision, recall and F-factor to ROC, informedness, markedness & correlation. J Mach Learn Technol. 2011;2:37–63. [Google Scholar]
- 9.Luque A, Carrasco A, Martín A, Lama JR. Exploring symmetry of binary classification performance metrics. Symmetry (Basel) 2019 doi: 10.3390/sym11010047. [DOI] [Google Scholar]
- 10.Sokolova M, Japkowicz N, Szpakowicz S. Beyond accuracy, F-score and ROC: a family of discriminant measures for performance evaluation. Adv Artif Intell. 2006;4304:1015–1021. doi: 10.1007/11941439_114. [DOI] [Google Scholar]
- 11.Razgallah A, Khoury R, Hallé S, Khanmohammadi K. A survey of malware detection in Android apps: recommendations and perspectives for future research. Comput Sci Rev. 2021;39:100358. doi: 10.1016/j.cosrev.2020.100358. [DOI] [Google Scholar]
- 12.Sihag V, Vardhan M, Singh P. A survey of Android application and malware hardening. Comput Sci Rev. 2021;39:100365. doi: 10.1016/j.cosrev.2021.100365. [DOI] [Google Scholar]
- 13.Straube S, Krell MM. How to evaluate an agent’s behavior to infrequent events? Reliable performance estimation insensitive to class distribution. Front Comput Neurosci. 2014;8:1–6. doi: 10.3389/fncom.2014.00043. [DOI] [PMC free article] [PubMed] [Google Scholar]
- 14.Luque A, Carrasco A, Martín A, de las Heras A. The impact of class imbalance in classification performance metrics based on the binary confusion matrix. Pattern Recognit. 2019;91:216–231. doi: 10.1016/j.patcog.2019.02.023. [DOI] [Google Scholar]
- 15.Brzezinski D, Stefanowski J, Susmaga R, Szczȩch I. Visual-based analysis of classification measures and their properties for class imbalanced problems. Inf Sci (NY) 2018;462:242–261. doi: 10.1016/j.ins.2018.06.020. [DOI] [Google Scholar]
- 16.Mullick SS, Datta S, Dhekane SG, Das S. Appropriateness of performance indices for imbalanced data classification: an analysis. Pattern Recognit. 2020;102:107197. doi: 10.1016/j.patcog.2020.107197. [DOI] [Google Scholar]
- 17.Sun Y, Wong AKC, Kamel MS. Classification of imbalanced data: a review. Int J Pattern Recognit Artif Intell. 2009;23:687–719. doi: 10.1142/S0218001409007326. [DOI] [Google Scholar]
- 18.Valverde-Albacete FJ, Peláez-Moreno C. 100% classification accuracy considered harmful: the normalized information transfer factor explains the accuracy paradox. PLoS One. 2014;9:1–10. doi: 10.1371/journal.pone.0084217. [DOI] [PMC free article] [PubMed] [Google Scholar]
- 19.Bradley AP. The use of the area under the ROC curve in the evaluation of machine learning algorithms. Pattern Recognit. 1997;30:1145–1159. doi: 10.1016/S0031-3203(96)00142-2. [DOI] [Google Scholar]
- 20.Chicco D, Jurman G. The advantages of the Matthews correlation coefficient (MCC) over F1 score and accuracy in binary classification evaluation. BMC Genom. 2020 doi: 10.1186/s12864-019-6413-7. [DOI] [PMC free article] [PubMed] [Google Scholar]
- 21.Hu B-G, Dong W-M (2014) A study on cost behaviors of binary classification measures in class-imbalanced problems. Comput Res Repos abs/1403.7
- 22.Labatut V, Cherifi H. Evaluation of performance measures for classifiers comparison. Ubiquitous Comput Commun J. 2011;6:21–34. [Google Scholar]
- 23.Wang S, Yao X. Relationships between diversity of classification ensembles and single-class performance measures. IEEE Trans Knowl Data Eng. 2013;25:206–219. doi: 10.1109/TKDE.2011.207. [DOI] [Google Scholar]
- 24.Sokolova M, Lapalme G. A systematic analysis of performance measures for classification tasks. Inf Process Manag. 2009;45:427–437. doi: 10.1016/j.ipm.2009.03.002. [DOI] [Google Scholar]
- 25.Seung-Seok C, Sung-Hyuk C, Tappert CC. A survey of binary similarity and distance measures. J Syst Cybern Inform. 2010;8:43–48. [Google Scholar]
- 26.Warrens MJ. Similarity coefficients for binary data: properties of coefficients, coefficient matrices, multi-way metrics and multivariate coefficient. Leiden: Leiden University; 2008. [Google Scholar]
- 27.Yan B, Koyejo O, Zhong K, Ravikumar P (2018) Binary classification with karmic, threshold-quasi-concave metrics. In: Proceedings of the35th international conference on machine learning (ICML), Stockholm, Sweden, pp 5527–5536
- 28.Forbes A. Classification-algorithm evaluation: five performance measures based on confusion matrices. J Clin Monit Comput. 1995;11:189–206. doi: 10.1007/BF01617722. [DOI] [PubMed] [Google Scholar]
- 29.Huang J, Ling CX. Using AUC and accuracy in evaluating learning algorithms. IEEE Trans Knowl Data Eng. 2005;17:299–310. doi: 10.1109/TKDE.2005.50. [DOI] [Google Scholar]
- 30.Canbek G, Taskaya Temizel T, Sagiroglu S. BenchMetrics: a systematic benchmarking method for binary-classification performance metrics. Neural Comput Appl. 2021;33:14623–14650. doi: 10.1007/s00521-021-06103-6. [DOI] [Google Scholar]
- 31.Pereira RB, Plastino A, Zadrozny B, Merschmann LHC. Correlation analysis of performance measures for multi-label classification. Inf Process Manag. 2018;54:359–369. doi: 10.1016/j.ipm.2018.01.002. [DOI] [Google Scholar]
- 32.Kolo B. Binary and multiclass classification. Weatherford: Weatherford Press; 2011. [Google Scholar]
- 33.Kocher M, Savoy J. Distance measures in author profiling. Inf Process Manag. 2017;53:1103–1119. doi: 10.1016/j.ipm.2017.04.004. [DOI] [Google Scholar]
- 34.Tulloss RE. Mycology in sustainable development: expanding concepts, vanishing borders. Boone: Parkway Publishers; 1997. Assessment of similarity indices for undesirable properties and a new tripartite similarity index based on cost functions; pp. 122–143. [Google Scholar]
- 35.Koyejo OO, Natarajan N, Ravikumar PK, Dhillon IS (2014) Consistent binary classification with generalized performance metrics. In: Advances in neural information processing systems 27: annual conference on neural information processing systems 2014, December 8–13 2014, Montreal, Quebec, Canada. ACM, Montreal, Canada, pp 2744–2752
- 36.Paradowski M. On the order equivalence relation of binary association measures. Int J Appl Math Comput Sci. 2015;25:645–657. doi: 10.1515/amcs-2015-0047. [DOI] [Google Scholar]
- 37.Kenter T, Balog K, De Rijke M. Evaluating document filtering systems over time. Inf Process Manag. 2015;51:791–808. doi: 10.1016/j.ipm.2015.03.005. [DOI] [Google Scholar]
- 38.Carbonero-Ruz M, Martínez-Estudillo FJ, Fernández-Navarro F, et al. A two dimensional accuracy-based measure for classification performance. Inf Sci (NY) 2017;382–383:60–80. doi: 10.1016/j.ins.2016.12.005. [DOI] [Google Scholar]
- 39.Hossin M, Sulaiman MN. A review on evaluation metrics for data classification evaluations. Int J Data Min Knowl Manag Process. 2015;5:1–11. doi: 10.5121/ijdkp.2015.5201. [DOI] [Google Scholar]
- 40.Welty C, Paritosh P, Aroyo L (2020) Metrology for AI: from benchmarks to instruments. In: The 34th AAAI conference on artificial intelligence (evaluating evaluation of AI systems workshop, Meta-Eval 2020). New York, NY
- 41.Canbek G, Sagiroglu S, Temizel TT, Baykal N (2017) Binary classification performance measures/metrics: a comprehensive visualized roadmap to gain new insights. In: 2017 International conference on computer science and engineering (UBMK). IEEE, Antalya, Turkey, pp 821–826
- 42.van Stralen KJ, Stel VS, Reitsma JB, et al. Diagnostic methods I: sensitivity, specificity, and other measures of accuracy. Kidney Int. 2009;75:1257–1263. doi: 10.1038/ki.2009.92. [DOI] [PubMed] [Google Scholar]
- 43.Wilks DS. Statistical methods in the atmospheric sciences. 2. New York: Elsevier; 2006. [Google Scholar]
- 44.Baldi P, Brunak S, Chauvin Y, et al. Assessing the accuracy of prediction algorithms for classification: an overview. Bioinformatics. 2000;16:412–424. doi: 10.1093/bioinformatics/16.5.412. [DOI] [PubMed] [Google Scholar]
- 45.Ferri C, Hernández-Orallo J, Modroiu R. An experimental comparison of performance measures for classification. Pattern Recognit Lett. 2009;30:27–38. doi: 10.1016/j.patrec.2008.08.010. [DOI] [Google Scholar]
- 46.Yerima SY, Sezer S, McWilliams G. Analysis of Bayesian classification-based approaches for Android malware detection. IET Inf Secur. 2014;8:25–36. doi: 10.1049/iet-ifs.2013.0095. [DOI] [Google Scholar]
- 47.Hjørland B. Facet analysis: the logical approach to knowledge organization. Inf Process Manag. 2013;49:545–557. doi: 10.1016/j.ipm.2012.10.001. [DOI] [Google Scholar]
- 48.Hjørland B, Scerri E, Dupré J. Forum: the philosophy of classification. Knowl Organ. 2011;38:9–24. doi: 10.5771/0943-7444-2011-1-9. [DOI] [Google Scholar]
- 49.Jakus G, Milutinović V, Omerović S, Tomažič S. Concepts, ontologies, and knowledge representation. New York: Springer; 2013. [Google Scholar]
- 50.Huang M, Briançon A (2018) Cerebri AI periodic table of data science. In: Cerebri. https://www.cerebriai.com/periodic-table. Accessed 15 Aug 2019
- 51.Govaert G, Nadif M. Mutual information, phi-squared and model-based co-clustering for contingency tables. Adv Data Anal Classif. 2018;12:455–488. doi: 10.1007/s11634-016-0274-6. [DOI] [Google Scholar]
- 52.Hu B-G, He R, Yuan X-T. Information-theoretic measures for objective evaluation of classifications. Acta Autom Sin. 2012;38:1169–1182. doi: 10.1016/S1874-1029(11)60289-9. [DOI] [Google Scholar]
- 53.Berrar D, Flach P. Caveats and pitfalls of ROC analysis in clinical microarray research (and how to avoid them) Brief Bioinform. 2012;13:83–97. doi: 10.1093/bib/bbr008. [DOI] [PubMed] [Google Scholar]
- 54.Voigt T, Fried R, Backes M, Rhode W. Threshold optimization for classification in imbalanced data in a problem of gamma-ray astronomy. Adv Data Anal Classif. 2014;8:195–216. doi: 10.1007/s11634-014-0167-5. [DOI] [Google Scholar]
- 55.Berrar D. Performance measures for binary classification. Encycl Bioinform Comput Biol ABC Bioinform. 2018;1:546–560. doi: 10.1016/B978-0-12-809633-8.20351-8. [DOI] [Google Scholar]
- 56.Jolliffe IT, Stephenson DB. Forecast verification: a practitioner’s guide in atmospheric science. 2. Hoboken: Wiley; 2012. [Google Scholar]
- 57.Ikonen E, Kortela U, Najim K. Distributed logic processors in process identification. In: Leondes CT, editor. Expert systems: the technology of knowledge management and decision making for the 21st century. New York: Academic Press; 2001. p. 1947. [Google Scholar]
- 58.Cardoso JS, Sousa R. Measuring the performance of ordinal classification. Int J Pattern Recognit Artif Intell. 2011;25:1173–1195. doi: 10.1142/S0218001411009093. [DOI] [Google Scholar]
- 59.Hirose S, Kozu T, Jin Y, Miyamura Y. Hierarchical relevance determination based on information criterion minimization. SN Comput Sci. 2020;1:1–19. doi: 10.1007/s42979-020-00239-3. [DOI] [Google Scholar]
- 60.Chin RJ, Lai SH, Ibrahim S, et al. Rheological wall slip velocity prediction model based on artificial neural network. J Exp Theor Artif Intell. 2019;31:659–676. doi: 10.1080/0952813X.2019.1592235. [DOI] [Google Scholar]
- 61.Caruana R, Niculescu-Mizil A (2004) Data mining in metric space: an empirical analysis of supervised learning performance criteria. In: Proceedings of 10th ACM SIGKDD international conference on knowledge discovery and data mining, pp 69–78. 1-58113-888-1/04/0008
- 62.Ranawana R, Palade V (2006) Optimized precision - a new measure for classifier performance evaluation. In: 2006 IEEE international conference on evolutionary computation. IEEE, Vancouver, BC, Canada, pp 2254–2261
- 63.Garcia V, Mollineda RA, Sanchez JS. Theoretical analysis of a performance measure for imbalanced data. IEEE Int Conf Pattern Recognit. 2006;1:617–620. doi: 10.1109/ICPR.2010.156. [DOI] [Google Scholar]
- 64.Kim S, Kim H. A new metric of absolute percentage error for intermittent demand forecasts. Int J Forecast. 2016;32:669–679. doi: 10.1016/j.ijforecast.2015.12.003. [DOI] [Google Scholar]
- 65.Texel PP (2013) Measure, metric, and indicator: an object-oriented approach for consistent terminology. In: Proceedings of IEEE Southeastcon. IEEE, Jacksonville, FL
- 66.Olsina L, de los Angeles Martín M, Ontology for software metrics and indicators: Building process and decisions taken. J Web Eng. 2004;2:262–281. [Google Scholar]
- 67.García F, Bertoa MF, Calero C, et al. Towards a consistent terminology for software measurement. Inf Softw Technol. 2006;48:631–644. doi: 10.1016/j.infsof.2005.07.001. [DOI] [Google Scholar]
- 68.Zammito F (2019) What’s considered a good log loss in machine learning? https://medium.com/@fzammito/whats-considered-a-good-log-loss-in-machine-learning-a529d400632d. Accessed 15 Jul 2020
- 69.Davies HTO, Crombie IK, Tavakoli M. When can odds ratios mislead? BMJ. 1998;316:989–991. doi: 10.1136/bmj.316.7136.989. [DOI] [PMC free article] [PubMed] [Google Scholar]
- 70.Schmidt CO, Kohlmann T. When to use the odds ratio or the relative risk? Int J Public Health. 2008;53:165–167. doi: 10.1007/s00038-008-7068-3. [DOI] [PubMed] [Google Scholar]
- 71.Glas AS, Lijmer JG, Prins MH, et al. The diagnostic odds ratio: a single indicator of test performance. J Clin Epidemiol. 2003;56:1129–1135. doi: 10.1016/S0895-4356(03)00177-X. [DOI] [PubMed] [Google Scholar]
- 72.Siegerink B, Rohmann JL. Impact of your results: beyond the relative risk. Res Pract Thromb Haemost. 2018;2:653–657. doi: 10.1002/rth2.12148. [DOI] [PMC free article] [PubMed] [Google Scholar]
- 73.Press WH (2008) Classifier performance: ROC, precision-recall, and all that. In: Computational statistics with application to bioinformatics. The University of Texas at Austin, Austin
- 74.Manning CD, Raghavan P, Schütze H. An introduction to information retrieval, online edition. Cambridge: Cambridge University Press; 2009. [Google Scholar]
- 75.Lucini FR, S. Fogliatto F, Giovani GJ,, et al. Text mining approach to predict hospital admissions using early medical records from the emergency department. Int J Med Inform. 2017;100:1–8. doi: 10.1016/j.ijmedinf.2017.01.001. [DOI] [PubMed] [Google Scholar]
- 76.Shah SAR, Issac B. Performance comparison of intrusion detection systems and application of machine learning to Snort system. Futur Gener Comput Syst. 2018;80:157–170. doi: 10.1016/j.future.2017.10.016. [DOI] [Google Scholar]
- 77.Faris H, Al-Zoubi AM, Heidari AA, et al. An intelligent system for spam detection and identification of the most relevant features based on evolutionary random weight networks. Inf Fusion. 2019;48:67–83. doi: 10.1016/j.inffus.2018.08.002. [DOI] [Google Scholar]
- 78.Ahamad MM, Aktar S, Rashed-Al-Mahfuz M, et al. A machine learning model to identify early stage symptoms of SARS-Cov-2 infected patients. Expert Syst Appl. 2020 doi: 10.1016/j.eswa.2020.113661. [DOI] [PMC free article] [PubMed] [Google Scholar]
- 79.Ben-David A. About the relationship between ROC curves and Cohen’s kappa. Eng Appl Artif Intell. 2008;21:874–882. doi: 10.1016/j.engappai.2007.09.009. [DOI] [Google Scholar]
- 80.Brown JB. Classifiers and their metrics quantified. Mol Inform. 2018;37:1–11. doi: 10.1002/minf.201700127. [DOI] [PMC free article] [PubMed] [Google Scholar]
- 81.Brzezinski D, Stefanowski J, Susmaga R, Szczech I. On the dynamics of classification measures for imbalanced and streaming data. IEEE Trans Neural Netw Learn Syst. 2020;31:1–11. doi: 10.1109/TNNLS.2019.2899061. [DOI] [PubMed] [Google Scholar]
- 82.Abdualgalil B, Abraham S (2020) Applications of machine learning algorithms and performance comparison: a review. In: International conference on emerging trends in information technology and engineering, ic-ETITE 2020. pp 1–6
- 83.Vivo JM, Franco M, Vicari D. Rethinking an ROC partial area index for evaluating the classification performance at a high specificity range. Adv Data Anal Classif. 2018;12:683–704. doi: 10.1007/s11634-017-0295-9. [DOI] [Google Scholar]
- 84.Prati RC, Batista GEAPA, Monard MC. A survey on graphical methods for classification predictive performance evaluation. IEEE Trans Knowl Data Eng. 2011;23:1601–1618. doi: 10.1109/TKDE.2011.59. [DOI] [Google Scholar]
- 85.Botchkarev A. A new typology design of performance metrics to measure errors in machine learning regression algorithms. Interdiscip J Inf Knowl Manag. 2019;14:45–79. doi: 10.28945/4184. [DOI] [Google Scholar]