

Abstract
Acute kidney injury (AKI) is frequent after liver transplantation (LT) and correlates with later development of chronic kidney disease. Its etiology is multifactorial and combines pre-, intra-, and postoperative factors. Additionally, the liver graft itself seems an important element in the development of AKI, yet the detailed mechanisms remain unclear. We hypothesized that grafts of LT recipients developing significant early AKI may show distinct proteomic alterations, and we set out to identify proteome differences between LT recipients developing moderate or severe AKI (n = 7) and LT recipients without early renal injury (n = 7). Liver biopsies obtained one hour after reperfusion were assessed histologically and using quantitative proteomics. Several cytokines and serum amyloid A2 (SAA2) were analyzed in serum samples obtained preoperatively, 2–4 h, and 20–24 h after graft reperfusion, respectively. LT induced mild histological alterations without significant differences between groups but uniformly altered liver function tests peaking on postoperative day 1, with a trend towards more severe alterations in patients developing AKI. Global quantitative proteomic analysis revealed 136 proteins differing significantly in their expression levels (p < 0.05, FC 20%): 80 proteins had higher and 56 had lower levels in the AKI group. Most of these proteins were related to immune and inflammatory responses, host defense, and neutrophil degranulation. No differences between the studied pro- and anti-inflammatory cytokines or SAA2 between groups were found at any moment. Our results suggest that grafts of LT patients who develop early AKI reveal a distinct proteome dominated by an early yet prominent activation of the innate immunity. These findings support the hypothesis that AKI after LT may be favored by certain graft characteristics.
Keywords: liver transplantation, ischemia–reperfusion injury, renal failure, proteomics, outcome
1. Introduction
Early results after liver transplantation (LT) have steadily improved over the last decades, with one-year patient and graft survival frequently exceeding 90% [1,2]. However, long-term outcome does not follow the same trend, and only about 60% of patients are alive ten years after the transplant [3]. The causes behind this attrition are multiple, and include disease recurrence, cardiovascular complications, diabetes, malignancies, or chronic renal failure [4]. The occurrence of chronic renal failure among patients with a nonrenal transplant is associated with an increase by a factor of more than four in the risk of death [5].
Renal dysfunction may occur at any time after LT. Acute kidney injury (AKI) has been reported in up to 95% of LT [6], and is strongly associated with the development of chronic kidney disease (CKD). The etiology of early AKI is multifactorial and combines pre-transplant (i.e., hepatorenal syndrome), intraoperative (bleeding, hemodynamic instability, post-reperfusion syndrome, medications) and postoperative risk factors (drug toxicity, infections). As the increasing use of livers from extended criteria donors has been paralleled by an increased incidence of early renal injury, the liver graft itself has emerged as an important element in the development of AKI [7,8]. Recent studies indicate that renal metabolism and function are significantly altered only hours after graft reperfusion in the absence of clear hemodynamic or pharmacologic causes [9]. Hence, the mechanisms through which the reperfused liver promotes the remote organ injury remain elusive.
Growing evidence suggests a causative role for liver-related factors, including an advanced hepatic ischemia reperfusion injury (HIRI) [10]. However, routine markers of liver injury such as transaminases and even microscopic examination regularly fail to discriminate between liver recipients who are going to develop AKI or not. Recent advancements in proteomics have allowed detailed insights into multiple biological processes at a previously unattained depth [11]. Using quantitative proteomics, we set out to identify alteration patterns in the livers of patients developing severe AKI after graft reperfusion. We hypothesized that certain liver grafts may show distinct molecular characteristics that may be related to the cascade of events ultimately leading to an impairment in renal function.
2. Results
2.1. Clinical Outcomes
One out of 27 patients initially included in the study required early retransplantation due to primary nonfunction, whereas the remaining 26 patients recovered and showed adequate postoperative liver graft function. Five patients developed AKI stage 1, eleven patients developed AKI stage 2 and 3, whereas the renal function of eleven patients remained unaffected by the LT (AKI stage 0). Liver biopsies were not available in seven patients. Hence, 14 patients (seven patients with and seven without AKI) and their corresponding biopsies form the basis of this report. The main donor and recipient characteristics for these 14 transplants are detailed in Table 1. Most variables were similar in both groups, with the exception of body mass index (BMI) both for the donors and recipients (see Table 1).
Table 1.
Donor and recipient characteristics. Data are given as n (%) or median (IQR). * Etiologies are not mutually exclusive. ** Polycystic liver disease (n = 1). Non-alcoholic fatty liver disease (n = 1). AKI: acute kidney injury; BMI: body mass index; ICU: intensive care unit; DRI: donor risk index; MELD: Model for End-stage Liver Disease; mGFR: measured glomerular filtration rate; RRT: renal replacement therapy.
| All (n = 14) | AKI 0 (n = 7) | AKI 2 + 3 (n = 7) |
p Value | |
|---|---|---|---|---|
| Donor | ||||
| Age, years | 62 (33–67) | 45 (25–71) | 62 (59–64) | 0.97 |
| Gender: female/male | 4/10 | 2/5 | 2/5 | 1 |
| BMI | 25 (23–29) | 23 (18–28) | 29 (24–30) | 0.04 |
| Cause of death | ||||
| Cerebrovascular accident | 5 | 1 | 4 | 0.27 |
| Trauma | 6 | 5 | 1 | 0.10 |
| Other | 3 | 1 | 2 | 1 |
| ICU stay, hours | 36 (25–58) | 36 (16–65) | 36 (28–57) | 1 |
| Preservation solution: Custodiol/UW/IGL-1 | 9/3/2 | 6/1/0 | 3/2/2 | 0.34 |
| DRI | 1.8 (1.3–1.9) | 1.4 (1.3–1.8) | 1.9 (1.4–2.0) | 0.02 |
| Cold ischemia time, min | 431 (374–625) | 437 (375–637) | 399 (372–621) | 0.81 |
| Recipient | ||||
| Age, years | 44 (34–56) | 41 (24–57) | 49 (28–56) | 1 |
| Gender: female/male | 2/12 | 1/6 | 1/6 | 1 |
| BMI | 25 (20–29) | 20 (19–27) | 29 (21–32) | 0.03 |
| Diabetes Mellitus | 2 | 0 | 2 | 0.46 |
| MELD score | 12 (7–15) | 8 (7–12) | 15 (12–20) | 0.03 |
| Ascites | 6 | 3 | 3 | 1 |
| Etiology of liver disease * | ||||
| Primary sclerosing cholangitis | 6 | 3 | 3 | 1 |
| Alcohol | 2 | 2 | 0 | 0.46 |
| Hepatitis B virus | 1 | 1 | 0 | 1 |
| Hepatitis C virus | 3 | 0 | 3 | 0.19 |
| Hepatocellular carcinoma | 4 | 1 | 3 | 0.56 |
| Other ** | 2 | 1 | 1 | |
| Duration of surgery, hours | 6 (6–8) | 6 (5.5–7.5) | 8 (6–9.5) | 0.27 |
| Intraoperative bleeding, mL | 1150 (575–2425) | 650 (500–2500) | 1800 (1000–2400) | 0.33 |
| Serum creatinine at admission, mg/dL | 0.78 (0.64–1.0) | 0.8 (0.71–1.0) | 0.76 (0.62–1.03) | 0.60 |
| mGFR, ml/min/1.73 m² | 102 (98–109) | 99 (84–110) | 102 (101–103) | 0.52 |
| Post-reperfusion syndrome | 0 | |||
| ICU stay, hours | 22 (15–50) | 24 (16–54) | 20 (14–49) | 0.90 |
| RRT | 0 |
2.2. Liver Injury
Liver graft preservation and reperfusion resulted in uniformly altered liver function tests peaking on postoperative day 1, without any significant difference between patients ultimately developing AKI or not (Figure 1). Likewise, HIRI induced only mild liver histological alterations without any significant difference between the histopathological Suzuki score in the two patient groups.
Figure 1.
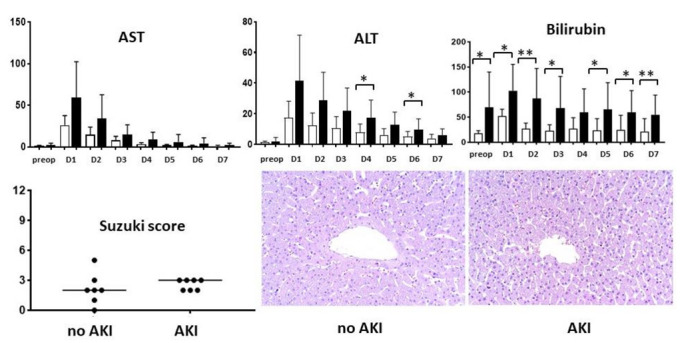
Biochemical and histological assessment of the ischemia–reperfusion injury. Daily liver function tests over the first week in patients without (white bars) and with acute kidney injury (black bars), semiquantitative assessment of the histology (Suzuki score), and representative microphotographs (hematoxylin–eosin, original magnification ×200). AKI: acute kidney injury; ALT: alanine aminotransferase; AST: aspartate aminotransferase; D: day. * p < 0.05, ** p < 0.01.
2.3. Proteomic Analysis
In the global quantitative biopsy analysis, a total of 4544 proteins were identified, and 3691 proteins were quantified. Comparing liver graft biopsies from patients with moderate/severe AKI with those from patients without kidney impairment, we found that 136 proteins displayed significant differences in their tissue expression (p < 0.05, FC ≥ 20%); 80 were upregulated and 56 downregulated in the patients developing moderate/severe AKI. Most of these proteins were related to immune and inflammatory responses, host defense, and neutrophil degranulation. The list of significantly regulated proteins, together with fold changes, corresponding p values, and relevant biological processes, are shown in Table 2.
Table 2.
List of proteins differentially expressed in the liver grafts of patients developing early AKI compared to liver grafts of patients with uneventful course.
| Accession | Gene Symbol | Description | Fold Changes (Average Value) |
p Value | Biological Process | Biological Function |
|---|---|---|---|---|---|---|
| P0DJI9 | SAA2 | Serum amyloid A-2 protein | 12.87 | 0.03 | Inflammation | Acute-phase protein |
| P11678 | EPX | Eosinophil peroxidase | 3.53 | 0.03 | Inflammation | Neutrophil degranulation |
| P02461 | COL3A1 | Collagen alpha-1(III) chain | 2.60 | <0.01 | Cell structure | Assembly of collagen |
| P14555 | PLA2G2A | Phospholipase A2, membrane associated | 2.52 | 0.04 | Inflammation | Antimicrobial peptide |
| P62736 | ACTA2 | Actin | 2.51 | 0.03 | Cell structure | Vascular smooth muscle contraction |
| Q14108 | SCARB2 | Lysosome membrane protein 2 | 2.41 | 0.02 | Transport | Lysosome structure |
| P09210 | GSTA2 | Glutathione S-transferase A2 | 2.24 | <0.01 | Cell differentiation | Glutathione conjugation |
| Q9UBX1 | CTSF | Cathepsin F | 2.22 | 0.05 | Inflammation | MHC-II antigen presentation |
| P41219 | PRPH | Peripherin | 2.15 | 0.05 | Cell structure | Axonal regeneration after injury |
| P35749 | MYH11 | Myosin-11 | 2.11 | 0.03 | Structural protein | Smooth muscle contraction |
| P21810 | BGN | Biglycan | 2.10 | 0.04 | Cell structure | Articular cartilage development |
| P55327 | TPD52 | Tumor protein D52 | 1.92 | 0.01 | Cell differentiation | Golgi associated vesicle biosynthesis |
| P51888 | PRELP | Prolargin | 1.83 | 0.02 | Cell aging | Anchoring collagen I-II |
| Q9UBR2 | CTSZ | Cathepsin Z | 1.83 | 0.04 | Inflammation | Proteolysis, metabolism of angiotensinogen to angiotensins, neutrophil degranulation |
| Q9Y646 | CPQ | Carboxypeptidase Q | 1.79 | 0.01 | Metabolic process | Post-translation protein modification |
| O76070 | SNCG | Gamma-synuclein | 1.75 | 0.04 | Cell-cell interaction | Neurofilament network integrity |
| Q8IV08 | PLD3 | 5’-3’ exonuclease PLD3 | 1.74 | 0.01 | Inflammation | Phagocytosis, synthesis of phosphatidylglycerol |
| Q9NVA2 | SEPTIN11 | Septin-11 | 1.73 | 0.02 | Cell division | Bacterial invasion of epithelial cells |
| P27487 | DPP4 | Dipeptidyl peptidase 4 | 1.64 | 0.04 | Metabolic process | Protein digestion and absorption GLP1 |
| Q9UBX5 | FBLN5 | Fibulin-5 | 1.64 | 0.02 | Cell structure | Elastic fibers associated protein |
| P54803 | GALC | Galactocerebrosidase | 1.63 | 0.02 | Metabolic process | Glycosphingolipid metabolism |
| O00115 | DNASE2 | Deoxyribonuclease-2-alpha | 1.60 | 0.04 | Cell death | Lysosome components |
| Q9BTY2 | FUCA2 | Plasma alpha-L-fucosidase | 1.60 | 0.04 | Metabolic process | Regulation of insulin-like growth factor transport and uptake |
| P55001 | MFAP2 | Microfibrillar-associated protein 2 | 1.57 | 0.02 | Cell structure | Elastic fibers associated protein |
| P15144 | ANPEP | Aminopeptidase N | 1.56 | 0.01 | Angiogenesis | Metabolism of angiotensinogen to angiotensins, neutrophil degranulation |
| P16070 | CD44 | CD44 antigen | 1.53 | 0.03 | Cell-cell interaction. Inflammation. | Hyaluronan collagen interaction protein |
| P53634 | CTSC | Dipeptidyl peptidase 1 | 1.53 | 0.05 | Immune response | Chaperon binding |
| P19440 | GGT1 | Glutathione hydrolase 1 proenzyme | 1.52 | 0.03 | Metabolic process | Glutathione synthesis and recycling |
| P51809 | VAMP7 | Vesicle-associated membrane protein 7 | 1.52 | 0.04 | Transport | Cargo recognition for clathrin-mediated endocytosis, Golgi associated vesicle biogenesis |
| Q10589 | BST2 | Bone marrow stromal antigen 2 | 1.49 | 0.01 | Inflammation | Interferon alpha/beta signaling, neutrophil degranulation |
| O14558 | HSPB6 | Heat shock protein beta-6 | 1.48 | 0.03 | Metabolic process | Smooth muscle vasorelaxation and cardiac myocyte contractility |
| Q99536 | VAT1 | Synaptic vesicle membrane protein VAT-1 | 1.47 | 0.01 | Metabolic process | Neutrophil degranulation |
| O00754 | MAN2B1 | Lysosomal alpha-mannosidase | 1.46 | 0.04 | Metabolic process | Lysosomal oligosaccharide catabolism, neutrophil degranulation |
| P08236 | GUSB | Beta-glucuronidase | 1.45 | 0.04 | Metabolic process | Degradation of dermatan and keratan sulphate |
| P51688 | SGSH | N-sulphoglucosamine sulphohydrolase | 1.45 | 0.01 | Metabolic process | Heparan sulfate degradation |
| Q9H2V7 | SPNS1 | Protein spinster homolog 1 | 1.45 | 0.05 | Transport | Sphingolipid transporter |
| Q16853 | AOC3 | Membrane primary amine oxidase | 1.43 | <0.01 | Inflammation | Phase I functionalization of compounds |
| Q96BM9 | ARL8A | ADP-ribosylation factor-like protein 8A | 1.42 | 0.03 | Cell division | Lysosome motility |
| P10619 | CTSA | Lysosomal protective protein | 1.41 | 0.05 | Inflammation | Glycosphingolipid metabolism. Neutrophil degranulation |
| P16284 | PECAM1 | Platelet endothelial cell adhesion molecule | 1.41 | 0.04 | Inflammation | Leukocyte trans-endothelial migration |
| P54802 | NAGLU | Alpha-N-acetylglucosaminidase | 1.41 | 0.04 | Metabolic process | Degradation of heparan sulphate |
| Q14249 | ENDOG | Endonuclease G | 1.39 | <0.01 | Cell aging | Apoptosis |
| O75751 | SLC22A3 | Solute carrier family 22 member 3 | 1.38 | 0.03 | Transport | Abacavir transmembrane transport |
| P04066 | FUCA1 | Tissue alpha-L-fucosidase | 1.36 | 0.03 | Inflammation | Neutrophil degranulation |
| Q08722 | CD47 | Leukocyte surface antigen CD47 | 1.35 | 0.02 | Cell-cell interaction. Inflammation | Modulation of integrins |
| O75746 | SLC25A12 | Calcium-binding mitochondrial carrier protein Aralar1 | 1.34 | 0.05 | Transport | Epileptic encephalopathy |
| P16278 | GLB1 | Beta-galactosidase | 1.32 | 0.05 | Metabolic process | Galactose metabolism |
| Q86Y39 | NDUFA11 | NADH dehydrogenase [ubiquinone] 1 alpha subcomplex subunit 11 | 1.32 | 0.01 | Metabolic process | Complex I biogenesis |
| Q8N386 | LRRC25 | Leucine-rich repeat-containing protein 25 | 1.32 | <0.01 | Inflammation | Interferon signaling pathway |
| P07203 | GPX1 | Glutathione peroxidase 1 | 1.31 | 0.04 | Cell death | Detoxification of reactive oxygen species |
| Q92542 | NCSTN | Nicastrin | 1.31 | 0.01 | Cell proliferation | Alzheimer’s disease, NOTCH signaling pathway |
| Q96NB2 | SFXN2 | Sideroflexin-2 | 1.31 | 0.03 | Transport | Transport of serine into mitochondria |
| Q9NQC3 | RTN4 | Reticulon-4 | 1.31 | 0.03 | Cell structure | Formation and stabilization of ER tubules |
| Q9NZD2 | GLTP | Glycolipid transfer protein | 1.31 | 0.02 | Transport | Transfer of various glycosphingolipids |
| Q9Y336 | SIGLEC9 | Sialic acid-binding Ig-like lectin 9 | 1.31 | 0.01 | Metabolic process | Sialic-acid dependent binding to cells |
| P08648 | ITGA5 | Integrin alpha-5 | 1.30 | 0.04 | Cell differentiation | Interaction with fibronectin and fibrinogen |
| P20674 | COX5A | Cytochrome c oxidase subunit 5A | 1.29 | 0.01 | Metabolic process | Oxidative phosphorylation |
| Q9NY15 | STAB1 | Stabilin-1 | 1.28 | 0.03 | Cell-cell interaction | Scavenger receptor for acetylated low-density lipoprotein |
| P56556 | NDUFA6 | NADH dehydrogenase [ubiquinone] 1 alpha subcomplex subunit 6 | 1.27 | <0.01 | Metabolic process | NADH to the respiratory chain |
| Q8TBC4 | UBA3 | NEDD8-activating enzyme E1 catalytic subunit | 1.27 | 0.01 | Metabolic process | Antigen processing: ubiquitination and proteasome degradation |
| Q9H8M1 | COQ10B | Coenzyme Q-binding protein COQ10 homolog B | 1.27 | 0.01 | Metabolic process | Respiratory electron transport |
| O43674 | NDUFB5 | NADH dehydrogenase [ubiquinone] 1 beta subcomplex subunit 5 | 1.25 | 0.03 | Metabolic process | Mitochondrial membrane respiratory chain NADH dehydrogenase |
| O75306 | NDUFS2 | NADH dehydrogenase [ubiquinone] iron-sulfur protein 2 | 1.25 | 0.01 | Metabolic process | NADH to the respiratory chain |
| P03915 | ND5 | NADH-ubiquinone oxidoreductase chain 5 | 1.25 | 0.02 | Transport | Complex I biogenesis |
| Q9NZN4 | EHD2 | EH domain-containing protein 2 | 1.25 | 0.03 | Transport | Endocytosis, internalization of GLUT4 |
| P28331 | NDUFS1 | NADH-ubiquinone oxidoreductase 75 kDa subunit | 1.24 | 0.01 | Metabolic process | Mitochondrial membrane respiratory chain |
| P36969 | GPX4 | Phospholipid hydroperoxide glutathione peroxidase | 1.24 | 0.05 | Metabolic process | Glutathione metabolism |
| P51178 | PLCD1 | 1-phosphatidylinositol 4,5-bisphosphate phosphodiesterase delta-1 | 1.24 | 0.04 | Metabolic process | The production of the second messenger molecules |
| Q9UI09 | NDUFA12 | NADH dehydrogenase [ubiquinone] 1 alpha subcomplex subunit 12 | 1.24 | 0.02 | Metabolic process | NADH to the respiratory chain |
| O75489 | NDUFS3 | NADH dehydrogenase [ubiquinone] iron-sulfur protein 3 | 1.23 | 0.01 | Metabolic process | NADH to the respiratory chain |
| O95139 | NDUFB6 | NADH dehydrogenase [ubiquinone] 1 beta subcomplex subunit 6 | 1.23 | 0.01 | Metabolic process | Mitochondrial membrane respiratory chain NADH dehydrogenase |
| O95168 | NDUFB4 | NADH dehydrogenase [ubiquinone] 1 beta subcomplex subunit 4 | 1.22 | 0.04 | Transport | Mitochondrial membrane respiratory chain NADH dehydrogenase |
| Q6ZVM7 | TOM1L2 | TOM1-like protein 2 | 1.22 | 0.03 | Transport | Protein transport, mitogenic signaling |
| P51151 | RAB9A | Ras-related protein Rab-9A | 1.21 | 0.04 | Metabolic process | Trafficking of melanogenic enzymes |
| Q8TEM1 | NUP210 | Nuclear pore membrane glycoprotein 210 | 1.21 | 0.04 | Metabolic process | RNA transport |
| Q92747 | ARPC1A | Actin-related protein 2/3 complex subunit 1A | 1.21 | 0.05 | Cell structure | Mediates the formation of branched actin networks |
| O15162 | PLSCR1 | Phospholipid scramblase 1 | 1.20 | 0.02 | Cell death | Lipid scrambling, lipid flip-flop |
| O43678 | NDUFA2 | NADH dehydrogenase [ubiquinone] 1 alpha subcomplex subunit 2 | 1.20 | <0.01 | Metabolic process | NADH to the respiratory chain |
| Q9HD45 | TM9SF3 | Transmembrane 9 superfamily member 3 | 1.20 | 0.03 | Metabolic process | Unknown |
| P09669 | COX6C | Cytochrome c oxidase subunit 6C | 1.19 | 0.02 | Metabolic process | Respiratory electron transport |
| Q96K19 | RNF170 | E3 ubiquitin-protein ligase RNF170 | 0.80 | 0.04 | Metabolic process | Stimulus-induced inositol 1,4,5-trisphosphate receptor type 1 (ITPR1) ubiquitination and degradation via the endoplasmic reticulum-associated degradation (ERAD) |
| Q9BZZ5 | API5 | Apoptosis inhibitor 5 | 0.80 | 0.04 | Cell death | Protein assembly |
| Q9P2X0 | DPM3 | Dolichol-phosphate mannosyltransferase subunit 3 | 0.80 | 0.03 | Metabolic process | Stabilizer subunit of the dolichol-phosphate mannose (DPM) synthase complex |
| Q9UQ80 | PA2G4 | Proliferation-associated protein 2G4 | 0.80 | 0.04 | Cell proliferation | Erbb3-regulated signal transduction pathway |
| P63167 | DYNLL1 | Dynein light chain 1 | 0.79 | 0.04 | Transport | Cargos protein |
| P78318 | IGBP1 | Immunoglobulin-binding protein 1 | 0.79 | 0.05 | Inflammation | Signal transduction. |
| Q13724 | MOGS | Mannosyl-oligosaccharide glucosidase | 0.79 | 0.02 | Metabolic process | N-glycan biosynthesis |
| Q5K4L6 | SLC27A3 | Solute carrier family 27 member 3 | 0.79 | 0.05 | Metabolic process | Acyl-CoA ligase activity for long-chain and very-long-chain fatty acids |
| Q9Y285 | FARSA | Phenylalanine--tRNA ligase alpha subunit | 0.79 | 0.05 | Metabolic process | Aminoacyl-TRNα biosynthesis |
| P53609 | PGGT1B | Geranylgeranyl transferase type-1 subunit beta | 0.78 | 0.03 | Metabolic process | Transfer of a geranyl-geranyl moiety |
| Q13098 | GPS1 | COP9 signalosome complex subunit 1 | 0.78 | 0.04 | Cell differentiation | Cop9 signalosome complex |
| Q6DD88 | ATL3 | Atlastin-3 | 0.78 | 0.03 | Transport | Fusion of endoplasmic reticulum membrane |
| Q92688 | ANP32B | Acidic leucine-rich nuclear phosphoprotein 32 family member B | 0.78 | 0.01 | Cell differentiation | Cell proliferation, apoptosis, cell cycle |
| Q96AT9 | RPE | Ribulose-phosphate 3-epimerase | 0.78 | 0.03 | Metabolic process | Biosynthesis of amino acids |
| Q9NRY4 | ARHGAP35 | Rho GTPase-activating protein 35 | 0.78 | 0.02 | Cell communication | Rho gap activity |
| Q9Y608 | LRRFIP2 | Leucine-rich repeat flightless-interacting protein 2 | 0.78 | 0.02 | Metabolic process | Unknown |
| O60506 | SYNCRIP | Heterogeneous nuclear ribonucleoprotein Q | 0.77 | 0.03 | Cell differentiation | mRNA processing mechanisms |
| Q13619 | CUL4A | Cullin-4A | 0.77 | 0.01 | Metabolic process | Nucleotide excision repair |
| Q96JJ7 | TMX3 | Protein disulfide-isomerase TMX3 | 0.77 | 0.03 | Metabolic process | Folding of proteins containing disulfide bonds |
| Q14444 | CAPRIN1 | Caprin-1 | 0.76 | 0.02 | Cell communication | Synaptic plasticity in neurons and cell proliferation |
| Q9HCE1 | MOV10 | Helicase MOV-10 | 0.76 | 0.02 | Metabolic process | mRNA target degradation |
| Q9NQX3 | GPHN | Gephyrin | 0.76 | 0.02 | Cell structure | Membrane protein-cytoskeleton interactions |
| P05387 | RPLP2 | 60S acidic ribosomal protein P2 | 0.75 | 0.01 | Cell structure | Elongation step of protein synthesis. |
| Q14257 | RCN2 | Reticulocalbin-2 | 0.75 | 0.03 | Metabolic process | Type 4 Bardet–Biedl syndrome |
| Q9BT40 | INPP5K | Inositol polyphosphate 5-phosphatase K | 0.75 | 0.04 | Metabolic process | Insulin-dependent glucose uptake |
| Q9BV40 | VAMP8 | Vesicle-associated membrane protein 8 | 0.75 | 0.05 | Inflammation | Platelet activation |
| Q9HCE6 | ARHGEF10L | Rho guanine nucleotide exchange factor 10-like protein | 0.75 | 0.04 | Cell communication | Guanine nucleotide exchange factor |
| Q9P2M7 | CGN | Cingulin | 0.75 | 0.03 | Cell-cell interaction | Tight junction |
| P23508 | MCC | Colorectal mutant cancer protein | 0.74 | 0.01 | Cell death | Suppresses cell proliferation and the WNT/β-catenin pathway |
| Q9NR50 | EIF2B3 | Translation initiation factor eIF-2B subunit gamma | 0.74 | 0.03 | Metabolic process | RNA transport |
| Q06520 | SULT2A1 | Bile salt sulfotransferase | 0.71 | <0.01 | Metabolic process | Bile secretion |
| P84090 | ERH | Enhancer of rudimentary homolog | 0.69 | 0.01 | Metabolic process | Cell cycle |
| Q96B97 | SH3KBP1 | SH3 domain-containing kinase-binding protein 1 | 0.69 | 0.01 | Cell-cell interaction | Endocytosis |
| O43306 | ADCY6 | Adenylate cyclase type 6 | 0.68 | 0.04 | Metabolic process | Formation of the signaling molecule camp downstream of G protein-coupled receptors |
| P33176 | KIF5B | Kinesin-1 heavy chain | 0.68 | 0.04 | Cell communication | Dopaminergic synapse, endocytosis |
| Q9NZ32 | ACTR10 | Actin-related protein 10 | 0.68 | 0.02 | Cell structure | Microtubule-based movement |
| Q7L5Y1 | ENOSF1 | Mitochondrial enolase superfamily member 1 | 0.67 | <0.01 | Metabolic process | Fructose and mannose metabolism |
| Q9BQE3 | TUBA1C | Tubulin alpha-1C chain | 0.66 | 0.03 | Cell structure | Constituent of microtubules |
| Q16611 | BAK1 | Bcl-2 homologous antagonist/killer | 0.65 | 0.04 | Cell death | Apoptosis |
| Q17RC7 | EXOC3L4 | Exocyst complex component 3-like protein 4 | 0.65 | 0.03 | Transport | Unknown |
| Q9UNN5 | FAF1 | FAS-associated factor 1 | 0.65 | 0.03 | Cell death | Ubiquitin-binding protein |
| Q9Y2W1 | THRAP3 | Thyroid hormone receptor-associated protein 3 |
0.65 | 0.02 | Metabolic process | Pre-mRNA splicing |
| Q9H9C1 | VIPAS39 | Spermatogenesis-defective protein 39 homolog | 0.64 | 0.03 | Cell structure | Maintenance of the apical-basolateral polarity |
| Q96A49 | SYAP1 | Synapse-associated protein 1 | 0.62 | 0.03 | Metabolic process | mTOTC2-mediated phosphorylation of AKT1 |
| Q9BX59 | TAPBPL | Tapasin-related protein | 0.62 | 0.02 | Inflammation | Antigen processing and presentation pathway, |
| P24386 | CHM | Rab proteins geranylgeranyltransferase component A 1 | 0.58 | 0.04 | Cell structure | Substrate-binding subunit of the Rab geranylgeranyltransferase complex |
| Q92539 | LPIN2 | Phosphatidate phosphatase LPIN2 | 0.58 | 0.02 | Metabolic process | Metabolism of fatty acids |
| Q96AG3 | SLC25A46 | Solute carrier family 25 member 46 | 0.58 | 0.01 | Cell structure | Mitochondrial organization |
| P02652 | APOA2 | Apolipoprotein A-II | 0.57 | 0.02 | Metabolic process | PPAR signaling pathway, stabilize HDL |
| Q9Y2U8 | LEMD3 | Inner nuclear membrane protein Man1 | 0.57 | 0.01 | Cell communication | Repressor of TGF-β, activin, and BMP signaling |
| P02647 | APOA1 | Apolipoprotein A-I | 0.55 | 0.02 | Metabolic process | Reverse transport of cholesterol |
| P32456 | GBP2 | Guanylate-binding protein 2 | 0.50 | 0.05 | Inflammation | NOD-like receptor signaling pathway |
| P13674 | P4HA1 | Prolyl 4-hydroxylase subunit alpha-1 | 0.47 | 0.03 | Cell structure | Arginine and proline metabolism |
| Q9UKK3 | PARP4 | Protein mono-ADP-ribosyltransferase PARP4 | 0.47 | 0.03 | Cell death | Apoptosis |
| Q8WWT9 | SLC13A3 | Solute carrier family 13 member 3 | 0.42 | 0.02 | Transport | Sodium-coupled sulphate, di- and tri-carboxylate transporters |
For an overall assessment of proteomic similarities and differences between patients developing moderate/severe AKI with those from patients without kidney impairment, we employed PCA (Figure 2A). The PCA demonstrates that there were small differences between the two groups. Patients without AKI tended to be more similar to each other compared to the more heterogeneous group developing AKI 2 and 3.
Figure 2.
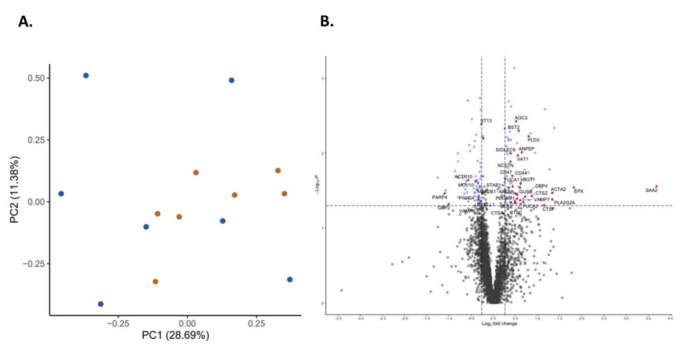
Principal component analysis showing data distribution in patients with acute kidney injury (blue) and without renal impairment (red) (A) and volcano plot indicating the proteins (red dots) showing both the magnitude of fold changes (x axis) and high statistical significance (-log10 of p values, y axis) (B).
Proteins associated with host defense, neutrophil degranulation, immune, and inflammatory responses are indicated in red in the volcano plot (Figure 2B). Several known inflammatory markers or enzymes such as SAA2 and PLA2 were among the most upregulated proteins in the group developing AKI.
For a functional view of the proteomic differences between the groups, hierarchical clustering of the statistically different expressed proteins was performed (Figure 3). The heat map clearly revealed the clustering of the various proteins differentially expressed between the two groups and allowed a distinct delineation of the two patient groups.
Figure 3.

Heat map view and hierarchical clustering of the proteins showing significant differences between the two groups. The horizontal tree indicates the proteins, and the vertical tree indicates the 14 patients analyzed. The color scheme in the cluster analysis is from blue (low) to red (high), and protein identities are listed on the right.
2.4. Validation Study—Immunofluorescence
Specific PECAM-1 and APOA1 staining was observed in all biopsies with variations in staining intensity and pattern (Figure 4). PECAM-1 staining was regularly found on the portal and centrilobular vein endothelia, as well as on some arterioles. Focal staining in the sinusoids was observed in some biopsies. Apolipoprotein A1 staining was found mainly in the sinusoids, whereas the central veins were largely negative. There was a strong correlation (Spearman) between proteomics results and the semiquantitative staining assessment (rho = 0.775, p = 0.0008).
Figure 4.
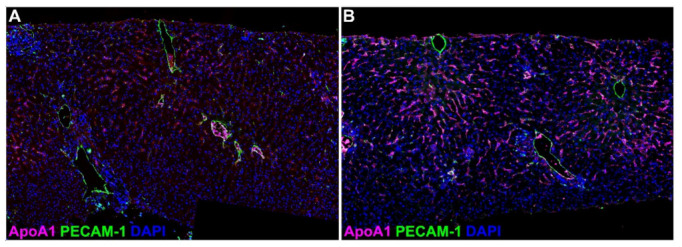
Detection of apolipoprotein A1 (pink, ApoA1) and platelet–endothelial cell adhesion molecule 1 (green, PECAM-1) by double immunofluorescence staining in postreperfusion liver biopsies. ApoA1 expression ranged from low (A) to high (B) and showed sinusoidal staining pattern; PECAM-1 expression was found on larger vessels (centrolobular and portal veins, arterioles). Nuclei were counterstained with DAPI (blue). Original magnification ×200.
2.5. Circulating Cytokines and SAA2
Circulating concentrations of a panel of cytokines were analyzed after 2–4 h and 24 h from graft reperfusion and compared to preoperative levels for each group as well as against healthy individuals (Figure 5). The preoperative levels of several cytokines revealed significant differences compared to healthy individuals which may reflect the underlying liver disease. Patients developing AKI had higher IL-6 at 24 h compared with those without AKI. Cytokines levels were also compared at each time point between the two study groups, but no significant differences in concentration levels were found for any of the tested cytokines.
Figure 5.
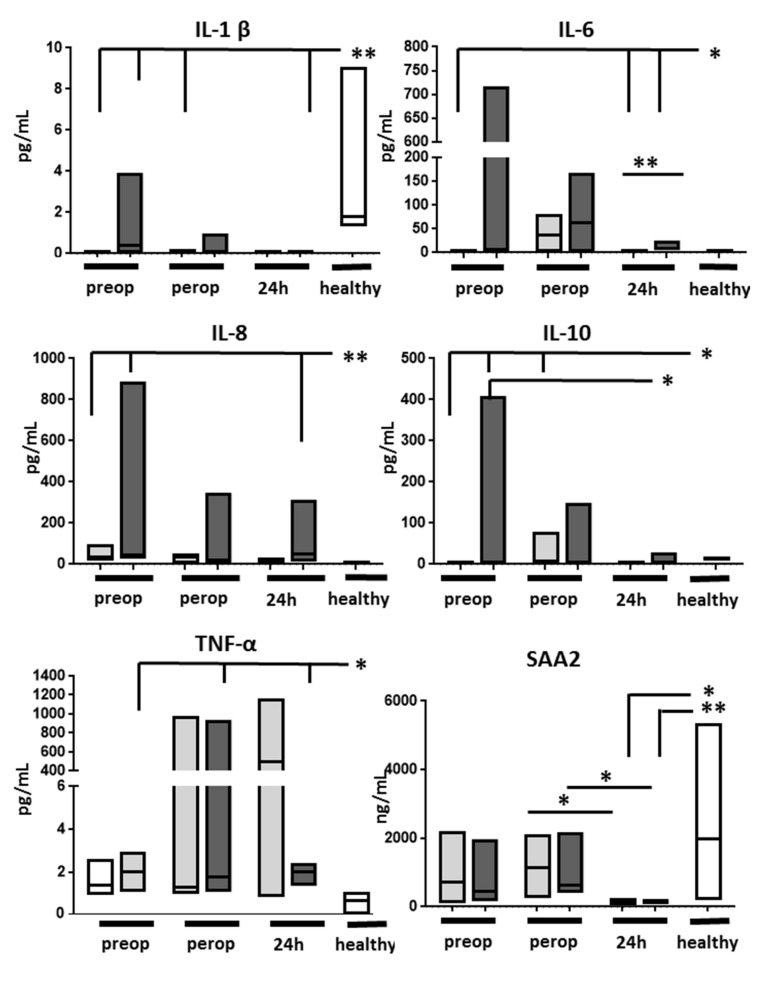
Serum concentration of several cytokines and serum amyloid A2 (SAA2) in patients without (light grey bars) and with acute kidney injury (dark grey bars) and in a group of healthy controls (white bars, n = 6). IL—interleukin, IFN—interferon. Lowest limits of detection were as follows: IFN-γ: 0.37 pg/mL, IL-1β: 0.05 pg/mL, IL-2: 0.09 pg/mL, IL-4: 0.02 pg/mL, IL-6: 0.06 pg/mL, IL-8: 0.07 pg/mL, IL-10: 0.04 pg/mL, IL-12p70: 0.11 pg/mL, IL-13: 0.24 pg/mL, TNF-α: 0.04 pg/mL. * p < 0.05; ** p < 0.01.
Preoperative SAA2 levels in LT recipients were similar to those found in healthy subjects. SAA2 remained apparently unaltered by graft reperfusion but its levels decreased significantly 24 h after reperfusion, regardless of the presence of AKI.
3. Discussion
Acute kidney injury is a frequent complication after LT with major implications on overall outcome. Traditionally, the etiology of early AKI has been ascribed to perioperative factors centered around intraoperative hemodynamic alterations and drug toxicity, although more recent evidence suggests that factors related to the liver graft itself may play a role in its development. The current study found a distinct proteomic pattern in the liver grafts of patients who would develop AKI in the immediate early postoperative course.
Five out of the first ten proteins showing higher expression in the AKI grafts are related to inflammation and its development. As all these proteins were already present in the graft early after reperfusion, it is likely that their expressions were more donor-related rather than caused by transplantation/reperfusion. Indeed, SAA2 and PLA-2 can be induced by proinflammatory cytokines such as interleukin-1b and TNF-a [12,13], both universally increased during brain death [14]. Hence, it is likely that the causes behind the differential expression of some of the proteins originate in preprocurement events.
Donor BMI was higher in the AKI grafts, and several grafts in the AKI group showed steatosis, pointing towards a role of altered lipid metabolism in the genesis of AKI after LT. Whereas the negative effect of donor steatosis on recipient and graft outcome is well known [15], a negative impact of donor steatosis on recipient kidneys is less clear. Steatosis increases susceptibility to ischemia/reperfusion injury and ultimately alters microcirculation [16], increases the mitochondrial oxidative injury, or exacerbates the innate immune response, including granulocyte and myeloid cell recruitment and cytokine release [17]. Although the early microscopic assessment did not detect overt differences in HIRI, more subtle molecular events could have evolved differently in lean grafts compared to fatty grafts, ultimately affecting the renal outcome.
The intricate interplay between lipid metabolism and inflammation likely involves numerous molecules and needs to be considered in terms of their coordinated actions. One such candidate molecule appears to be PLA 2, which was found at the top of the protein list showing increased expression in the AKI grafts. Phospholipid degradation is an important event in the development of HIRI [18], as phospholipid hydrolysis by phospholipase A2 causes membrane phospholipid breakdown, and releases free fatty acids including arachidonic acids and lysophospholipids, which serve as precursors of various inflammatory lipid derivatives [19]. Subsequently, arachidonic acid metabolism results in formation of reactive oxygen species and lipid peroxides, which in turn provide potent proinflammatory stimuli. Hence, we suggest that increased PLA2 expression in the liver grafts in the AKI group may have favored a more intense oxidative stress and, eventually, a more intense proinflammatory milieu.
Serum amyloid A2 had the largest fold change between the two study groups, likely signaling a differentially expressed local inflammatory response. At the same time, circulating SAA2 levels did not differ between groups and were within normal range. Upregulation of hepatic SAA2 protein synthesis during the acute phase response requires several hours and involves a synergistic combination of cytokines (IL-1, IL-6, and TNF-α) and glucocorticoids [20,21]. As several hours are needed for SAA2 synthesis, we speculate that the SAA2 increase was likely initiated in the donor. Interestingly, circulating SAA2 levels dropped significantly 24 h after reperfusion, suggesting either short-lived or weak stimuli or a negative regulation, pharmacologic or biological, occurring during the first 24 h after graft reperfusion. Additionally, circulating IL-6 (but no other proinflammatory cytokines) appeared higher in patients developing AKI, further supporting the hypothesis of an inflammatory mechanism behind the post-transplant AKI.
The global proteomic analysis identified the differential tissue expression of numerous proteins involved in neutrophil degranulation in the two groups. Neutrophil infiltration and degranulation are essential, well-known events during the inflammatory phase of the reperfusion injury. Several cathepsins, lysosomal proteases which primarily act as proteolytic enzymes involved in tissue remodeling [22], were among the proteins differing the most between groups. Besides neutrophil degranulation, cathepsins also regulate apoptosis, autophagy, and activation of hormones, with cathepsin C as an emblematic member of the cathepsin family. Interestingly, our study found three distinct cathepsins among the proteins differing most between the two groups. Whereas the exact significance and consequences of increased cathepsin C, F, and Z remain unclear, it is likely that they reflect the ongoing neutrophil infiltration and degranulation, multiple ongoing cleavage processes, and activation of various substrates following HIRI [23]. Although the lytic effects are most likely local, systemic secretion and effects on distant organs cannot be excluded [24]. The intense ongoing proteolytic activity is further supported by the increased expression of other proteases, such as dipeptidyl peptidase 4 (DPP4), aminopeptidase N (ANPEP), carboxypeptidase Q (CPQ), and hydrolases (N-sulphoglucosamine sulphohydrolase), in the grafts of patients developing AKI.
Although the microscopic examination of these early biopsies did not discern differences between the grafts of recipients developing AKI or not, the different trend in transaminase leak suggests different degrees of hepatocellular injury (i.e., HIRI) occurring in these two study groups. An earlier analysis found that peak AST was an independent risk factor for the development of AKI after liver transplantation, directly linking HIRI to renal injury [10]. This hypothesis is also supported by experimental evidence where plasma ALT and creatinine (and renal dysfunction) had a direct and linear relationship following murine HIRI [25]. Nonetheless, although transaminases can be informative regarding HIRI status, both AST and ALT levels initially increase manifold regardless of the severity of HIRI. A large clinical study where liver grafts were assessed both histologically and using routine liver function tests suggests instead that the drop in transaminases and its levels towards the end of the first post-transplant week could discriminate between patients with or without histologically proven HIRI [26]. If this holds true, the current results may actually suggest that liver graft recipients developing AKI may have in fact had a more advanced HIRI.
This dataset differs significantly from the limited available proteomics data in human livers undergoing ischemia–reperfusion injury or transplantation [27]. An explanation is the different study design and hypothesis but also the state-of-the-art proteomics used herein. An earlier study by Vascotto et al., using two-dimensional gel electrophoresis (2-DE) on liver graft samples, identified around 900 proteins, with 36 proteins differentially expressed during HIRI [28]. However, many of these proteins were found in as little as only one out of the nine paired samples, and the conclusions of the study were rather limited. Another similar study could identify 1580 proteins in total, with just about 140 proteins altered during reperfusion of the liver. Similarly to the study of Vascotto et al., only several proteins of these were consistently found in most of the studied grafts [29].
This analysis adds novel and comprehensive information on the proteome of liver grafts in patients ultimately developing AKI. This hypothesis has not been addressed so far as most studies focused on the development and analysis of HIRI [27]. A strength of this study is the high-performing global mass spectrometry used herein, allowing us to identify over four thousand distinct proteins and allowing its quantitative assessment. This is in contrast to the limited available data on HIRI using proteomics, which is mostly based on older proteomic strategies with low output and subject to technical errors. Another strength is the delayed introduction of tacrolimus which allowed us to exclude CNI nephrotoxicity as cause of early renal impairment. Besides that, tacrolimus has known modulating effects on reperfusion injury, which could have influenced multiple signaling pathways and biological processes [30,31].
The ongoing controversy regarding whether small postoperative increases in serum creatinine level (KDIGO grade 1) are due to AKI or not [32] led us to exclude patients developing mild kidney injury from the analysis, following their prospective inclusion. Apart from renal causes, serum creatinine can be affected by acute changes in creatinine production and/or sarcopenia as well as an altered volume of distribution. Hence, this exclusion was made in order to ensure that renal injury is the dominant cause behind the creatinine increase, obtaining a less heterogenous group as well as reducing the potential biologic variability.
This study is limited by the rather short observation time after graft reperfusion and by tissue sampling being performed at only one time point, which precluded in-depth analyses on the dynamics of certain proteins or pathways and advanced mechanistic hypotheses. It is likely that the molecular landscape will change dramatically over the first hours and days due to the intense transcriptional activity after graft reperfusion [33]. Indeed, a proteomic analysis of human livers undergoing cold storage and reperfusion revealed rapid alterations (both increases and decreases) of about 30 proteins (adaptors, kinases, GTPases) involved in signaling and cytoskeleton remodeling as soon as ten minutes after reperfusion, followed by further changes during the first hour of reperfusion [34]. Although the current data provide only a snapshot from a very complex and evolving process, they allow to delineate a group of grafts whose recipients will develop early renal complications. We find it likely and very interesting that the short time lapse from reperfusion until obtaining the biopsy did not allow for de novo protein synthesis, and, probably, at the same time, also limited the protein degradation due to oxidative stress and protease activation. Overall, we assume that many of the differences noted herein were due to initial differential expression in the donor, rather than protein degradation during cold storage and after reperfusion.
In conclusion, we found that grafts of LT patients who develop early AKI have a distinct proteome dominated by an early activation of the innate immunity, supporting the hypothesis that AKI after LT may be favored by intrinsic graft characteristics.
4. Materials and Methods
4.1. Patients and Study Design
The study protocol was reviewed and approved by the Regional Ethical Review Board in Gothenburg (Dnr: 598-13) and was conducted in accordance with the 2013 Declaration of Helsinki. Twenty-seven nonconsecutive patients undergoing primary liver transplantation between March 2014 and February 2015 were initially enrolled in the study. Donor livers were perfused and stored in either histidine–tryptophan–ketoglutarate solution (Custodiol, Fresenius, Bad Alsbach, Germany), Belzer-University of Wisconsin solution (Carnamedica, Warsaw, Poland) or Institute Georges Lopez-1 (IGL-1) (Institute Georges Lopez, Lissieu, France) solution, and kept in static cold storage until transplantation. A detailed description of all 27 donor and recipient characteristics, as well as the perioperative management, is presented elsewhere [35]. In short, liver transplantation was performed with the preservation of the recipient vena cava without the use of veno-venous bypass or portocaval shunts. Liver graft reperfusion was initiated after completion of the cavo-caval and portal vein anastomoses and before performing the arterial and biliary anastomoses. Cold ischemia time (CIT) was defined as duration from the start of cold perfusion in the donor to portal reperfusion in the recipient. Immunosuppression consisted of induction with intravenous basiliximab (day 0 and POD 4) and intraoperative corticosteroids. Maintenance immunosuppression consisted of mycophenolate mofetil introduced on day 0 and tacrolimus introduced on POD 3, with additional oral corticosteroids for patients with primary sclerosing cholangitis and autoimmune hepatitis.
A liver graft biopsy was obtained using a 14-gauge automated biopsy gun at the end of the transplant procedure, about 1 h after reperfusion. Biopsies were placed in buffered formalin until processing. A blood sample was obtained preoperatively, 2–4 h, and 20–24 h after graft reperfusion, respectively. Serum was recovered and stored in aliquots at −80 °C until analysis.
Patients were considered to have renal dysfunction if they presented AKI stage 2 and 3 according to Kidney Disease: Improving Global Outcome (KDIGO) criteria (see below) within the first 48 h after graft reperfusion. Patients without any evidence of renal dysfunction (stage 0) during the same timeframe formed a control group. Patients showing only mild renal dysfunction (stage 1) were excluded from the analyses.
4.2. Assessment of Organ Dysfunction
Daily liver function tests (AST, ALT, bilirubin, INR) were recorded over the first week as a surrogate marker of HIRI, whereas daily serum creatinine levels within the first week were used to evaluate early AKI. AKI was defined according to the KDIGO criteria and stages, without the inclusion of urine output in the creatinine-based formula [36]. The four stages are as follows: no AKI; AKI stage 1: rise in serum creatinine of 1.5–1.9 times baseline or an increase of ≥0.3 mg/dL within 48 h; stage 2: rise in serum creatinine of 2.0–2.9 times baseline; and stage 3: 3 times baseline or an increase in serum creatinine to ≥4.0 mg/dL or need for renal replacement therapy.
4.3. Histology
Formalin-fixed tissue was paraffinized, embedded, and cut into five-micron sections. Sections were stained with hematoxylin and eosin and assessed by an experienced transplant pathologist using the Suzuki score (Table 3) [37].
Table 3.
The Suzuki histological criteria.
| Grade | Congestion | Vacuolization | Necrosis |
|---|---|---|---|
| 0 | None | None | None |
| 1 | Minimal (10%) | Minimal (10%) | Singe-cell necrosis |
| 2 | Mild (<30%) | Mild (<30%) | Mild (<30%) |
| 3 | Moderate (30–60%) | Moderate (30–60%) | Moderate (30–60%) |
| 4 | Severe (>60%) | Severe (>60%) | Severe (>60%) |
Immunofluorescence was used to confirm the results of the global proteomics analysis. We studied the expression of apolipoprotein A1 (ApoA1) and platelet–endothelial cell adhesion molecule (PECAM)-1 according to the Opal protocol (PerkinElmer/Akoya, Waltham, MA, USA) according to manufacturers’ instructions using primary antibodies against ApoA1 (#ab52945, Abcam, UK) and PECAM-1 (#ab281583, Abcam). Slides were then examined blindly by an experienced pathologist, and protein overall expression was evaluated semiquantitatively from weak (+) to strong (+++). The results were then correlated with the proteomics (Spearman).
4.4. Global Protein Quantification
Proteins were quantified relatively as previously described [38]. In short, proteins were extracted from the formalin-fixed paraffin embedded samples and digested using a modified filter aided sample preparation protocol. Peptide samples were chemically labeled with tandem-mass-tag (TMT, Thermo Fisher Scientific, Waltham, MA, USA) for relative quantification, and the 20 fractions for each set from basic reverse phase separation were analyzed with nanoLC on an Orbitrap Fusion Tribrid mass spectrometer (Thermo Fisher Scientific) operating in MultiNoch MS3 mode. Protein identification and quantification were performed with Proteome Discoverer version 2.4 (Thermo Fisher Scientific) matching against Swissprot Homo sapiens database (January 2021). Differential expression analysis using a two-sample t-test on log2-transformed data was performed using the Perseus software (1.6.15.0) and R. Proteins with a p value < 0.05 and fold change (FC) ≥ 20% were considered differentially expressed.
4.5. Cytokine and Serum Amyloid A2
Samples were analyzed for a panel of cytokines using the multiplex technique. Serum concentration of IFN-γ, IL-1β, IL-2, IL-4, IL-6, IL-8, IL-10, IL-12p70, IL-13, and TNF-α was determined by the electrochemiluminescence multiplex system Sector 2400 imager from Meso Scale Discovery (K15049D-1, Gaithersburg, MD, USA). Analytes below detection limit were inputted as half the lower limit of detection in order to facilitate statistical analysis.
SAA2 serum levels were evaluated in duplicate using an ELISA kit (LS-BIO, LS-F4984, Seattle, WA, USA) according to the manufacturer’s protocol.
4.6. Statistical Analysis
For the proteomic analysis, the differential expression analysis was performed using the Perseus software (1.6.15.0) and R. Differentially expressed proteins were identified by using a two-sample t-test on log-transformed data. Proteins with a p value < 0.05 and fold change ≥ 20% were considered differentially expressed. Principal component analysis (PCA) and heat maps were used as quality control for the samples and clustering of groups. Patient-related variables were analyzed using GraphPad Prism 5.0 (Graphpad, San Diego, CA, USA). Categorical variables were assessed using chi square test, whereas continuous variables were analyzed using nonparametric tests (Kruskal–Wallis test followed by Mann–Whitney test), due to the small sample size and distribution of the results. A p value less than 0.05 denoted statistical significance.
Author Contributions
Conceptualization, Å.N., M.O., S.F. and G.H.; methodology, Å.N., M.O., A.M. and A.T.; software, C.S. and A.T; formal analysis, Å.N., M.O., A.M. and A.T.; investigation, Å.N., M.O., J.M. and G.H.; resources, M.O. and S.F.; writing—original draft preparation, Å.N., M.O. and A.T.; writing—review and editing, S.F., A.M., J.M., C.S. and G.H.; supervision, M.O. and G.H. All authors have read and agreed to the published version of the manuscript.
Institutional Review Board Statement
The study was conducted in accordance with the Declaration of Helsinki. The study protocol was reviewed and approved by the Regional Ethical Review Board in Gothenburg (Dnr: 598-13).
Informed Consent Statement
Informed consent was obtained from all subjects involved in the study.
Data Availability Statement
Access to anonymized data will be granted upon reasonable request, on condition that researchers have appropriate ethical permission and sign the appropriate Material Transfer Agreement form.
Conflicts of Interest
The authors declare no conflict of interest. The funders had no role in the design of the study; in the collection, analyses, or interpretation of data; in the writing of the manuscript; or in the decision to publish the results.
Funding Statement
This research was funded by grants from Gothenburg Society of Medicine (GLS-972660), the Swedish Kidney Foundation (to ÅN) and grant ALFGBG-965015 from the Swedish state under the agreement between the Swedish government and the country councils (to MO).
Footnotes
Publisher’s Note: MDPI stays neutral with regard to jurisdictional claims in published maps and institutional affiliations.
References
- 1.Adam R., Karam V., Cailliez V., OGrady J.G., Mirza D., Cherqui D., Klempnauer J., Salizzoni M., Pratschke J., Jamieson N., et al. 2018 Annual Report of the European Liver Transplant Registry (ELTR)—50-year evolution of liver transplantation. Improvement in early posttransplant patient survival has increased the importance of understanding the causes and risk factors for late posttransplant mortality. Transpl. Int. 2018;31:1293–1317. doi: 10.1111/tri.13358. [DOI] [PubMed] [Google Scholar]
- 2.Kwong A.J., Ebel N.H., Kim W.R., Lake J.R., Smith J.M., Schladt D.P., Skeans M.A., Foutz J., Gauntt K., Cafarella M., et al. OPTN/SRTR 2020 Annual Data Report: Liver. Am. J. Transplant. 2022;22((Suppl. 2)):204–309. doi: 10.1111/ajt.16978. [DOI] [PubMed] [Google Scholar]
- 3.Lindenger C., Castedal M., Schult A., Åberg F. Long-term survival and predictors of relapse and survival after liver transplantation for alcoholic liver disease. Scand. J. Gastroenterol. 2018;53:1553–1561. doi: 10.1080/00365521.2018.1536226. [DOI] [PubMed] [Google Scholar]
- 4.Watt K.D., Pedersen R.A., Kremers W.K., Heimbach J.K., Charlton M.R. Evolution of causes and risk factors for mortality post-liver transplant: Results of the NIDDK long-term follow-up study. Am. J. Transplant. 2010;10:1420–1427. doi: 10.1111/j.1600-6143.2010.03126.x. [DOI] [PMC free article] [PubMed] [Google Scholar]
- 5.Ojo A.O., Held P.J., Port F.K., Wolfe R.A., Leichtman A.B., Young E.W., Arndorfer J., Christensen L., Merion R.M. Chronic renal failure after transplantation of a nonrenal organ. N. Engl. J. Med. 2003;349:931–940. doi: 10.1056/NEJMoa021744. [DOI] [PubMed] [Google Scholar]
- 6.Barri Y.M., Sanchez E.Q., Jennings L.W., Melton L.B., Hays S., Levy M.F., Klintmalm G.B. Acute kidney injury following liver transplantation: Definition and outcome. Liver Transpl. 2009;15:475–483. doi: 10.1002/lt.21682. [DOI] [PubMed] [Google Scholar]
- 7.Leithead J.A., Rajoriya N., Gunson B.K., Muiesan P., Ferguson J.W. The evolving use of higher risk grafts is associated with an increased incidence of acute kidney injury after liver transplantation. J. Hepatol. 2014;60:1180–1186. doi: 10.1016/j.jhep.2014.02.019. [DOI] [PubMed] [Google Scholar]
- 8.Umbro I., Tinti F., Scalera I., Evison F., Gunson B., Sharif A., Ferguson J., Muiesan P., Mitterhofer A.P. Acute kidney injury and post-reperfusion syndrome in liver transplantation. World J. Gastroenterol. 2016;22:9314–9323. doi: 10.3748/wjg.v22.i42.9314. [DOI] [PMC free article] [PubMed] [Google Scholar]
- 9.Skytte Larsson J., Bragadottir G., Redfors B., Ricksten S.E. Renal function and oxygenation are impaired early after liver transplantation despite hyperdynamic systemic circulation. Crit. Care. 2017;21:87. doi: 10.1186/s13054-017-1675-4. [DOI] [PMC free article] [PubMed] [Google Scholar]
- 10.Jochmans I., Meurisse N., Neyrinck A., Verhaegen M., Monbaliu D., Pirenne J. Hepatic ischemia/reperfusion injury associates with acute kidney injury in liver transplantation: Prospective cohort study. Liver Transpl. 2017;23:634–644. doi: 10.1002/lt.24728. [DOI] [PubMed] [Google Scholar]
- 11.Oltean M., Bagge J., Dindelegan G., Kenny D., Molinaro A., Hellström M., Nilsson O., Sihlbom C., Casselbrant A., Davila M., et al. The Proteomic Signature of Intestinal Acute Rejection in the Mouse. Metabolites. 2021;12:23. doi: 10.3390/metabo12010023. [DOI] [PMC free article] [PubMed] [Google Scholar]
- 12.Crowl R.M., Stoller T.J., Conroy R.R., Stoner C.R. Induction of phospholipase A2 gene expression in human hepatoma cells by mediators of the acute phase response. J. Biol. Chem. 1991;266:2647–2651. doi: 10.1016/S0021-9258(18)52293-6. [DOI] [PubMed] [Google Scholar]
- 13.Moshage H. Cytokines and the hepatic acute phase response. J. Pathol. 1997;181:257–266. doi: 10.1002/(SICI)1096-9896(199703)181:3<257::AID-PATH756>3.0.CO;2-U. [DOI] [PubMed] [Google Scholar]
- 14.Pullerits R., Oltean S., Flodén A., Oltean M. Circulating resistin levels are early and significantly increased in deceased brain dead organ donors, correlate with inflammatory cytokine response and remain unaffected by steroid treatment. J. Transl. Med. 2015;13:201. doi: 10.1186/s12967-015-0574-1. [DOI] [PMC free article] [PubMed] [Google Scholar]
- 15.Chu M.J., Dare A.J., Phillips A.R., Bartlett A.S. Donor Hepatic Steatosis and Outcome After Liver Transplantation: A Systematic Review. J. Gastrointest. Surg. 2015;19:1713–1724. doi: 10.1007/s11605-015-2832-1. [DOI] [PubMed] [Google Scholar]
- 16.Seifalian A.M., Chidambaram V., Rolles K., Davidson B.R. In Vivo demonstration of impaired microcirculation in steatotic human liver grafts. Liver Transpl. Surg. 1998;4:71–77. doi: 10.1002/lt.500040110. [DOI] [PubMed] [Google Scholar]
- 17.Gehrau R.C., Mas V.R., Dumur C.I., Suh J.L., Sharma A.K., Cathro H.P., Maluf D.G. Donor Hepatic Steatosis Induce Exacerbated Ischemia-Reperfusion Injury Through Activation of Innate Immune Response Molecular Pathways. Transplantation. 2015;99:2523–2533. doi: 10.1097/TP.0000000000000857. [DOI] [PMC free article] [PubMed] [Google Scholar]
- 18.Adibhatla R.M., Hatcher J.F., Dempsey R.J. Cytidine-5′-diphosphocholine affects CTP-phosphocholine cytidylyltransferase and lyso-phosphatidylcholine after transient brain ischemia. J. Neurosci. Res. 2004;76:390–396. doi: 10.1002/jnr.20078. [DOI] [PubMed] [Google Scholar]
- 19.Ogata K., Jin M.B., Taniguchi M., Suzuki T., Shimamura T., Kitagawa N., Magata S., Fukai M., Ishikawa H., Ono T., et al. Attenuation of ischemia and reperfusion injury of canine livers by inhibition of type II phospholipase A2 with LY329722. Transplantation. 2001;71:1040–1046. doi: 10.1097/00007890-200104270-00004. [DOI] [PubMed] [Google Scholar]
- 20.Uhlar C.M., Whitehead A.S. The kinetics and magnitude of the synergistic activation of the serum amyloid A promoter by IL-1 beta and IL-6 is determined by the order of cytokine addition. Scand. J. Immunol. 1999;49:399–404. doi: 10.1046/j.1365-3083.1999.00515.x. [DOI] [PubMed] [Google Scholar]
- 21.De Buck M., Gouwy M., Wang J.M., Van Snick J., Proost P., Struyf S., Van Damme J. The cytokine-serum amyloid A-chemokine network. Cytokine Growth Factor Rev. 2016;30:55–69. doi: 10.1016/j.cytogfr.2015.12.010. [DOI] [PMC free article] [PubMed] [Google Scholar]
- 22.Ruiz-Blázquez P., Pistorio V., Fernández-Fernández M., Moles A. The multifaceted role of cathepsins in liver disease. J. Hepatol. 2021;75:1192–1202. doi: 10.1016/j.jhep.2021.06.031. [DOI] [PubMed] [Google Scholar]
- 23.Nakamura K., Kageyama S., Kupiec-Weglinski J.W. The Evolving Role of Neutrophils in Liver Transplant Ischemia-Reperfusion Injury. Curr. Transplant. Rep. 2019;6:78–89. doi: 10.1007/s40472-019-0230-4. [DOI] [PMC free article] [PubMed] [Google Scholar]
- 24.Hamon Y., Legowska M., Hervé V., Dallet-Choisy S., Marchand-Adam S., Vanderlynden L., Demonte M., Williams R., Scott C.J., Si-Tahar M., et al. Neutrophilic Cathepsin C Is Maturated by a Multistep Proteolytic Process and Secreted by Activated Cells during Inflammatory Lung Diseases. J. Biol. Chem. 2016;291:8486–8499. doi: 10.1074/jbc.M115.707109. [DOI] [PMC free article] [PubMed] [Google Scholar]
- 25.Lee H.T., Park S.W., Kim M., D’Agati V.D. Acute kidney injury after hepatic ischemia and reperfusion injury in mice. Lab Investig. 2009;89:196–208. doi: 10.1038/labinvest.2008.124. [DOI] [PMC free article] [PubMed] [Google Scholar]
- 26.Sosa R.A., Zarrinpar A., Rossetti M., Lassman C.R., Naini B.V., Datta N., Rao P., Harre N., Zheng Y., Spreafico R., et al. Early cytokine signatures of ischemia/reperfusion injury in human orthotopic liver transplantation. JCI Insight. 2016;1:e89679. doi: 10.1172/jci.insight.89679. [DOI] [PMC free article] [PubMed] [Google Scholar]
- 27.López-López V., Pérez-Sánz F., de Torre-Minguela C., Marco-Abenza J., Robles-Campos R., Sánchez-Bueno F., Pons J.A., Ramírez P., Baroja-Mazo A. Proteomics in Liver Transplantation: A Systematic Review. Front. Immunol. 2021;12:672829. doi: 10.3389/fimmu.2021.672829. [DOI] [PMC free article] [PubMed] [Google Scholar]
- 28.Vascotto C., Cesaratto L., D’Ambrosio C., Scaloni A., Avellini C., Paron I., Baccarani U., Adani G.L., Tiribelli C., Quadrifoglio F., et al. Proteomic analysis of liver tissues subjected to early ischemia/reperfusion injury during human orthotopic liver transplantation. Proteomics. 2006;6:3455–3465. doi: 10.1002/pmic.200500770. [DOI] [PubMed] [Google Scholar]
- 29.Cai H., Qi S., Yan Q., Ling J., Du J., Chen L. Global proteome profiling of human livers upon ischemia/reperfusion treatment. Clin. Proteom. 2021;18:3. doi: 10.1186/s12014-020-09310-w. [DOI] [PMC free article] [PubMed] [Google Scholar]
- 30.Garcia-Criado F.J., Palma-Vargas J.M., Valdunciel-Garcia J.J., Toledo A.H., Misawa K., Gomez-Alonso A., Toledo-Pereyra L.H. Tacrolimus (FK506) down-regulates free radical tissue levels, serum cytokines, and neutrophil infiltration after severe liver ischemia. Transplantation. 1997;64:594–598. doi: 10.1097/00007890-199708270-00008. [DOI] [PubMed] [Google Scholar]
- 31.Oltean M., Pullerits R., Zhu C., Blomgren K., Hallberg E.C., Olausson M. Donor pretreatment with FK506 reduces reperfusion injury and accelerates intestinal graft recovery in rats. Surgery. 2007;141:667–677. doi: 10.1016/j.surg.2006.11.005. [DOI] [PubMed] [Google Scholar]
- 32.Romagnoli S., Ricci Z., Ronco C. Perioperative Acute Kidney Injury: Prevention, Early Recognition, and Supportive Measures. Nephron. 2018;140:105–110. doi: 10.1159/000490500. [DOI] [PubMed] [Google Scholar]
- 33.Jassem W., Fuggle S., Thompson R., Arno M., Taylor J., Byrne J., Heaton N., Rela M. Effect of ischemic preconditioning on the genomic response to reperfusion injury in deceased donor liver transplantation. Liver Transpl. 2009;15:1750–1765. doi: 10.1002/lt.21936. [DOI] [PubMed] [Google Scholar]
- 34.Emadali A., Muscatelli-Groux B., Delom F., Jenna S., Boismenu D., Sacks D.B., Metrakos P.P., Chevet E. Proteomic analysis of ischemia-reperfusion injury upon human liver transplantation reveals the protective role of IQGAP1. Mol. Cell. Proteom. 2006;5:1300–1313. doi: 10.1074/mcp.M500393-MCP200. [DOI] [PubMed] [Google Scholar]
- 35.Norén Å., Åberg F., Mölne J., Bennet W., Friman S., Herlenius G. Perioperative kidney injury in liver transplantation: A prospective study with renal histology and measured glomerular filtration rates. Scand. J. Gastroenterol. 2022;57:595–602. doi: 10.1080/00365521.2022.2028004. [DOI] [PubMed] [Google Scholar]
- 36.Khwaja A. KDIGO clinical practice guidelines for acute kidney injury. Nephron Clin. Pract. 2012;120:c179–c184. doi: 10.1159/000339789. [DOI] [PubMed] [Google Scholar]
- 37.Suzuki S., Nakamura S., Koizumi T., Sakaguchi S., Baba S., Muro H., Fujise Y. The beneficial effect of a prostaglandin I2 analog on ischemic rat liver. Transplantation. 1991;52:979–983. doi: 10.1097/00007890-199112000-00008. [DOI] [PubMed] [Google Scholar]
- 38.Crescitelli R., Lässer C., Jang S.C., Cvjetkovic A., Malmhäll C., Karimi N., Höög J.L., Johansson I., Fuchs J., Thorsell A., et al. Subpopulations of extracellular vesicles from human metastatic melanoma tissue identified by quantitative proteomics after optimized isolation. J. Extracell. Vesicles. 2020;9:1722433. doi: 10.1080/20013078.2020.1722433. [DOI] [PMC free article] [PubMed] [Google Scholar]
Associated Data
This section collects any data citations, data availability statements, or supplementary materials included in this article.
Data Availability Statement
Access to anonymized data will be granted upon reasonable request, on condition that researchers have appropriate ethical permission and sign the appropriate Material Transfer Agreement form.