

Abstract
N6,2′-O-dimethyladenosine (m6Am) is a post-transcriptional modification that may be associated with regulatory roles in the control of cellular functions. Therefore, it is crucial to accurately identify transcriptome-wide m6Am sites to understand underlying m6Am-dependent mRNA regulation mechanisms and biological functions. Here, we used three sequence-based feature-encoding schemes, including one-hot, nucleotide chemical property (NCP), and nucleotide density (ND), to represent RNA sequence samples. Additionally, we proposed an ensemble deep learning framework, named DLm6Am, to identify m6Am sites. DLm6Am consists of three similar base classifiers, each of which contains a multi-head attention module, an embedding module with two parallel deep learning sub-modules, a convolutional neural network (CNN) and a Bi-directional long short-term memory (BiLSTM), and a prediction module. To demonstrate the superior performance of our model’s architecture, we compared multiple model frameworks with our method by analyzing the training data and independent testing data. Additionally, we compared our model with the existing state-of-the-art computational methods, m6AmPred and MultiRM. The accuracy (ACC) for the DLm6Am model was improved by 6.45% and 8.42% compared to that of m6AmPred and MultiRM on independent testing data, respectively, while the area under receiver operating characteristic curve (AUROC) for the DLm6Am model was increased by 4.28% and 5.75%, respectively. All the results indicate that DLm6Am achieved the best prediction performance in terms of ACC, Matthews correlation coefficient (MCC), AUROC, and the area under precision and recall curves (AUPR). To further assess the generalization performance of our proposed model, we implemented chromosome-level leave-out cross-validation, and found that the obtained AUROC values were greater than 0.83, indicating that our proposed method is robust and can accurately predict m6Am sites.
Keywords: N6,2′-O-dimethyladenosine; m6Am site identification; deep learning
1. Introduction
More than 160 RNA modification types have been discovered so far [1]. Among them, N6-methyladenosine (m6A) is the most widespread post-transcriptional modification of lncRNA and mRNA in mammalian cells [2]. There is another reversible modification termed N6,2′-O-dimethyladenosine (m6Am), which was originally found at the 5′ end of mRNA in viruses and animal cells in 1975 [3]. Different from m6A modification, m6Am is a terminal modification, which is usually 2′-O-methylated at the second base adjacent to the 5′ cap in many mRNAs and is further methylated at the N6 position [4] (see Figure 1). The RNA modification m6Am is catalyzed by phosphorylated C-terminal domain (CTD)-interacting factor 1, i.e., PCIF1 [5], a writer protein specific to the cap-related m6Am, and could be demethylated by the fat mass and obesity-associated protein, i.e., FTO [6], one of the m6A demethylases. Thus, m6Am is regulated by PCIF1 and FTO dynamically, educing the direction of the cap epitranscriptomics.
Figure 1.
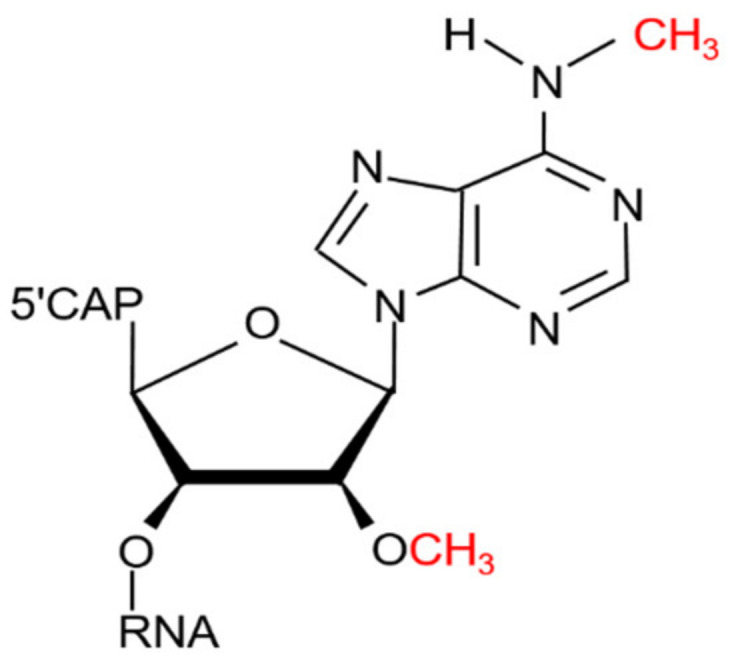
Chemical structures of m6Am [18].
Since the initial discovery of m6Am modification, some scholars have started to reveal its function. Several recent studies demonstrated that m6Am might be associated with higher protein expression [4], obesity-related translation regulation [4], increased translation efficiency [7,8], and mRNA stability [6,9,10]. Mauer et al. [6] found that the stability of transcripts that begin with m6Am was enhanced, while the stability of m6Am mRNAs could be reduced once demethylated by FTO. However, this observation was recently challenged. Wei et al. [11] reported that the expression levels of transcripts possessing cap m6Am seemed not to change with the knockdown of FTO. Moreover, another two studies [5,8] suggested that the loss of m6Am in PCIF1 knockout (KO) cells did not markedly affect the level of transcripts with m6Am. More corroborating evidence is needed to support the conclusion that m6Am can influence mRNA stability. On the other hand, it seems that m6Am modification can also affect mRNA translation. The positive association between m6Am methylation level and translation level was revealed using ribosome profiling experiments [8]. However, the biological function of m6Am has largely remained a mystery due to the lack of robust methods for sensitively identifying this modification at the transcriptome-wide level. Consequently, accurate identification of transcriptome-wide m6Am sites is crucial to understanding and exploring underlying m6Am-dependent mRNA regulation mechanisms and biological functions.
There have been efforts aiming to identify m6Am sites with wet-lab experimental methods [12,13,14]. However, such experimental methods are still expensive and time-consuming; thus, the development of computational approaches to accurately identify m6Am sites is urgently needed. Recently, researchers have attempted to computationally identify m6Am sites with machine-learning algorithms. In this field, Meng’s team first developed a computation method named m6AmPred [15] based on sequence-derived information in 2021. They collected m6Am sequencing data generated by miCLIP-seq technology from [6,16], selected 41 nt sequences centered on Adenosine (A) as positive samples, and randomly chose 41 nt sequences centered on A in non-modified BCA (B = C, G, or U) motif as negative samples. Electron–ion interaction potential and pseudo-EIIP (EIIP-PseEIIP) were employed to encode each mRNA sequence, and the eXtreme Gradient Boosting with Dart algorithm (XgbDart) was used to build the m6Am site predictor. In the same year, this team collected experimental data of twelve widely occurring RNA modifications, including m6Am sequencing data generated by miCLIP-seq [6,10,16]. Additionally, they developed an attention-based multi-label deep learning framework named MultiRM [17], consisting of an embedding module and an LSTM-Attention block, which can simultaneously predict the putative sites of twelve RNA modifications covering m6Am.
Despite recent advances in the computational identification of m6Am sites, some limitations and shortcomings still exist, as shown below. (i) Current computational methods trained on m6Am data from miCLIP-seq [6,10,16] are limited by the confidence level of training data. The experimental method miCLIP-seq for mapping m6Am relies on m6A antibodies, which is not good enough to distinguish m6Am from 5′-UTR m6A. Such an indirect approach is constrained by the limited activity of 5′ exonuclease, inaccuracy of TSS annotation, and low efficiency of UV crosslinking, thereby greatly reducing the precision and sensitivity of m6Am identification. Moreover, data sources [6,10,16] of current methods only provide m6Am peak regions with lengths ranging from 100 to 250 nt rather than the m6Am site at single-nucleotide resolution. More high-confidence data of m6Am sites are needed to construct computational models for m6Am site identification. (ii) Current computational methods do not implement sequence-redundancy removal. Generally, to reduce the redundancy in sample sequences, the CD-HIT-EST tool [19] is employed to remove sequences with sequence similarity greater than a certain threshold (typically 80%). After sequence-redundancy removal with the threshold set as 80%, we found that the original positive and negative datasets provided by m6AmPred lost 55 and 3630 sequences, respectively. (iii) The generalization performance of current computational methods remains to be further validated.
Recently, a sensitive and specific approach termed m6Am-seq [14] has been developed to directly profile transcriptome-wide m6Am, which can provide high-confidence m6Am site data at the single-nucleotide level to develop computational methods of m6Am site detection and future functional studies of m6Am modification. Moreover, in the field of m6A site prediction, MultiRM [17], DeepM6ASeq [20], and MASS [21] were successfully developed using an effective hybrid framework embedding with CNN and LSTM and achieved promising performance. Inspired by these single-nucleotide m6Am data and successful applications of deep learning frameworks, here, we present DLm6Am, an attention-based ensemble deep-learning framework to accurately identify m6Am sites. We firstly discuss the effect of several frequently used RNA sequence encoding methods, including one-hot, nucleotide chemical property (NCP), and nucleotide density (ND), on six different classifiers, including random forest (RF), support vector machine (SVM), eXtreme Gradient Boosting (XGBoost), Bi-directional long short-term memory (BiLSTM), convolutional neural network (CNN), and the embedding model CNN-BiLSTM. We found that the embedding deep learning model CNN-BiLSTM trained by fusion features could achieve the best prediction performance. Subsequently, we compared the prediction performance of the embedding deep learning model with and without an attention layer. Next, after ranking ACC values of embedding deep learning models with an attention layer under different hyper-parameters, we selected three models with the top three ACC values as base classifiers and adopted a voting strategy to build the final ensemble deep-learning model. To further assess the generalization performance of our proposed model, we implemented an independent test and also employed chromosome-level leave-one-out validation. Finally, a user-friendly webserver was established based on the proposed model and made freely accessible at http://47.94.248.117/DLm6Am/ (accessed on 15 September 2022) [22] to serve the research community. Moreover, the source code was provided in a Github repository (https://github.com/pythonLzt/DLm6Am (accessed on 15 September 2022)) to enable future uses.
2. Results and Discussion
2.1. Overview of DLm6Am
DLm6Am can identify m6Am modification sites from RNA sequences by the following steps (see Figure 2): (1) extracting m6Am sequences from the data generated by the sensitive and specific approach termed m6Am-seq, and constructing positive and negative samples using CD-HIT-EST tool; (2) generating context-based features using one-hot, NCP, and ND encoding schemes based on the primary RNA sequences; (3) establishing the ensemble-leaning-based classification model based on three CNN-BiLSTM-attention models with the top three ACC values; (4) averaging output from all the individual base classifiers as the final decision to achieve m6Am or non-m6Am prediction.
Figure 2.

The workflow and architecture of DLm6Am. DLm6Am identifies m6Am sites from RNA sequences by several key steps, including feature extraction, model construction, and m6Am site prediction. DLm6Am integrates three CNN-BiLSTM-attention models into an ensemble deep learning predictor, in which each base classifier includes multi-head-attention module, embedding module, and prediction module.
Specifically, although three base classifiers have different hyper-parameters, they possess similar architecture, mainly consisting of three parts (see Figure 2). The first module is a multi-head attention layer, which can capture the importance feature scores from individual input positions along the input sequence, thereby enhancing the learning ability of the prediction model. The second module is an embedding module that took the output of the multi-head attention layer as input and fed them into two parallel deep learning models, a CNN and a BiLSTM, respectively. The sub-module CNN, which could extract the hidden contextual features of RNA sequences, included two convolution layers to extract different input features and a maximum pooling layer to reduce the dimension of the extracted features and the amount of calculation. Moreover, the sub-module BiLSTM could capture possible long-range dependencies of the features. A fully connected layer (FCN) was followed by BiLSTM for feature dimension reduction, and the rectified linear unit (ReLU) [23] was used as the activation function to improve the computational efficiency and retain the gradient. After, we combined the two kinds of features extracted from the embedding module and fed them into the third module, a prediction module, which consists of two fully connected layers. Each of these two fully connected layers is succeeded by a dropout operation to mitigate overfitting. The Softmax function [24] was applied on the last layer to predict whether the central nucleotide A of the given RNA sequence is m6Am or non-m6Am site. More details are given in Supplementary Note S2 regarding the actual model configurations used, such as layer sizes, depth, and the number of parameters.
2.2. Comparison with Different Model Architectures
To demonstrate the superior performance of our model architecture, we compared multiple model frameworks with our method by analyzing the training data described in Section 3.1, “Benchmark dataset”, using the fusion features generated by binary encoding, NCP, and ND. The competitors mainly contained classical traditional classifiers, such as random forest (RF), support vector machine (SVM), and eXtreme Gradient Boosting (XGBoost); and deep learning feature extractors, such as CNN, BiLSTM, CNN-BiLSTM, and CNN-BiLSTM-attention. Among them, CNN-BiLSTM represents the embedding model with CNN and BiLSTM, while CNN-BiLSTM-attention represents the embedding model generated by CNN with an attention layer and BiLSTM with an attention layer. As mentioned above, our model DLm6Am is an ensemble deep learning framework integrated by three CNN-BiLSTM-attention models with the top three ACC values.
To demonstrate the stability of models, we implemented five-fold cross-validation 20 times for each model with tuned hyper-parameters. The detailed configuration of models is found in Supplementary Note S2. All detailed results generated by five-fold cross-validation on training data, including the area under the PR (Precision and Recall) curves and ROC curves, are found in Table 1. It can be seen that the standard deviations for most metrics of models are small, demonstrating the good fitness and stability of these models. Additionally, as shown in Table 1, it can be concluded that the average values of important indicators of deep-learning models were higher than those of traditional classifiers. For example, compared to the traditional classifier RF, the ACC, MCC, AUROC, and AUPR average values of the CNN model were higher by 1.02%, 2.12%, 2%, and 3.22%, respectively, while the ACC, MCC, AUROC, and AUPR average values of the BiLSTM model were increased by 0.34%, 0.71%, 1.08%, and 2.29%, respectively. Especially, our model DLm6Am was improved by 3.25%, 6.5%, 2.36%, and 3.45% in terms of ACC, MCC, AUROC, and AUPR average values, respectively, compared to RF.
Table 1.
Comparison of performance between different model architectures using five-fold cross-validation on training data.
| Model | Sn ± SD (%) | Sp ± SD (%) | ACC ± SD (%) | MCC ± SD | AUROC ± SD | AUPR ± SD |
|---|---|---|---|---|---|---|
| RF | 74.74 ± 0.51 | 75.89 ± 0.54 | 75.31 ± 0.39 | 0.5063 ± 0.0078 | 0.8273 ± 0.0012 | 0.8163 ± 0.0021 |
| SVM | 77.06 ± 0.42 | 73.46 ± 0.72 | 75.26 ± 0.39 | 0.5055 ± 0.0078 | 0.8323 ± 0.0027 | 0.8288 ± 0.0029 |
| XGBoost | 75.42 ± 0.62 | 75.54 ± 0.64 | 75.48 ± 0.55 | 0.5096 ± 0.0111 | 0.8325 ± 0.0031 | 0.8362 ± 0.0031 |
| CNN | 75.95 ± 3.21 | 76.71 ± 2.73 | 76.33 ± 0.50 | 0.5275 ± 0.0097 | 0.8473 ± 0.0043 | 0.8485 ± 0.0047 |
| BiLSTM | 76.17 ± 2.32 | 75.14 ± 2.06 | 75.65 ± 0.67 | 0.5134 ± 0.0134 | 0.8381 ± 0.0047 | 0.8392 ± 0.0053 |
| CNN-BiLSTM | 78.33 ± 1.08 | 76.55 ± 1.11 | 77.45 ± 0.29 | 0.5491 ± 0.0058 | 0.8462 ± 0.0034 | 0.8432 ± 0.0045 |
| CNN-BiLSTM-attention | 78.60 ± 0.81 | 77.82 ± 0.78 | 78.21 ± 0.29 | 0.5643 ± 0.0058 | 0.8488 ± 0.0031 | 0.8464 ± 0.0053 |
| DLm6Am | 78.94 ± 0.79 | 78.18 ± 0.60 | 78.56 ± 0.27 | 0.5713 ± 0.0054 | 0.8509 ± 0.0027 | 0.8508 ± 0.0033 |
Additionally, we implemented a series of ablation tests to demonstrate the superiority of our model architecture. Firstly, the framework without ensemble learning, i.e., CNN–BiLSTM–attention was included in comparison with our proposed model, DLm6Am. It can be seen from Table 1 that the ACC, MCC, AUROC, and AUPR average values of the CNN–BiLSTM–attention were reduced by 0.35%, 0.7%, 0.21%, and 0.44%, respectively. This demonstrates that the prediction performance for m6Am site identification can be further improved using ensemble learning. Secondly, the embedding architecture without the attention module CNN-BilSTM was also compared with DLm6Am and CNN–BiLSTM–attention. The CNN–BiLSTM–attention framework achieved higher performance than the embedding architecture without an attention layer in terms of ACC, MCC, AUROC, and AUPR. This indicates that the attention mechanism has the capacity to identify m6Am key information, thereby improving model performance. The metric values of DLm6Am were improved overall compared to those of CNN-BilSTM, indicating that ensemble learning and the attention mechanism are of crucial importance in identifying m6Am sites. Moreover, the embedding deep learning model CNN-BiLSTM is superior to single deep learning models in terms of ACC and MCC, because the embedding deep learning model can gain the advantage of CNN and BiLSTM to simultaneously capture possible local-range and long-range dependencies of the features. Compared with single deep learning models, the performance of our model has obvious advantages, e.g., our model DLm6Am was improved by 2.77%, 3.04%, 2.91%, 5.79%, 1.28%, and 1.16% over BiLSTM in terms of average values of Sn, Sp, ACC, MCC, AUROC, and AUPR, respectively.
As some of the differences are minimal when compared with other methods, on the one hand, we sought to find an effective solution for the additional performance gains of the DLm6Am model while varying model complexity (e.g., the number of layers/nodes), as well varying/increasing training set size. The results listed in Table S1 of Supplementary Note S3 show that DLm6Am can achieve better prediction performance under the current model configurations used in this study. On the other hand, we calculated the statistical significance of the observed differences using the Wilcoxon test. A graphical representation of results, shown in Figure 3, was mainly created by the R package “ggplot2”, which can provide a single layer geom_signif to calculate the significance of a difference between metric values of DLm6Am and other models. The level of significance (NS, *, **, ***) was added to the plot in a single line. As seen, with the exception of AUPR values of DLm6Am and CNN, the observed differences between DLm6Am and other models are significant. Based on these results, the embedding architecture CNN–BiLSTM–attention and ensemble learning were chosen to build the DLm6Am model.
Figure 3.

Performance analysis of different m6Am prediction models using five-fold cross-validation on training data. Subgraphs (a–d) represent boxplots of ACC, MCC, AUROC, and AUPR of different models, respectively. The level of significance (NS, *, **, ***) represents non-significant (p > 0.05), low significance (p < 0.05), medium significance (p < 0.01), and high significance (p < 0.001), respectively.
To further confirm the superiority of our proposed framework, we compared the prediction performance of DLm6Am and other combinations of different base classifiers, such as SVM, RF, XGBoost, LSTM, and CNN. The ensemble classification results are listed in Table S2 of Supplementary Note S4. It can be seen that the DLm6Am achieved better prediction performance than other ensemble combinations.
Next, we used the independent testing data mentioned in Section 2.1, “Benchmark dataset”, to evaluate the generalization performance of these different models. All the testing results are listed in Table 2. Additionally, Figure 4 illustrates the comparison results based on PR curves and the ROC curves of different methods. It can be seen from Table 2 and Figure 4 that our proposed DLm6Am are generally better than the other models, further demonstrating the advantages of embedding deep-learning architecture and ensemble learning. These independent testing results indicate that our method can be used to accurately identify novel m6Am sites that have not been seen in training data.
Table 2.
Comparison of performance between different model architectures using independent testing data.
| Model | Sn (%) | Sp (%) | ACC (%) | MCC | AUROC |
|---|---|---|---|---|---|
| RF | 75.77 | 76.90 | 76.34 | 0.5268 | 0.8380 |
| SVM | 75.49 | 77.18 | 76.34 | 0.5268 | 0.8438 |
| XGBoost | 74.37 | 76.06 | 75.21 | 0.5043 | 0.8435 |
| CNN | 69.58 | 86.20 | 77.89 | 0.5656 | 0.8580 |
| BiLSTM | 72.96 | 78.03 | 75.49 | 0.5105 | 0.8341 |
| CNN-BiLSTM | 79.89 | 77.21 | 78.55 | 0.5712 | 0.8603 |
| CNN-BiLSTM-attention | 77.21 | 80.45 | 78.84 | 0.5769 | 0.8612 |
| DLm6Am | 81.71 | 77.40 | 79.55 | 0.5916 | 0.8634 |
Figure 4.

Performance analysis of different m6Am prediction models using independent testing data. (a) Receiver operating characteristic (ROC) curves of different models. (b) Precision–recall curves of different models.
2.3. Hold-Out Cross-Validation on Chromosome Level
Hold-out cross-validation is generally an effective method to validate the generalization performance of the proposed models. In this study, for chromosomes associated with data greater than 50, we used data of each chromosome as the testing data to evaluate the performance of the model trained on the data of the remaining chromosomes. Additionally, because the data sizes of chromosomes 13, 18, 20, 21, and 22 are all less than 50, these data were integrated as one testing dataset, while the remaining data of chromosomes were used as a training dataset. For all hold-out cross-validation, models were fitted on the training data using the same hyper-parameters of DLm6Am for the strict evaluation of generalization performance.
The results using hold-out cross-validation on chromosome level are reported in Table 3. It can be clearly seen that the most important metric, AUROC, is greater than 0.83, indicating that our proposed method is robust and can accurately predict m6Am sites on different chromosome data.
Table 3.
The performance of our method using hold-out cross-validation on chromosome level.
| Chromosome | Sn (%) | Sp (%) | ACC (%) | MCC | AUROC |
|---|---|---|---|---|---|
| Chr1 | 76.96 | 80.20 | 78.61 | 0.5721 | 0.8490 |
| Chr2 | 83.48 | 76.52 | 80.00 | 0.6015 | 0.8749 |
| Chr3 | 77.00 | 79.63 | 78.37 | 0.5665 | 0.8575 |
| Chr4 | 81.25 | 78.46 | 79.84 | 0.5973 | 0.8663 |
| Chr5 | 91.25 | 81.94 | 86.84 | 0.7373 | 0.9255 |
| Chr6 | 77.66 | 76.24 | 76.92 | 0.5386 | 0.8332 |
| Chr7 | 84.78 | 77.42 | 81.08 | 0.6236 | 0.8789 |
| Chr8 | 84.62 | 80.70 | 82.57 | 0.6525 | 0.8691 |
| Chr9 | 81.16 | 80.30 | 80.74 | 0.6146 | 0.8678 |
| Chr10 | 87.50 | 77.46 | 82.52 | 0.6532 | 0.8533 |
| Chr11 | 85.19 | 75.53 | 80.69 | 0.6116 | 0.8696 |
| Chr12 | 76.34 | 82.18 | 79.38 | 0.5867 | 0.8549 |
| Chr14 | 83.33 | 77.11 | 80.00 | 0.6030 | 0.8531 |
| Chr15 | 83.10 | 86.36 | 84.67 | 0.6942 | 0.9078 |
| Chr16 | 79.69 | 83.61 | 81.60 | 0.6329 | 0.8768 |
| Chr17 | 82.57 | 77.57 | 80.09 | 0.6023 | 0.8298 |
| Chr19 | 82.41 | 77.78 | 80.19 | 0.6029 | 0.8585 |
| ChrX | 75.82 | 90.28 | 82.21 | 0.6580 | 0.9087 |
| Chr13, 18, 20, 21, and 22 | 87.38 | 72.36 | 79.20 | 0.5979 | 0.8773 |
2.4. Comparison with Existing Methods
To further assess the performance of DLm6Am, we compared our model with the other existing state-of-the-art computational methods, MultiRM and m6AmPred, to identify m6Am sites in RNA sequences. Among them, MultiRM consists of three parts, in which the first module takes the one-hot encoding of RNA sequences as input and adopts three different embedding techniques to embed features; then, the embedding features are fed into an LSTM and an attention layer. For m6AmPred, electron–ion interaction potential (EIIP) and Pseudo-EIIP (PseEIIP) were used as encoding schemes to represent the sample sequences, and the eXtreme Gradient Boosting with Dart algorithm (XgbDart) was employed to build the final model. Here, to provide a fair performance comparison, we applied an identical encoding scheme and classification algorithm to the training data used in this study and used independent testing data to evaluate the constructed model.
All the results using five-fold cross-validation on training data and using independent testing data are deposited in Figure 5a,d, respectively. It can be seen clearly that DLm6Am showed better predictive performance than the other two predictors. More specifically, Sn, Sp, ACC, MCC, AUROC, and AUPR for the DLm6Am model outperformed m6AmPred using five-fold cross-validation on training data, by 5.43%, 6.84%, 6.13%, 12.26%, 4.60%, and 4.27%, respectively. Sn, Sp, ACC, MCC, AUROC, and AUPR of DLm6Am were higher than those of MultiRM by 5.43%, 11.42%, 8.42%, 17.14%, 7.18%, and 7.55%, respectively. Moreover, in comparison with m6AmPred using independent testing data, Sn, Sp, ACC, MCC, AUROC, and AUPR for the DLm6Am model were improved by 9.60%, 3.32%, 6.45%, 12.95%, 4.28%, and 4.26%, respectively. Compared with MultiRM, these metric values were increased by 3.12%, 13.74%, 8.42%, 16.43%, 5.75%, and 6.57%, respectively. This result suggests that joint use of the hybrid architecture CNN–BiLSTM–attention and ensemble learning has a strong potential for application in other modification site prediction tasks in RNAs.
Figure 5.

Performance comparison with existing methods. (a–c) Performance comparison between MultiRM, m6AmPred, and our method DLm6Am using five-fold cross-validation on training data. (d–f) Performance comparison between MultiRM, m6AmPred, and our method DLm6Am using independent testing data.
Additionally, both ROC and PR curves were plotted to demonstrate the performance of MultiRM, m6AmPred, and DLm6Am (Figure 5). The DLm6Am model had much higher performance than MultiRM and m6AmPred, further illustrating the stability and generalization ability of our proposed model, DLm6Am.
2.5. Webserver Functionality
To achieve quick prediction of m6Am sites from RNA sequences, a user-friendly web interface DLm6Am was developed based on python using the web micro-framework Flask. The webserver DLm6Am has several user interfaces and provides multiple functions, including m6Am site prediction, the introduction of this webserver, data download, and citation of the relevant literature. DLm6Am allows users to perform prediction by typing or copying/pasting the query RNA sequences with FASTA format into the input box. After a short online wait, the results will be displayed on the webserver. Additionally, the users can receive the prediction results by email without a long wait after uploading a FASTA file with multiple RNA sequences of interest and inputting the email address and job IDs. In summary, this service allows researchers to identify the transcriptome-wide m6Am sites, thereby enabling researchers to understand underlying m6Am-dependent mRNA regulation mechanisms and biological functions.
3. Materials and Methods
3.1. Benchmark Dataset
Recently, Sun et al. [14] developed a sensitive and direct method named m6Am-seq to identify transcriptome-wide m6Am and provided 2166 high-confidence m6Am sites at single-nucleotide resolution throughout the human transcriptome. In terms of these site information and the human genome assembly hg19, we can extract corresponding sample sequences using the (2ξ + 1)-nt long sliding window, formulated as below.
| (1) |
where the double-line character represents the nucleotide adenosine in BCA (B = C, G, or U) motifs, the value of subscript is an integer, represents the -th upstream nucleotide from the center, represents the -th downstream nucleotide from the center, and so on. In this study, after preliminary analysis, ξ value was set to 41. If the centers of RNA sequence segments are the experimentally confirmed m6Am sites, these sequences are regarded as positive candidate samples and are put into the positive dataset . Otherwise, the RNA sequence segments are considered negative samples and are classified into the negative dataset . After reducing the sequence identity to 80% by using CD-HIT-EST tool [19], we randomly selected negative samples at 1:1 positive-to-negative ratio to construct the final benchmark dataset (), summarized in Table 4. For constructing and training the prediction model, we randomly sampled 80% of data from the benchmark dataset as training set, and the remaining 20% was considered as independent testing dataset to test the prediction performance of the constructed model. This ratio of the training/testing set was obtained by analyzing the effect of training set size on performance (Figure S1, Supplementary Note S1). The training and independent testing can be downloaded from http://47.94.248.117/DLm6Am/download (accessed on 15 September 2022) [22].
Table 4.
The distribution of sample numbers in different chromosomes.
| Chromosome | Positive | Negative | Chromosome | Positive | Negative |
|---|---|---|---|---|---|
| Chr1 | 191 | 197 | Chr13 | 32 | 39 |
| Chr2 | 115 | 115 | Chr14 | 72 | 83 |
| Chr3 | 100 | 108 | Chr15 | 71 | 66 |
| Chr4 | 64 | 65 | Chr16 | 64 | 61 |
| Chr5 | 80 | 72 | Chr17 | 109 | 107 |
| Chr6 | 94 | 101 | Chr18 | 16 | 18 |
| Chr7 | 92 | 93 | Chr19 | 108 | 99 |
| Chr8 | 52 | 57 | Chr20 | 37 | 44 |
| Chr9 | 69 | 66 | Chr21 | 18 | 22 |
| Chr10 | 72 | 71 | Chr22 | 26 | 23 |
| Chr11 | 108 | 94 | ChrX | 91 | 72 |
| Chr12 | 93 | 101 | Total | 1774 | 1774 |
3.2. Feature Extraction from RNA Sequence
It is essential to carefully design and extract features to develop robust and reliable computational methods of m6Am site identification. Various feature-encoding methods have been developed to represent and convert RNA sequences into numeric vectors, such as context-based features, structure-based features, and integrated features. Majority of these features could be easily generated by useful bioinformatics tools, such as PseKNC [25], iLearn [26], and iLearnPlus [27]. In this study, we selected the most prevalent context-based features to represent RNA sequence fragments, including one-hot, nucleotide chemical property (NCP), and nucleotide density (ND).
3.2.1. Binary Encoding of Nucleotide
Binary encoding of nucleotide is a simple and efficient method to characterize sample sequences of protein, DNA, or RNA. Generally, four types of nucleotide, i.e., A (adenine), C (cytosine), G (guanine), and U (uracil), can be encoded by (1, 0, 0, 0), (0, 1, 0, 0), (0, 0, 1, 0), and (0, 0, 0, 1), respectively. Thus, each sample sequence with 41 nt length can be transformed into a 41 × 4 numerical matrix.
3.2.2. Nucleotide Chemical Property (NCP)
In terms of ring structures (two for purines, i.e., A and G, one for pyrimidines, i.e., C and U), chemical functionality (amino group for A and C, keto group for G and U), and strength of hydrogen bonding interaction between the base pairs (stronger between C and G, weaker between A and U), the four types of nucleotides can be classified into three different categories. Thus, the -th nucleotide of a given sample sequence formulated by Equation (1) can be represented by a 3-dimensional vector, as shown below.
| (2) |
where represents ring structures, for chemical functionality, and for hydrogen bond. Therefore, each sample sequence with 41 nt length can be converted into a 41 × 3 numerical matrix.
3.2.3. Nucleotide Density (ND)
Nucleotide density, also termed accumulated nucleotide frequency (ANF), represents the accumulated frequency distribution of the nucleotide at each position along a given sample sequence. Specifically, nucleotide density of the nucleotide in the sample sequence can be calculated by the number of occurrences of the nucleotide in the region from position 1 to position divided by the length of this region. For example, if the given sequence is “ACGACUUAGA”, it can be transformed into a numerical vector (1, 1/2, 1/3, 2/4, 2/5, 1/6, 2/7, 3/8, 2/9, 4/10). Generally, this feature can be combined with NCP to form a widely applied fusion feature named NCPD [28,29,30,31,32,33,34,35,36].
3.3. Classification Method
Generally, three types of major prediction algorithms have been employed to implement various prediction tasks in bioinformatics field, including (i) scoring-function-based methods, such as positional weight matrix (PWM) [37]; position-correlation scoring function (PCSF) [38] and relative stability (DE) [39]; (ii) traditional machine-learning-based method, such as random forest (RF) [40], support vector machine (SVM) [41], and decision tree (DT) [42]; and (iii) deep-learning-based methods, such as convolutional neural network (CNN) [43] and long short-term memory (LSTM) [44].
Deep-learning-based methods have been widely applied in biological research [17,45,46,47,48,49], especially for CNN and LSTM. The CNN framework can depict latent information of sequential features by integrating local dependencies, and LSTM architecture can capture possible long-range dependencies of the features. Recently, an effective hybrid framework embedding with CNN and LSTM has been successfully used in m6A site prediction, such as MultiRM [17], DeepM6ASeq [20], and MASS [21]. Inspired by these successful applications, in this study, we constructed an embedded deep-learning model with multi-head attention layer using CNN and BiLSTM to identify m6Am sites from RNA sequences. Finally, to further improve the generalization performance, we selected three embedded models with top three ACC values under different hyper-parameter combinations as base classifiers and adopted voting strategy to obtain the final ensemble deep-learning model, named DLm6Am. To demonstrate the superiority of our model architecture, we designed a series of ablation tests, including the model architecture without ensemble learning (CNN-BiLSTM-attention), without the attention layer (CNN-BiLSTM), and single deep-learning models.
3.4. Performance Evaluation
Prediction performance of the proposed models is generally measured using several metrics, such as sensitivity (Sn), specificity (Sp), accuracy (ACC), and Matthews correlation coefficient (MCC), formulated by the following equation.
| (3) |
where TP, FN, TN, and FP stand for the numbers of true positives, false negatives, true negatives, and false positives, respectively. Additionally, the area under receiver operating characteristic curve (AUROC) and the area under precision and recall curves (AUPR) are usually calculated to evaluate the prediction performance. If their value is higher, the prediction performance is better.
4. Conclusions
In this study, we have developed a new computational method, called DLm6Am, to predict the transcriptome-wide likelihoods of m6Am sites. DLm6Am is a deep-learning-based framework integrated by three base classifiers with the top three ACC values, which have similar network architectures. Each of the base classifiers has three parts, a built-in attention module to help extract useful sequence patterns, an embedding module consisting of a CNN and a BiLSTM for extracting features from RNA sample sequences, and a prediction module consisting of two fully connected layers to obtain a final prediction decision. The ablation tests in Section 3.2 showed the superiority of our designed framework. Moreover, independent tests and hold-out cross-validation on the chromosome level have demonstrated the generalization capacity of our model in predicting novel m6Am sites. Comparison results on benchmark datasets have illustrated the superior prediction performance of DLm6Am over other state-of-the-art methods, m6AmPred and MultiRM. However, currently, we only used limited experimental data to construct the model for m6Am site prediction. In the future, we will collect large-scale experimental data to develop better prediction algorithms.
Acknowledgments
The authors are also grateful to Xiang Chen for the extensive revision of written English. Moreover, the authors thank Guoying Zou and Weizhong Lin for the helpful discussions.
Supplementary Materials
The following supporting information can be downloaded at: https://www.mdpi.com/article/10.3390/ijms231911026/s1.
Author Contributions
Conceptualization, methodology, writing—original draft preparation, writing—review and editing, supervision, project administration, Z.X. and X.X.; software, visualization, W.S. and Z.L.; validation, Z.L., W.S. and L.L.; formal analysis, investigation, W.S. and W.Q.; data curation, Z.L.; resources, funding acquisition, Z.X., X.X. and W.Q. All authors have read and agreed to the published version of the manuscript.
Institutional Review Board Statement
Not applicable.
Informed Consent Statement
Not applicable.
Data Availability Statement
The training and independent testing used in this study can be downloaded from http://47.94.248.117/DLm6Am/download (accessed on 15 September 2022).
Conflicts of Interest
The authors declare no conflict of interest.
Funding Statement
This research was funded by the National Nature Scientific Foundation of China, grant numbers 62062043, 32270789, 31860312, and 62162032.
Footnotes
Publisher’s Note: MDPI stays neutral with regard to jurisdictional claims in published maps and institutional affiliations.
References
- 1.Boccaletto P., Stefaniak F., Ray A., Cappannini A., Mukherjee S., Purta E., Kurkowska M., Shirvanizadeh N., Destefanis E., Groza P., et al. MODOMICS: A database of RNA modification pathways. 2021 update. Nucleic Acids Res. 2022;50:D231–D235. doi: 10.1093/nar/gkab1083. [DOI] [PMC free article] [PubMed] [Google Scholar]
- 2.Zhao B.S., Roundtree I.A., He C. Post-transcriptional gene regulation by mRNA modifications. Nat. Rev. Mol. Cell Biol. 2017;18:31–42. doi: 10.1038/nrm.2016.132. [DOI] [PMC free article] [PubMed] [Google Scholar]
- 3.Wei C.-M., Gershowitz A., Moss B. N6, O2′-dimethyladenosine a novel methylated ribonucleoside next to the 5′ terminal of animal cell and virus mRNAs. Nature. 1975;257:251–253. doi: 10.1038/257251a0. [DOI] [PubMed] [Google Scholar]
- 4.Ben-Haim M.S., Pinto Y., Moshitch-Moshkovitz S., Hershkovitz V., Kol N., Diamant-Levi T., Beeri M.S., Amariglio N., Cohen H.Y., Rechavi G. Dynamic regulation of N6,2′-O-dimethyladenosine (m6Am) in obesity. Nat. Commun. 2021;12:7185. doi: 10.1038/s41467-021-27421-2. [DOI] [PMC free article] [PubMed] [Google Scholar]
- 5.Sendinc E., Valle-Garcia D., Dhall A., Chen H., Henriques T., Navarrete-Perea J., Sheng W., Gygi S.P., Adelman K., Shi Y. PCIF1 Catalyzes m6Am mRNA Methylation to Regulate Gene Expression. Mol. Cell. 2019;75:620–630.e9. doi: 10.1016/j.molcel.2019.05.030. [DOI] [PMC free article] [PubMed] [Google Scholar]
- 6.Mauer J., Luo X., Blanjoie A., Jiao X., Grozhik A.V., Patil D.P., Linder B., Pickering B.F., Vasseur J.-J., Chen Q., et al. Reversible methylation of m6Am in the 5′ cap controls mRNA stability. Nature. 2017;541:371–375. doi: 10.1038/nature21022. [DOI] [PMC free article] [PubMed] [Google Scholar]
- 7.Schwartz S., Mumbach M.R., Jovanovic M., Wang T., Maciag K., Bushkin G.G., Mertins P., Ter-Ovanesyan D., Habib N., Cacchiarelli D., et al. Perturbation of m6A Writers Reveals Two Distinct Classes of mRNA Methylation at Internal and 5′ Sites. Cell Rep. 2014;8:284–296. doi: 10.1016/j.celrep.2014.05.048. [DOI] [PMC free article] [PubMed] [Google Scholar]
- 8.Akichika S., Hirano S., Shichino Y., Suzuki T., Nishimasu H., Ishitani R., Sugita A., Hirose Y., Iwasaki S., Nureki O., et al. Cap-specific terminal N-6-methylation of RNA by an RNA polymerase II-associated methyltransferase. Science. 2019;363:eaav0080. doi: 10.1126/science.aav0080. [DOI] [PubMed] [Google Scholar]
- 9.Pandey R.R., Delfino E., Homolka D., Roithova A., Chen K.-M., Li L., Franco G., Vågbø C.B., Taillebourg E., Fauvarque M.-O., et al. The Mammalian Cap-Specific m6Am RNA Methyltransferase PCIF1 Regulates Transcript Levels in Mouse Tissues. Cell Rep. 2020;32:108038. doi: 10.1016/j.celrep.2020.108038. [DOI] [PubMed] [Google Scholar]
- 10.Boulias K., Toczydłowska-Socha D., Hawley B.R., Liberman N., Takashima K., Zaccara S., Guez T., Vasseur J.-J., Debart F., Aravind L., et al. Identification of the m6Am Methyltransferase PCIF1 Reveals the Location and Functions of m6Am in the Transcriptome. Mol. Cell. 2019;75:631–643.e8. doi: 10.1016/j.molcel.2019.06.006. [DOI] [PMC free article] [PubMed] [Google Scholar]
- 11.Wei J., Liu F., Lu Z., Fei Q., Ai Y., He P.C., Shi H., Cui X., Su R., Klungland A., et al. Differential m6A, m6Am, and m1A Demethylation Mediated by FTO in the Cell Nucleus and Cytoplasm. Mol. Cell. 2018;71:973–985.e5. doi: 10.1016/j.molcel.2018.08.011. [DOI] [PMC free article] [PubMed] [Google Scholar]
- 12.Hawley B.R., Jaffrey S.R. Transcriptome-Wide Mapping of m6A and m6Am at Single-Nucleotide Resolution Using miCLIP. Curr. Protoc. Mol. Biol. 2019;126:e88. doi: 10.1002/cpmb.88. [DOI] [PMC free article] [PubMed] [Google Scholar]
- 13.Koh C.W.Q., Goh Y.T., Goh W.S.S. Atlas of quantitative single-base-resolution N6-methyl-adenine methylomes. Nat. Commun. 2019;10:5636. doi: 10.1038/s41467-019-13561-z. [DOI] [PMC free article] [PubMed] [Google Scholar]
- 14.Sun H., Li K., Zhang X., Liu J., Zhang M., Meng H., Yi C. m6Am-seq reveals the dynamic m6Am methylation in the human transcriptome. Nat. Commun. 2021;12:4778. doi: 10.1038/s41467-021-25105-5. [DOI] [PMC free article] [PubMed] [Google Scholar]
- 15.Jiang J., Song B., Chen K., Lu Z., Rong R., Zhong Y., Meng J. m6AmPred: Identifying RNA N6, 2’-O-dimethyladenosine (m6Am) sites based on sequence-derived infor-mation. Methods. 2021;203:328–334. doi: 10.1016/j.ymeth.2021.01.007. [DOI] [PubMed] [Google Scholar]
- 16.Linder B., Grozhik A.V., Olarerin-George A.O., Meydan C., Mason C.E., Jaffrey S.R. Single-nucleotide-resolution mapping of m6A and m6Am throughout the transcriptome. Nat. Methods. 2015;12:767–772. doi: 10.1038/nmeth.3453. [DOI] [PMC free article] [PubMed] [Google Scholar]
- 17.Song Z., Huang D., Song B., Chen K., Song Y., Liu G., Su J., de Magalhães J.P., Rigden D.J., Meng J. Attention-based multi-label neural networks for integrated prediction and interpretation of twelve widely occurring RNA modifications. Nat. Commun. 2021;12:4011. doi: 10.1038/s41467-021-24313-3. [DOI] [PMC free article] [PubMed] [Google Scholar]
- 18.Liu J., Li K., Cai J., Zhang M., Zhang X., Xiong X., Meng H., Xu X., Huang Z., Peng J., et al. Landscape and Regulation of m6A and m6Am Methylome across Human and Mouse Tissues. Mol. Cell. 2019;77:426–440.e6. doi: 10.1016/j.molcel.2019.09.032. [DOI] [PubMed] [Google Scholar]
- 19.Li W., Godzik A. Cd-hit: A fast program for clustering and comparing large sets of protein or nucleotide sequences. Bioinformatics. 2006;22:1658–1659. doi: 10.1093/bioinformatics/btl158. [DOI] [PubMed] [Google Scholar]
- 20.Zhang Y., Hamada M. DeepM6ASeq: Prediction and characterization of m6A-containing sequences using deep learning. BMC Bioinform. 2018;19:524. doi: 10.1186/s12859-018-2516-4. [DOI] [PMC free article] [PubMed] [Google Scholar]
- 21.Xiong Y., He X., Zhao D., Tian T., Hong L., Jiang T., Zeng J. Modeling multi-species RNA modification through multi-task curriculum learning. Nucleic Acids Res. 2021;49:3719–3734. doi: 10.1093/nar/gkab124. [DOI] [PMC free article] [PubMed] [Google Scholar]
- 22.DLm6Am: A Deep-Learning-Based Tool for Identifying N6,2′-O-Dimethyladenosine Sites in RNA Sequences. [(accessed on 15 September 2022)]. Available online: http://47.94.248.117/DLm6Am/ [DOI] [PMC free article] [PubMed]
- 23.Glorot X., Bordes A., Bengio Y. Deep Sparse Rectifier Neural Networks; Proceedings of the Fourteenth International Conference on Artificial Intelligence and Statistics; Fort Lauderdale, FL, USA. 11–13 April 2011; pp. 315–323. [Google Scholar]
- 24.Williams C., Barber D. Bayesian classification with Gaussian processes. IEEE Trans. Pattern Anal. Mach. Intell. 1998;20:1342–1351. doi: 10.1109/34.735807. [DOI] [Google Scholar]
- 25.Chen W., Lei T.-Y., Jin D.-C., Lin H., Chou K.-C. PseKNC: A flexible web server for generating pseudo K-tuple nucleotide composition. Anal. Biochem. 2014;456:53–60. doi: 10.1016/j.ab.2014.04.001. [DOI] [PubMed] [Google Scholar]
- 26.Chen Z., Zhao P., Li F., Marquez-Lago T.T., Leier A., Revote J., Zhu Y., Powell D.R., Akutsu T., Webb G.I., et al. iLearn: An integrated platform and meta-learner for feature engineering, machine-learning analysis and modeling of DNA, RNA and protein sequence data. Brief. Bioinform. 2019;21:1047–1057. doi: 10.1093/bib/bbz041. [DOI] [PubMed] [Google Scholar]
- 27.Chen Z., Zhao P., Li C., Li F., Xiang D., Chen Y.Z., Akutsu T., Daly R.J., Webb G.I., Zhao Q., et al. iLearnPlus: A comprehensive and automated machine-learning platform for nucleic acid and protein sequence analysis, prediction and visualization. Nucleic Acids Res. 2021;49:e60. doi: 10.1093/nar/gkab122. [DOI] [PMC free article] [PubMed] [Google Scholar]
- 28.Chen W., Tran H., Liang Z., Lin H., Zhang L. Identification and analysis of the N6-methyladenosine in the Saccharomyces cerevisiae transcriptome. Sci. Rep. 2015;5:13859. doi: 10.1038/srep13859. [DOI] [PMC free article] [PubMed] [Google Scholar]
- 29.Feng P., Ding H., Yang H., Chen W., Lin H., Chou K.C. iRNA-PseColl: Identifying the Occurrence Sites of Different RNA Modifications by Incorporating Collective Effects of Nucleotides into PseKNC. Mol. Ther. Nucleic Acids. 2017;7:155–163. doi: 10.1016/j.omtn.2017.03.006. [DOI] [PMC free article] [PubMed] [Google Scholar]
- 30.Chen W., Tang H., Lin H. MethyRNA: A web server for identification of N6-methyladenosine sites. J. Biomol. Struct. Dyn. 2017;35:683–687. doi: 10.1080/07391102.2016.1157761. [DOI] [PubMed] [Google Scholar]
- 31.Chen W., Feng P., Yang H., Ding H., Lin H., Chou K.-C. iRNA-3typeA: Identifying Three Types of Modification at RNA’s Adenosine Sites. Mol. Ther. Nucleic Acids. 2018;11:468–474. doi: 10.1016/j.omtn.2018.03.012. [DOI] [PMC free article] [PubMed] [Google Scholar]
- 32.Chen W., Feng P., Ding H., Lin H. Identifying N6-methyladenosine sites in the Arabidopsis thaliana transcriptome. Mol. Genet. Genom. 2016;291:2225–2229. doi: 10.1007/s00438-016-1243-7. [DOI] [PubMed] [Google Scholar]
- 33.Dao F.-Y., Lv H., Yang Y.-H., Zulfiqar H., Gao H., Lin H. Computational identification of N6-methyladenosine sites in multiple tissues of mammals. Comput. Struct. Biotechnol. J. 2020;18:1084–1091. doi: 10.1016/j.csbj.2020.04.015. [DOI] [PMC free article] [PubMed] [Google Scholar]
- 34.Khan A., Rehman H.U., Habib U., Ijaz U. Detecting N6-methyladenosine sites from RNA transcriptomes using random forest. J. Comput. Sci. 2020;47:101238. doi: 10.1016/j.jocs.2020.101238. [DOI] [Google Scholar]
- 35.Islam N., Park J. bCNN-Methylpred: Feature-Based Prediction of RNA Sequence Modification Using Branch Convolu-tional Neural Network. Genes. 2021;12:1155. doi: 10.3390/genes12081155. [DOI] [PMC free article] [PubMed] [Google Scholar]
- 36.Chen K., Wei Z., Zhang Q., Wu X., Rong R., Lu Z., Su J., de Magalhães J.P., Rigden D.J., Meng J. WHISTLE: A high-accuracy map of the human N-6-methyladenosine (m6A) epitranscriptome predicted using a machine learning approach. Nucleic Acids Res. 2019;47:e41. doi: 10.1093/nar/gkz074. [DOI] [PMC free article] [PubMed] [Google Scholar]
- 37.Georgi B., Schliep A. Context-specific independence mixture modeling for positional weight matrices. Bioinformatics. 2006;22:e166–e173. doi: 10.1093/bioinformatics/btl249. [DOI] [PubMed] [Google Scholar]
- 38.Xing Y., Zhao X., Cai L. Prediction of nucleosome occupancy in Saccharomyces cerevisiae using position-correlation scoring function. Genomics. 2011;98:359–366. doi: 10.1016/j.ygeno.2011.07.008. [DOI] [PubMed] [Google Scholar]
- 39.Rangannan V., Bansal M. Relative stability of DNA as a generic criterion for promoter prediction: Whole genome annotation of microbial genomes with varying nucleotide base composition. Mol. BioSyst. 2009;5:1758–1769. doi: 10.1039/b906535k. [DOI] [PubMed] [Google Scholar]
- 40.Breiman L. Random forest. Mach. Learn. 1999;45:1–35. [Google Scholar]
- 41.Saunders C., Stitson M.O., Weston J., Holloway R., Bottou L., Scholkopf B., Smola A. Support Vector Machine. Comput. Sci. 2002;1:1–28. [Google Scholar]
- 42.Dobson R.J., Munroe P.B., Caulfield M.J., Saqi M.A. Predicting deleterious nsSNPs: An analysis of sequence and structural attributes. BMC Bioinform. 2006;7:217. doi: 10.1186/1471-2105-7-217. [DOI] [PMC free article] [PubMed] [Google Scholar]
- 43.Kruitbosch H.T., Mzayek Y., Omlor S., Guerra P., Milias-Argeitis A. A convolutional neural network for segmentation of yeast cells without manual training annotations. Bioinformatics. 2021;38:1427–1433. doi: 10.1093/bioinformatics/btab835. [DOI] [PMC free article] [PubMed] [Google Scholar]
- 44.Sun S., Wu Q., Peng Z., Yang J. Enhanced prediction of RNA solvent accessibility with long short-term memory neural networks and improved sequence profiles. Bioinformatics. 2018;35:1686–1691. doi: 10.1093/bioinformatics/bty876. [DOI] [PubMed] [Google Scholar]
- 45.Di Lena P., Nagata K., Baldi P. Deep architectures for protein contact map prediction. Bioinformatics. 2012;28:2449–2457. doi: 10.1093/bioinformatics/bts475. [DOI] [PMC free article] [PubMed] [Google Scholar]
- 46.Kuksa P.P., Min M.R., Dugar R., Gerstein M. High-order neural networks and kernel methods for peptide-MHC binding prediction. Bioinformatics. 2015;31:3600–3607. doi: 10.1093/bioinformatics/btv371. [DOI] [PubMed] [Google Scholar]
- 47.Angermueller C., Lee H., Reik W., Stegle O. DeepCpG: Accurate prediction of single-cell DNA methylation states using deep learning. Genome Biol. 2017;18:67. doi: 10.1186/s13059-017-1189-z. [DOI] [PMC free article] [PubMed] [Google Scholar]
- 48.Lei Y., Li S., Liu Z., Wan F., Tian T., Li S., Zhao D., Zeng J. A deep-learning framework for multi-level peptide–protein interaction prediction. Nat. Commun. 2021;12:5465. doi: 10.1038/s41467-021-25772-4. [DOI] [PMC free article] [PubMed] [Google Scholar]
- 49.Xie R., Li J., Wang J., Dai W., Leier A., Marquez-Lago T.T., Akutsu T., Lithgow T., Song J., Zhang Y. DeepVF: A deep learning-based hybrid framework for identifying virulence factors using the stacking strategy. Brief. Bioinform. 2021;22:bbaa125. doi: 10.1093/bib/bbaa125. [DOI] [PMC free article] [PubMed] [Google Scholar]
Associated Data
This section collects any data citations, data availability statements, or supplementary materials included in this article.
Supplementary Materials
Data Availability Statement
The training and independent testing used in this study can be downloaded from http://47.94.248.117/DLm6Am/download (accessed on 15 September 2022).