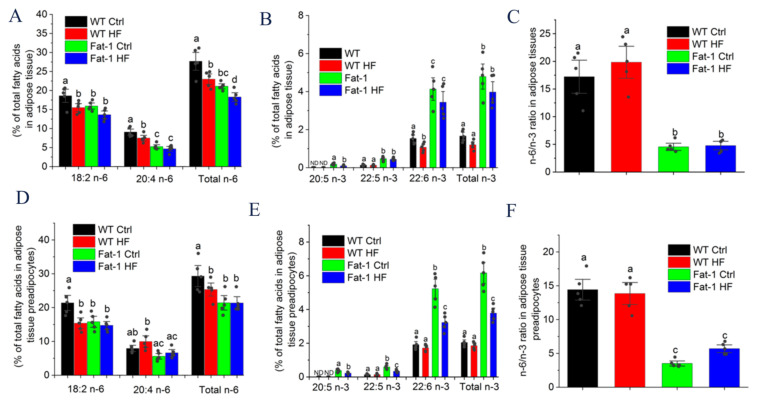
Figure 4.
Major n-6 and n-3 PUFAs and the ratio of n-6/n-3 PUFAs in the adipose tissue or adipose tissue preadipocytes of WT and fat-1 mice fed a HF or Ctrl diet: (A) Major n-6 PUFAs in adipose tissue; (B) Major n-3 PUFAs in adipose tissue; (C) The ratio of n-6/n-3 PUFA in adipose tissue; (D) Major n-6 PUFAs in adipose tissue preadipocytes; (E) Major n-3 PUFAs in adipose tissue preadipocytes; (F) The ratio of n-6/n-3 PUFA in adipose tissue preadipocytes. Results are presented as mean ± SEM. Means not sharing a common superscript letter are significantly different at p < 0.05.

