Abstract
Semiquantitative reverse transcription-PCR assays were developed to measure feline interleukin-2 (IL-2), IL-4, IL-5, IL-6, IL-10, and IL-12 (p35 & p40); gamma interferon (IFN-γ); and glyceraldehyde-3-phosphate dehydrogenase mRNA concentrations in biopsies of feline oral mucosa. Biopsies were collected from 30 cats with chronic gingivostomatitis (diseased) prior to each cat receiving one of four treatments. In 23 cases replicate biopsies were collected 3 months after treatment commenced. Biopsies were also analyzed from 11 cats without clinical disease (nondiseased). Expression of IL-2, IL-10, IL-12 (p35 and p40), and IFN-γ was detected in most nondiseased biopsies, while IL-6 was detected in a minority, and IL-4 and IL-5 were both undetectable. Compared to nondiseased cats, the diseased population showed a significant increase in the relative mRNA expression of IL-2, IL-4, IL-6, IL-10, IL-12 (p35 and p40), and IFN-γ. In contrast, IL-5 mRNA expression was unchanged and was only detected in one case. No significant relationship was demonstrable between the change in relative expression of specific cytokine mRNA and the change in clinical severity of the local mucosal lesions over the treatment period. The results demonstrate that the normal feline oral mucosa is biased towards a predominantly (Th) type 1 profile of cytokine expression and that during the development of lesions seen in feline chronic gingivostomatitis there is a shift in the cytokine profile from a type 1 to a mixed type 1 and type 2 response.
Feline chronic gingivostomatitis (FCGS) is a poorly defined syndrome of unknown etiology and is characterized by a focal or diffuse chronic inflammatory response involving the gingiva and oral mucosa, often extending to involve the fauces (13, 20, 52). The lesions typically comprise a submucosal infiltrate consisting predominantly of plasma cells interspersed with variable numbers of neutrophils, lymphocytes, and macrophages (19, 20, 39). Most cases also have elevated serum and salivary immunoglobulin concentrations (18, 51, 57). These features have led a number of authors to suggest that there may be an immunological basis for the condition, but evidence to support an underlying intrinsic immunological abnormality is lacking (20, 43, 52). Clinical studies have implicated the potential involvement of various viral agents (16, 22, 23, 48, 50) and gram-negative anaerobic bacteria (26, 27, 29, 45), including Prevotella and Porphyromonas species which have been associated with periodontal disease in humans and other mammals (35, 42). Nevertheless, it has been difficult to assess the role of these microbial agents within the pathogenesis of FCGS, first, because many of these pathogens can be isolated from cats that have no clinical signs of FCGS and, second, because attempts to produce an experimental model for this disease have been unsuccessful (23, 40). Historically, the intractable nature and poor understanding of the etiopathogenesis of FCGS has resulted in the widespread use of empirical symptomatic treatment regimes, but the clinical response is often unsatisfactory. Consequently, further characterization of the disease etiopathogenesis and host response is necessary to help facilitate the development of more effective medical treatments.
In recent years it has become apparent that the immune response is regulated by a complex cytokine network (32, 33, 41). Furthermore, various diseases, including oral diseases, have been correlated with functional changes involving one or more cytokines. This understanding has raised the potential for the development of new therapeutic strategies aimed at manipulating the expression or activity of specific cytokines in vivo. Previous reports have predominantly documented cytokine profiles observed during chronic oral disease in humans (11, 38, 49). The present study reports the changes found in cytokine gene expression within the oral mucosa of cats with chronic gingivostomatitis compared to nondiseased cats.
MATERIALS AND METHODS
Animals.
Samples were collected from 30 cats referred to the University of Bristol School of Veterinary Science Feline Centre for clinical investigation of chronic gingivostomatitis. Additional samples were collected immediately after euthanasia from 15 cats with no history of chronic gingivostomatitis.
Clinical grading and sample collection.
The fauces of each cat were graded according to the clinical severity of the local lesions as follows: 0, no inflammation; 1, slight inflammation; 2, moderate inflammation; and 3, severe inflammation. An excisional biopsy of the fauces was taken from each cat under general anesthesia from the most severely affected site. The biopsy was immediately snap-frozen in liquid nitrogen prior to being stored at −70°C.
Disease treatment.
Wherever possible, all existing treatment was withdrawn for a minimum of 2 to 6 weeks prior to referral. Initially, all cats received a dental scale and polish and were given approximately 12 mg of metronidazole and 23 mg of spiramycin (Stomorgyl; Merial) per kg once daily for 7 to 10 days postoperatively. In some cases dental extractions were also performed at this time. Cases were randomly allocated to one of four long-term treatment groups as follows: (i) use of oral hygiene products containing chlorhexidine and glucose-oxidase/lactoperoxidase active ingredients (CHX Oral Cleaning Solution, CHX-Guard LA Gel, CET Dentifrice; St. Jon Veterinary Prescription), (ii) 1 mg of sodium aurothiomalate per kg once weekly (Myocrisin; Rhône-Poulenc Rorer), (iii) 1 mg of methylprednisolone per kg daily for 6 weeks and then 0.5 mg/kg daily (Medrone-V; Upjohn), and (iv) approximately 12 mg of metronidazole and 23 mg of spiramycin (Stomorgyl) per kg once daily for 1 week every alternate week.
Feline T-cell line.
FL-4 T-cells were kindly provided by Janet Yamamoto (University of California).
DNA extraction.
Genomic DNA was extracted from FL-4 T-cells by using the QIAamp tissue kit (Qiagen) according to the manufacturer’s instructions.
RNA isolation and cDNA preparation.
RNA was isolated by using the SV Total RNA Isolation System (Promega) according to the manufacturer’s instructions, except that tissue sample RNA was eluted into 35 μl of RNase-free water passed through the column three times. Tissue homogenization was done with a motor-driven (maximum, 400 rpm) 1-ml-capacity DUALL glass tissue grinder and pestle (Kimble Kontes). All glassware was baked at 160 to 180°C for a minimum of 3 h prior to use. Eluted RNA was stored at −70°C. Due to the small amount of biopsy tissue available, the sample RNA eluate concentrations were too low to be measured by spectrophotometry. Prior to cDNA synthesis, 1 μl of RNA from each sample was subjected to PCR analysis (see below) for glyceraldehyde-3-phosphate dehydrogenase (G3PDH) in order to check for genomic DNA contamination. RNA extracts from samples demonstrating a PCR product for G3PDH were considered to have genomic contamination and were reextracted and rechecked as described above. First-strand cDNA synthesis was performed by using the Superscript preamplification system (Life Technologies) according to the manufacturer’s instructions with 11 μl of the eluted RNA per reaction.
PCR.
PCR primer pairs (Table 1) were designed by using MacVector version 6 (Oxford Molecular). Interleukin-2 (IL-2), IL-4, IL-6, and IL-10 and gamma interferon (IFN-γ) primers were designed by using available feline-specific sequences (GenBank). IL-5 primers were derived from consensus sequences. IL-12 p35 and IL-12 p40 primer sequences were kindly provided by Karen Bush (University of South Florida College of Medicine). G3PDH primer sequences were as previously published (16). Optimization of each PCR was performed by using cDNA derived from FL-4 cells. Gene-specific cDNA amplification was performed by using Taq PCR Master Mix (Qiagen) with either 2 μl of cDNA sample solution, 10.5 μl of standard cDNA solution, or 1 μl of RNA sample solution along with 0.33 μM final concentrations of each primer, in a final volume of 25 μl. The PCR was performed in a Hybaid Touchdown thermal cycler. After an initial incubation at 94°C for 90 s, 35 or 40 cycles were performed of denaturation at 94°C for 45 s, annealing at 57°C (IL-2, IL-4, IL-5, IL-6, IL-10, IL-12 p35, and IL-12 p40) or 60°C (IFN-γ and G3PDH) for 45 s, and then extension at 72°C for 45 s; a final 72°C extension was provided for 3 min. Then, 15 μl of reaction product was visualized on a 1% agarose gel containing ethidium bromide (∼1 μg/ml) with the GDS8500 Gel Documentation and Analysis System (UVP). Nondiseased and diseased samples were often analyzed concurrently. Due to the small amount of tissue available, most determinations were performed only once.
TABLE 1.
Feline cytokine-specific primer pair sequences
| Target gene | Primer sequence, 5′ → 3′ | Product size (bp) |
|---|---|---|
| G3PDH | CACGGCAAATTCCACGGCAC | 400 |
| TTTTGGGTGGCGGTGATGGC | ||
| IL-2 | GCAATTACTGCTGGATTTACGGTTGC | 358 |
| AGTCAGCGTTGAGAAGATGCTTTG | ||
| IL-4 | CATTTACCAGCACCTTCGTCCACG | 334 |
| TGCATGATCGCTTTTAGCCTTTCC | ||
| IL-5 | GCTTCTGCATTTGAGTTTGC | 384 |
| ATCCACTCGGTGTTCATTACAC | ||
| IL-6 | GACCTGCCTGACAAGAATCACTACTGG | 352 |
| CGTGAACTACAGCAATCTTAGATGCCC | ||
| IL-10 | ACAACTGCACCCACTTCTCAGTCAGC | 335 |
| CACCACCTTGCTCTTGTTTTCACAGG | ||
| IL-12 p35 | CCTCCTGGACCACCTCAGTTTG | 372 |
| GAACTCCACCTGGTACATCTTCAAGTC | ||
| IL-12 p40 | TCAAAGAGTTTGGAGATGCTGGCC | 464 |
| TGATGATGTCCCTGATGAAGAAGC | ||
| IFN-γ | TAGCAGATGGTGGGTCGCTTTTCG | 346 |
| AACAGATTCTGGCTCCTTTTCCGC |
Monitoring for cross-contamination.
Negative control samples consisting of RNase- and DNase-free purified water (Sigma) were periodically run through the RNA isolation and cDNA synthesis procedures and then subjected to PCR analysis for each target sequence. In addition, each PCR included a negative control reaction-containing purified water (Sigma) in place of cDNA.
cDNA purification and sequencing.
PCR mixture products obtained by using cDNA derived from FL-4 cells as a template were run on a gel as described above, and single-band products were purified by using the Hybaid Recovery DNA Purification Kit (Hybaid) according to the manufacturer’s instructions, with a final elution volume of 25 μl. The eluate DNA concentration was measured by spectrophotometry at 260 nm and used for automated fluorescence DNA sequencing (ABI prism, model version 2.1.1).
Quantification of single-band PCR products.
Quantification of single-band PCR products was performed by three-dimensional volume calculations of the digitized gel image prepared by using GelWorks 1D Advanced software (UVP) and expressed as the integrated optical density. The relative concentration of gene-specific cDNA template in samples was estimated from coamplified standard curves generated by using two- or fourfold serial dilutions of the appropriate purified reaction product as the PCR starting template. Each undiluted cytokine standard solution was allocated an arbitrary concentration of 106 U per 10.5 μl. Curve fitting was performed by using Axum version 5.0 (MathSoft). Relative sample concentrations were calculated from the standard curve equation by using Excel version 5.0 (Microsoft). The final results for each cytokine were then expressed relative to the sample G3PDH concentration.
Statistics.
Statistical analysis was performed by using Minitab version 12 (Minitab, Inc.) and GraphPad Prism version 2.0 (GraphPad Software, Inc.). Comparisons between groups were performed by using the Kruskal-Wallis test, the Mann-Whitney test, or Fisher’s exact test, as appropriate. Results were considered statistically significant when P was <0.05.
Accession numbers.
The GenBank accession numbers were as follows: AF054608 (G3PDH), AF054601 (IL-2), AF054602 (IL-4), AF051372 (IL-5), AF054603 (IL-6), AF054604 (IL-10), AF054605 (IL-12 p35), AF054607 (IL-12-p40), and AF054606 (IFN-γ).
RESULTS
Confirmation of PCR product specificity.
Each primer pair was shown to produce a prominent PCR product of the predicted size from cDNA template. Purification and sequencing (see above) of each product confirmed the reaction specificity for the intended target cDNA sequence. When genomic DNA was used in place of cDNA, only the G3PDH primer pair produced a product of equivalent size (data not shown).
Assay reliability and precision.
In order to estimate the reliability and precision of the assay, a homogenate of feline tonsil was divided into four unequal aliquots, and the G3PDH and IFN-γ concentrations of each aliquot were determined in triplicate (Fig. 1 and Table 2). The IFN-γ concentration in aliquot 1 was below the minimum level of detection (Fig. 1B); however, this finding was consistent with the comparatively low G3PDH concentration recorded for this aliquot. Overall, the results showed relatively good repeatability, with mean coefficients of variation of <20% (Table 2). The use of ratios suffers from the inherent problem of the multiplication of standard errors, which can create a substantial increase in spread in individual data values. The maximum and minimum values of each triplicate were used to provide an estimate of the potential range of the IFN-γ/G3PDH ratio for each aliquot (Table 2). These results suggested that there may be up to a 2.5-fold spread (mid-value of ±43%) in the value of a single datum point.
FIG. 1.
PCR products for G3PDH (400 bp) and IFN-γ (342 bp). Reaction mixes (25 μl) containing 2 μl cDNA sample or 10.5 μl of G3PDH (A) or IFN-γ (B) standard cDNA solution were amplified simultaneously for 35 cycles as described in the text. Then, 15 μl of each reaction product was separated by electrophoresis in a 1% agarose gel containing ∼1 μg of ethidium bromide per ml. Lanes 1, 14, 15, and 28 (a and b), 250-bp ladder molecular weight marker (MW); lanes 2 to 13: G3PDH (A) and IFN-γ (B) PCR products from four aliquots (1 to 4) of a feline tonsil homogenate, each performed in triplicate; lanes 16 to 24, G3PDH (A) and IFN-γ (B) PCR products from sequential 1-in-4 dilutions of the G3PDH or IFN-γ standard solution (106 U/10.5 μl); lane 26 (A and B), negative control (Neg) containing purified water in place of cDNA template solution; lanes 16 and 27 (A and B), empty.
TABLE 2.
Summary results of IFN-γ and G3PDH cDNA concentrations derived from the amplified PCR products shown in Fig. 1
| Aliquot | cDNA concn (103
U/sample)a
|
IFN-γ/G3PDH ratio (rangeb [10−3]) | |||
|---|---|---|---|---|---|
| IFN-γ | COV (%) | G3PDH | COV (%) | ||
| 1 | ND | 2.9 ± 1.4 | 47.4 | ||
| 2 | 2.0 ± 0.4 | 21.4 | 217.2 ± 6.1 | 2.8 | 6.9–11.2 |
| 3 | 2.0 ± 0.3 | 17.3 | 291.0 ± 64.3 | 22.1 | 4.8–10.7 |
| 4 | 0.6 ± 0.1 | 13.0 | 113.7 ± 3.6 | 3.2 | 4.5–6.0 |
| Mean | 17.2 | 18.9 | |||
Values are means ± the standard deviations (from triplicate determinations) from four unequal aliquots of a single feline tonsil homogenate (see the text for details). COV, coefficient of variation; ND, not detectable.
Values were derived by using maximum and minimum values from each triplicate.
Cytokine gene expression in nondiseased cats.
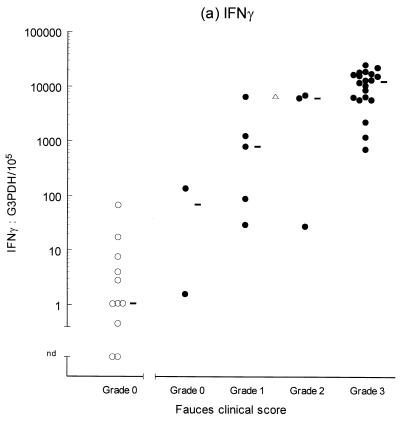
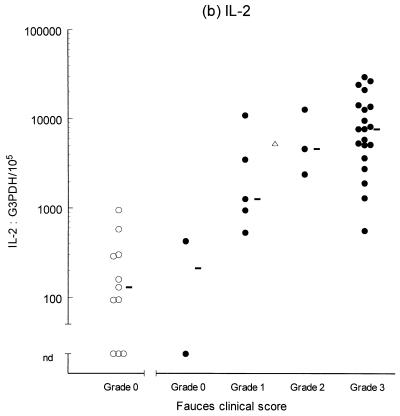
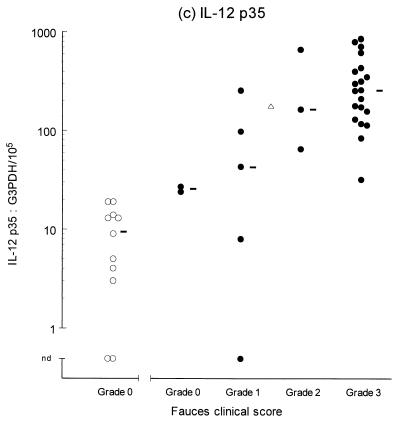
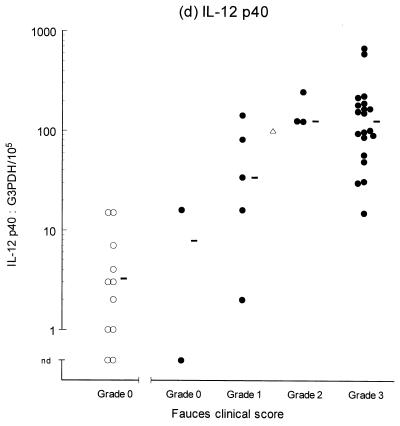
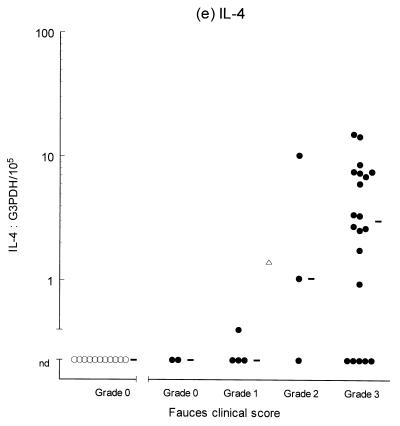
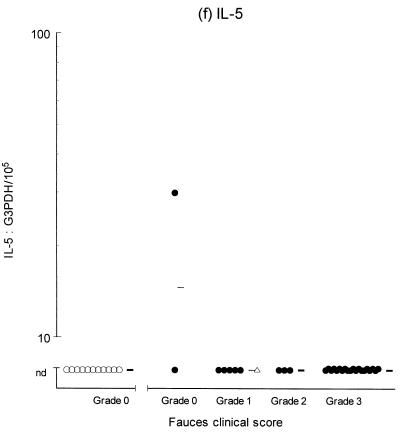
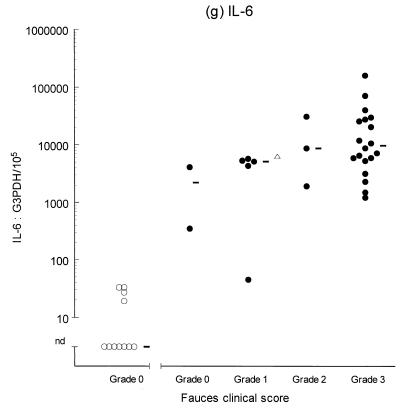
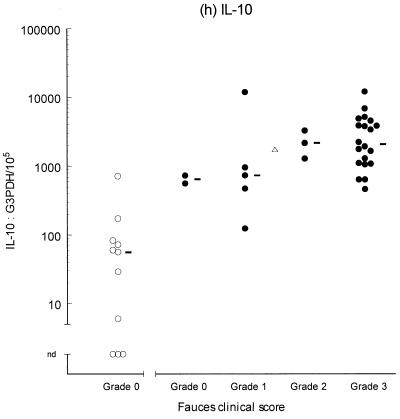
Variable levels of cytokine mRNA expression were detected in faucal tissue from nondiseased cats (Fig. 2). Problems were encountered during RNA extraction from samples from four cats owing to clogging of the extraction column. This complication significantly decreased the RNA yield and/or quality from the affected samples, resulting in up to a 2,000-fold reduction in detectable G3PDH mRNA per milligram of tissue compared to the nonclogged samples (P = 0.004, data not shown). Consequently, to prevent any bias resulting from processing differences, the results from the clogged samples were excluded from further analysis. Figure 2 demonstrates that IFN-γ, IL-2, IL-12 (p35 and p40), and IL-10 were detected in the majority of nondiseased faucal-tissue samples. In contrast, IL-6 was found in only a small proportion of the samples, while neither IL-4 or IL-5 was detected in any samples from nondiseased cats.
FIG. 2.
Clinical score and cytokine/G3PDH mRNA expression ratios in faucal biopsies from nondiseased (○) and diseased (●) cats. The biopsies from diseased cats were taken after the withdrawal of previous treatment for a minimum time period of 2 to 6 weeks and immediately prior to their entry into the treatment trial (see the text for details). None of the nondiseased cats were receiving medication prior to biopsy collection. Panels: a, IFN-γ; b, IL-2; c, IL-12 p35; d, IL-12 p40; e, IL-4; f, IL-5; g, IL-6; h, IL-10. The median value of each clinically graded group is represented by an adjacent bar (–). The median value of the entire diseased population is represented by a triangle (▵).
Cytokine expression in diseased cats (pretreatment).
IL-2, IL-6, IL-10, IL-12 (p35 and p40), and IFN-γ were detected in virtually all of the diseased samples, while IL-4 was identified in 18 of 30 samples and IL-5 was only detected in 1 sample (Fig. 2). Comparison of the diseased and nondiseased populations revealed no difference in the relative IL-5 mRNA expression between the two populations (Table 3). In contrast, the relative levels of IL-2, IL-4, IL-6, IL-10, IL-12 (p35 and p40), and IFN-γ mRNA expression were all significantly higher in the diseased population (Table 3).
TABLE 3.
Statistical analysis of the results shown in Fig. 2
| Cytokine | P value (nondiseased vs. diseased) |
|---|---|
| IL-2 | <0.001 |
| IL-4 | <0.001* |
| IL-5 | 0.545* |
| IL-6 | <0.001 |
| IL-10 | <0.001 |
| IL-12 p35 | <0.001 |
| IL-12 p40 | <0.001 |
| IFN-γ | <0.001 |
Comparisons of cytokine/G3PDH ratios as determined by the Mann-Whitney or Kruskall-Wallis test. (An asterisk indicates that the ratios were determined by the Kruskall-Wallis test.)
Cytokine expression in diseased cats after 3 months of treatment.
In 23 clinical cases, followup biopsies were collected from the same site as the pretreatment biopsy 3 months after the commencement of treatment. During this period the fauces clinical score in these patients was recorded as unaltered in 13 cases, reduced by 1 grade in 8 cases, and reduced by 2 grades in 2 cases. The relative mRNA expression of IL-2, IL-4, IL-5, IL-6, IL-10, IL-12 (p35 and p40), and IFN-γ was determined and compared to the pretreatment samples (Table 4). When a specific cytokine mRNA was not detectable in either the pretreatment or followup biopsy, the change in relative cytokine mRNA expression was classified as not determinable (Table 4). No significant differences were found between cats that exhibited a reduction in their fauces clinical score and those that remained unchanged (Table 4). Statistical analysis of the changes in cytokine mRNA expression between treatment groups were not reported because of the small group sizes. Inspection of the results shown in Table 4 suggests that the responses in each treatment group were similar.
TABLE 4.
Summary of comparative changes in the relative levels of cytokine mRNA expression in faucal biopsies from cats with FCGS after 3 months of treatment grouped by change in fauces clinical score and treatment received
| Groupa | No. of cats/group | Comparative changes in relative levels of
cytokine mRNA expressionb
|
||||||||||||||||||||
|---|---|---|---|---|---|---|---|---|---|---|---|---|---|---|---|---|---|---|---|---|---|---|
| IL-2
|
IL-4
|
IL-6
|
IL-10
|
IL-12
p35
|
IL-12 p40
|
IFN-γ
|
||||||||||||||||
| ↑ | ↓ | ND | ↑ | ↓ | ND | ↑ | ↓ | ND | ↑ | ↓ | ND | ↑ | ↓ | ND | ↑ | ↓ | ND | ↑ | ↓ | ND | ||
| Change in fauces clinical score | ||||||||||||||||||||||
| No change | 14 | 4 | 7 | 3 | 2 | 3 | 9 | 3 | 9 | 2 | 5 | 6 | 3 | 4 | 5 | 5 | 7 | 3 | 4 | 7 | 5 | 2 |
| Reduced | 9 | 5 | 3 | 1 | 1 | 0 | 8 | 1 | 7 | 1 | 2 | 6 | 1 | 2 | 5 | 2 | 4 | 4 | 1 | 2 | 6 | 1 |
| P valuec | 0.37 | NA | 0.62 | 0.63 | 0.63 | 0.63 | 0.20 | |||||||||||||||
| Treatment | ||||||||||||||||||||||
| OH | 6 | 3 | 2 | 1 | 1 | 1 | 4 | 1 | 4 | 1 | 1 | 4 | 1 | 2 | 2 | 2 | 3 | 1 | 2 | 3 | 2 | 1 |
| Myo | 4 | 3 | 0 | 1 | 0 | 0 | 4 | 1 | 2 | 1 | 1 | 2 | 1 | 2 | 1 | 1 | 2 | 1 | 1 | 2 | 1 | 1 |
| MePred | 7 | 3 | 3 | 1 | 0 | 2 | 5 | 1 | 5 | 1 | 3 | 2 | 2 | 0 | 4 | 3 | 3 | 3 | 1 | 2 | 4 | 1 |
| Met/Spir | 6 | 0 | 5 | 1 | 2 | 0 | 4 | 1 | 5 | 0 | 2 | 4 | 0 | 2 | 3 | 1 | 3 | 2 | 1 | 2 | 4 | 0 |
OH, oral hygiene; Myo, myocrisin; MePred, methylprednisolone; Met/Spir, metronidazole and spiramycin.
↑, Increase in relative cytokine mRNA expression after treatment; ↓, decrease in relative cytokine expression after treatment; ND, change in relative cytokine mRNA was not determinable.
Fisher’s exact test (“ND” cases were excluded); NA, not applied.
DISCUSSION
Reverse transcription-PCR (RT-PCR) provides a sensitive technique for both the detection and (semi-)quantification of specific mRNA transcripts. A number of approaches have been used for PCR quantification, all of which have inherent advantages and disadvantages (6, 58). The method described here was generally found to be reliable and permitted quantification of samples over a 2- to 3-log concentration range. Normalization was performed against G3PDH expression, a commonly used “housekeeper” gene, which acts to control for variations in sample size, RNA extraction efficiency, and RT efficiency. A consequence of this commonly performed procedure, which was illustrated in this study, is the loss of precision caused by the accrual of standard errors. Nevertheless, although this semiquantitative approach does not yield precise quantification of transcript numbers, the technique can be utilized to enable the detection of substantial differences in the relative levels of mRNA expression between samples of similar tissue origin (6), as was the case in this study.
Preliminary studies found that both cDNA and genomic DNA produced PCR products of identical sizes for G3PDH. This observation was considered to be due to the existence of processed G3PDH pseudogenes within the feline genome, as have been described in a number of other species (5, 12). Thus, in order to prevent the generation of false-positive G3PDH results, it was vital to ensure that the eluted RNA was free from detectable genomic contamination prior to RT. This was achieved by subjecting an appropriate volume of RNA eluate to PCR analysis for G3PDH, whereby a positive result was indicative of genomic contamination. Overall, genomic DNA was undetectable in the vast majority of sample eluates after a single RNA extraction procedure. The remaining samples were subsequently shown to be free from detectable genomic DNA after RNA reextraction.
The first stage of this study investigated the cytokine gene expression profile of noninflamed feline oral mucosal tissue. The majority of cats analyzed were found to express IL-2, IL-10, IL-12 (p35 and p40), and IFN-γ within the oral mucosa. By contrast, IL-6 was found in a minority of samples, and IL-4 and IL-5 were both undetectable. The division of cytokines into those involved in (Th) type 1 and type 2 immune responses is based largely upon murine models (32). Further studies have suggested that this polarized classification may be too strict and that most responses display a degree of heterogeneity (25), as appeared to be the case in this study. Moreover, substantial species differences may occur (7). In a recent study by Pedersen and colleagues (36), the authors were unable to demonstrate cytokine profiles in cats that conformed to the type 1 and type 2 responses seen in mice. This raises questions as to the validity of trying to fit the responses seen in this study into the classical murine model. Nevertheless, our findings indicate that the noninflamed feline oral mucosa is an active immunological site and show that the cell population is predominantly, but not exclusively, biased towards a type 1 profile of gene expression. Studies of early lymphoid responses to both bacterial and viral pathogens have shown cytokine patterns that are similarly dominated by IFN-γ, IL-6, IL-10, and IL-12 expression (15). Since the feline oral cavity harbors a large number and array of commensal bacteria (29) and since the oral mucosa is subjected to a daily barrage of minor insults during the normal course of eating, the pattern of cytokine exposure seen in the nondiseased mucosa may simply reflect an ongoing immune response to recurrent minor bacterial invasions.
The second part of this study investigated cytokine gene expression within the mucosal lesions of cats with chronic gingivostomatitis. Biopsies from most cases were found to express IL-2, IL-10, IL-12 (p35 and p40), IFN-γ, and IL-6. IL-4 was expressed in biopsies from two-thirds of affected cats, and these animals tended to have lesions of greater clinical severity (grades 2 to 3). By contrast, IL-5 was only detected in one case, which had a clinical score of grade 0. Overall, the diseased population tended to demonstrate generalized and progressive upregulation of cytokine expression as the lesion severity increased. The similarity of the cytokine profile in lesions from different cats supports the view that a similar pathogenesis underlies all cases. The results also suggest that IL-6 expression is induced early in the pathogenesis of the disease, whereas expression of IL-4 is a late event and is mainly confined to established lesions. This would imply that the underlying immunological bias switches from a predominantly classical type 1 to a mixed type 1-type 2 response as the lesion progresses. Studies of chronic inflammatory periodontal disease in humans have demonstrated cytokine profiles similar to those seen in this study, although some results are conflicting (10, 11, 24, 38, 49, 54). This may suggest that there are common factors in the pathogenesis of FCGS and human periodontal disease. Alternatively, it may simply be that a conserved array of cytokines are expressed during chronic inflammation of the oral mucosa arising from various etiologies in different species.
The heterogeneous and complex cytokine response seen in this study makes interpretation of the results difficult. Moreover, the levels of gene expression measured may not necessarily correlate with the levels of cytokine transcription and secretion (37). The immunological and histological features of FCGS (plasma cell-dominated infiltrate and hypergammaglobulinemia) would tend to suggest that a type 2 cytokine response is dominant. However, other cells are also normally present in FCGS lesions, including macrophages, neutrophils, lymphocytes, and fibroblasts (19, 20, 39); thus, a mixed cytokine response is perhaps not unexpected. Early IL-6, IL-10, and also IL-2 expression would facilitate the differentiation of B cells and promote immunoglobulin secretion (24, 31, 34). Upregulation of IL-4 would further enhance this effect and promote the differentiation of further Th2-type cells (8, 28). In this context it is surprising that IL-5 expression was not detected in the oral mucosa of either diseased or nondiseased cats. IL-5 is produced by T cells, mast cells, and eosinophils and acts to stimulate B-cell development and enhance immunoglobulin A production at mucosal sites (2, 47). However, this result is consistent with some studies where IL-5 expression was not detected in human oral lesions (11). The concurrent upregulation of IFN-γ and IL-12 may be expected to downregulate type 2 responses, although it has been shown that both of these cytokines can either enhance or inhibit humoral immunity, depending upon the environmental circumstances (14, 46).
It is interesting to note that hypergammaglobulinemia is a feature of diseases in which overproduction of IL-6 occurs (21). The upregulation of IL-6 in FCGS may suggest a mechanism for the systemic hypergammaglobulinemia seen in these cases (51, 57). Measurement of systemic IL-6 levels would be required to support this hypothesis.
Finally, the comparative effects of four treatment regimens with differing immunomodulatory potentials were studied in cats with FCGS. The ability of methylprednisolone to regulate the production of a wide range of cytokines in a variety of cell phenotypes is well documented (2, 44), although it should be noted that in may of these reports the dose administered was substantially greater than that utilized in this study (1, 30, 56). Sodium aurothiomalate and, to a lesser extent, spiramycin and metronidazole have also been reported to possess immunomodulatory activity, but the mechanisms underlying this effect are poorly understood (3, 9, 55). By contrast, immunoregulatory activity has not been described for chlorhexidine or glucose-oxidase/lactoperoxidase, the active ingredients of the oral hygiene products. After 3 months of treatment, none of the agents utilized in this study were able to resolve the underlying pathology present in local FCGS lesions at either a clinical or a molecular level. Only minor differences were noted in the changes in relative cytokine mRNA expression between groups, although the small group sizes precluded drawing any firm conclusions. Moreover, the methods applied in this study may not have been sensitive enough to discriminate subtle but consistent changes in the levels of cytokine expression. Furthermore, immunomodulatory effects can be mediated via nontranscriptional pathways such as the regulation of cytokine translation and secretion, or by the regulation of noncytokine elements such as receptor expression, which would not be detected in this study (53). Within each treatment group the individual clinical responses were variable, and when the results from all of the treatment groups were pooled, no significant relationship was demonstrable between the clinical response and changes in the relative expression of any specific cytokine mRNA. Altogether, the results suggest that successful treatment of this disease is likely to require the use of therapeutic agents which have greater potency in their ability to alter cytokine expression. In particular, drugs which generally downregulate cytokines and shift the balance of cytokine expression towards a type 1 response may be of benefit. Investigations into the role of other regulatory cytokines, such as transforming growth factor β, may also be of merit.
In conclusion, this study has demonstrated that the cytokine profile of the normal feline oral mucosa is dominated by IFN-γ, IL-2, IL-12, and IL-10. In cats with FCGS there is upregulation of these cytokines in addition to the expression of IL-6 and IL-4 within the oral lesions. After treatment with conventional medical therapies, no significant differences in the levels of cytokine expression were demonstrated, a result which correlated with the poor response to treatment. Consequently, this study has highlighted the need for novel approaches to therapy that can more effectively and precisely modulate cytokine expression in the feline oral mucosa.
ACKNOWLEDGMENTS
Many thanks are due to all of the patients, owners, and referring veterinary surgeons who participated in this study.
Ross Harley was sponsored by the Cats’ Protection League. Additional support was also kindly provided by Merial and St. Jon Veterinary Prescription.
REFERENCES
- 1.Almawi W Y, Lipman M L, Stevens A C, Zanker B, Hadro E T, Strom T B. Abrogation of glucocorticosteroid-mediated inhibition of T-cell proliferation by the synergistic action of IL-1, IL-6 and IFN-γ. J Immunol. 1991;146:3523–3527. [PubMed] [Google Scholar]
- 2.Auphan N, DiDonato J A, Rosette C, Helmberg A, Karin M. Immunosuppression by glococorticoids: inhibition of NF-κB activity through induction of IκB synthesis. Science. 1995;270:286–290. doi: 10.1126/science.270.5234.286. [DOI] [PubMed] [Google Scholar]
- 3.Bailly S, Pocidalo J J, Fay M, Gougerotpocidalo M A. Differential modulation of cytokine production by macrolides—interleukin-6 production is increased by spiramycin and erythromycin. Antimicrob Agents Chemother. 1991;35:2016–2019. doi: 10.1128/aac.35.10.2016. [DOI] [PMC free article] [PubMed] [Google Scholar]
- 4.Bao S, Beagley K W, Murray A M, Caristo V, Matthaei K I, Young I G, Husband A J. Intestinal IgA plasma cells of the B1 lineage are IL-5 dependent. Immunology. 1998;94:181–188. doi: 10.1046/j.1365-2567.1998.00512.x. [DOI] [PMC free article] [PubMed] [Google Scholar]
- 5.Benham F J, Hodgkinson S, Davies K E. A glyceraldehyde-3-phosphate dehydrogenase pseudogene on the short arm of the human X-chromosome defines a multigene family. EMBO J. 1984;3:2635–2640. doi: 10.1002/j.1460-2075.1984.tb02186.x. [DOI] [PMC free article] [PubMed] [Google Scholar]
- 6.Dallman M J, Porter A C G. Semi-quantitative PCR for analysis of gene expression. In: McPherson M J, Quirke P, Taylor G R, editors. PCR 1: a practical approach. Oxford, England: Oxford University Press; 1991. pp. 215–24. [Google Scholar]
- 7.Davis W C, Hamilton M J. Comparison of the unique characteristics of the immune system in different species of mammals. Vet Immunol Immunopathol. 1998;63:7–13. doi: 10.1016/s0165-2427(98)00076-2. [DOI] [PubMed] [Google Scholar]
- 8.de Vries J E, Punnonen J. Interleukin-4 and interleukin-13. In: Snapper C M, editor. Cytokine regulation of humoral immunity: basic and clinical aspects. Chichester, England: John Wiley & Sons, Ltd.; 1996. pp. 195–216. [Google Scholar]
- 9.Elizondo G, Ostrosky-Wegman P. The effects of metronidazole and its metabolites on histamine immunosuppression activity. Life Sci. 1996;59:265–297. doi: 10.1016/0024-3205(96)00297-4. [DOI] [PubMed] [Google Scholar]
- 10.Fujihashi K, Beagley K W, Kono Y, Aicher W K, Yamamoto M, DiFabio S, Xu-Amanto J, McGhee J R, Kiyono H. Gingival mononuclear cells from chronic inflammatory periodontal tissues produce interleukin (IL)-5 and IL-6 but not IL-2 and IL-4. Am J Pathol. 1993;142:1239–1250. [PMC free article] [PubMed] [Google Scholar]
- 11.Fujihashi K, Yamamoto M, Hiroi T, Bamberg T V, McGhee J R, Kiyono H. Selected Th1 and Th2 cytokine mRNA expression by CD4+ T cells isolated from inflamed human gingival tissues. Clin Exp Immunol. 1996;103:422–428. doi: 10.1111/j.1365-2249.1996.tb08297.x. [DOI] [PMC free article] [PubMed] [Google Scholar]
- 12.Galland F, Stefanova M, Pirisi V, Birnbaum D. Characterisation of a murine glyceraldehyde-3-phosphate dehydrogenase pseudogene. Biochimie. 1990;72:759–762. doi: 10.1016/0300-9084(90)90161-9. [DOI] [PubMed] [Google Scholar]
- 13.Gaskell R M, Gruffydd-Jones T J. Intractable feline stomatitis. Vet Annu. 1977;17:195–199. [Google Scholar]
- 14.Gately M K, Renzetti L M, Magram J, Stern A S, Adorini L, Gubler U, Presky D H. Interleukin 12/interleukin-12-receptor system: role in normal and pathologic immune responses. Annu Rev Immunol. 1998;16:495–521. doi: 10.1146/annurev.immunol.16.1.495. [DOI] [PubMed] [Google Scholar]
- 15.Gause W C, Lu P. Cellular sources and regulation of cytokine production. In: Snapper C M, editor. Cytokine regulation of humoral immunity: basic and clinical aspects. Chichester, England: John Wiley & Sons, Ltd.; 1996. pp. 139–58. [Google Scholar]
- 16.Gruffydd-Jones T J. Gingivitis and stomatitis. In: August J R, editor. Consultations in feline internal medicine. Philadelphia, Pa: The W. B. Saunders Co.; 1991. pp. 397–402. [Google Scholar]
- 17.Gunn-Moore D G, Caney S M A, Gruffydd-Jones T J, Helps C R, Harbour D A. Antibody and cytokine responses in kittens during the development of feline infectious peritonitis. Vet Immunol Immunopathol. 1998;65:221–242. doi: 10.1016/S0165-2427(98)00156-1. [DOI] [PMC free article] [PubMed] [Google Scholar]
- 18.Harley R, Gruffydd-Jones T J, Day M J. Determination of salivary and serum immunoglobulin concentrations in the cat. Vet Immunol Immunopathol. 1998;65:99–112. doi: 10.1016/s0165-2427(98)00146-9. [DOI] [PubMed] [Google Scholar]
- 19.Hennet P. Gingivo-stomatites chroniques félines: étude rétrospective de 30 chats, une a deux années aprés traitement odontologique. Prat Med Chir Anim Comp. 1995;30:453–60. [Google Scholar]
- 20.Johnessee J S, Hurvitz A I. Feline plasma cell gingivitis-pharyngitis. J Am Anim Hosp Assoc. 1983;19:179–181. [Google Scholar]
- 21.Jourdan M, Bataille R, Seguin J, Zhang X G, Chaptal P A, Klein B. Constitutive production of interleukin-6 and immunologic features in cardiac myxomas. Arthritis Rheum. 1990;33:398–402. doi: 10.1002/art.1780330313. [DOI] [PubMed] [Google Scholar]
- 22.Knowles J O, Gaskell R M, Gaskell C J, Harvey C E, Lutz H. Prevalence of feline calicivirus, feline leukaemia virus and antibodies to FIV in cats with chronic stomatitis. Vet Rec. 1989;124:336–338. doi: 10.1136/vr.124.13.336. [DOI] [PubMed] [Google Scholar]
- 23.Knowles J O, McArdle F, Dawson S, Carter S D, Gaskell C J, Gaskell R M. Studies on the role of feline calicivirus in chronic stomatitis in cats. Vet Microbiol. 1991;27:205–219. doi: 10.1016/0378-1135(91)90148-9. [DOI] [PubMed] [Google Scholar]
- 24.Kono Y, Beagley K W, Fujihashi K, McGhee J R, Taga T, Hirano T, Kishimoto T, Kiyono H. Induction of activated B cells and IL-6-mediated polyclonal IgG and IgA synthesis in inflamed human gingiva. J Immunol. 1991;146:1812–1821. [PubMed] [Google Scholar]
- 25.London C A, Abbas A K, Kelso A. Helper T cell subsets: heterogeneity, functions and development. Vet Immunol Immunopathol. 1998;63:37–44. doi: 10.1016/s0165-2427(98)00080-4. [DOI] [PubMed] [Google Scholar]
- 26.Love D N, Johnson J L, Moore L V H. Bacteroides species from the oral cavity and oral associated diseases of cats. Vet Microbiol. 1989;19:275–281. doi: 10.1016/0378-1135(89)90073-4. [DOI] [PubMed] [Google Scholar]
- 27.Love D N, Vekselstein R, Collings S. The obligative and facultatively anaerobic bacterial flora of the normal feline gingival margin. Vet Microbiol. 1990;22:267–275. doi: 10.1016/0378-1135(90)90114-b. [DOI] [PubMed] [Google Scholar]
- 28.Maggi E, Parronchi P, Manetti R, Simonelli C, Piccinni M-P, Rugiu F S, De Carli M, Ricci M, Romagnani S. Reciprocal regulatory effects of IFN-γ and IL-4 on the in vitro development of human Th1 and Th2 clones. J Immunol. 1992;148:2142–2147. [PubMed] [Google Scholar]
- 29.Mallonee D H, Harvey C E, Venner M, Hammond B F. Bacteriology of periodontal disease in the cat. Arch Oral Biol. 1988;33:677–683. doi: 10.1016/0003-9969(88)90123-9. [DOI] [PubMed] [Google Scholar]
- 30.Marchant A, Amraoui Z, Gueydan C, Bruyns C, Le Moine O, Vandenbeele P, Fiers W, Buurman W A, Goldman M. Methylprednisolone differentially regulates IL-10 and tumour necrosis factor (TNF) production during murine endotoxaemia. Clin Exp Immunol. 1996;106:91–96. doi: 10.1046/j.1365-2249.1996.d01-799.x. [DOI] [PMC free article] [PubMed] [Google Scholar]
- 31.McIlraith M J, Lipsky P E. Interleukin 2. In: Snapper C M, editor. Cytokine regulation of humoral immunity: basic and clinical aspects. Chichester, England: John Wiley & Sons, Ltd.; 1996. pp. 159–94. [Google Scholar]
- 32.Mossman T R, Cherwinski M, Bond M W, Giedlin M A, Coffman R L. Two types of murine T cell clone. I. Definition according to profiles of lymphokine activities and secreted proteins. J Immunol. 1986;136:2348–2357. [PubMed] [Google Scholar]
- 33.Mossman T R, Coffman R L. TH1 and TH2 cells: different patterns of lymphokine expression lead to different functional properties. Annu Rev Immunol. 1989;7:145–173. doi: 10.1146/annurev.iy.07.040189.001045. [DOI] [PubMed] [Google Scholar]
- 34.Nagumo H, Agematsu K. Synergistic augmentative effect of interleukin-10 and CD27/CD70 interactions on B-cell immunoglobulin synthesis. Immunology. 1998;94:388–394. doi: 10.1046/j.1365-2567.1998.00521.x. [DOI] [PMC free article] [PubMed] [Google Scholar]
- 35.Newman M G, Socransky S S, Savitt E D, Propas D A, Crawford A. Studies of the microbiology of periodontosis. J Periodontol. 1976;47:373–379. doi: 10.1902/jop.1976.47.7.373. [DOI] [PubMed] [Google Scholar]
- 36.Pedersen N C, Dean G A, Bernales J, Sukura A, Higgins J. Listeria monocytogenes and Serratia marcescens infections as models for Th1/Th2 immunity in laboratory cats. Vet Immunol Immunopathol. 1998;63:83–103. doi: 10.1016/s0165-2427(98)00085-3. [DOI] [PubMed] [Google Scholar]
- 37.Pioli C, Pucci S, Barile S, Frasca D, Doria G. Role of mRNA stability in the different patterns of cytokine production by CD4+ cells from young and old mice. Immunology. 1998;94:380–387. doi: 10.1046/j.1365-2567.1998.00523.x. [DOI] [PMC free article] [PubMed] [Google Scholar]
- 38.Prabhu A, Michalowicz B S, Mathur A. Detection of local and systemic cytokines in adult periodontitis. J Periodontol. 1996;67:515–522. doi: 10.1902/jop.1996.67.5.515. [DOI] [PubMed] [Google Scholar]
- 39.Reindel J F, Trapp A L, Armstrong P J, Stickle R L. Recurrent plasmacytic stomatitis-pharyngitis in a cat with esophagitis, fibrosing gastritis and gastric nematodiasis. J Am Vet Med Assoc. 1987;190:65–67. [PubMed] [Google Scholar]
- 40.Reubel G H, Hoffman D E, Pederson N C. Acute and chronic faucitis of domestic cats: a feline calicivirus-induced disease. Vet Clin North Am Small Anim Pract. 1992;22:1347–1360. doi: 10.1016/s0195-5616(92)50131-0. [DOI] [PubMed] [Google Scholar]
- 41.Romagnani S. The Th1/Th2 paradigm. Immunol Today. 1997;18:263–266. doi: 10.1016/s0167-5699(97)80019-9. [DOI] [PubMed] [Google Scholar]
- 42.Sarkiala E, Asikainen S, Wolf J, Kanervo A, Happonen I, Jousimies-Somer H. Clinical radiological and bacteriological findings in canine periodontosis. J Small Anim Pract. 1993;34:265–270. [Google Scholar]
- 43.Sato R, Inanami O, Tanaka Y, Takase M, Niato Y. Oral administration of bovine lactoferrin for treatment of intractable stomatitis in feline immunodeficiency virus (FIV)-positive and FIV-negative cats. Am J Vet Res. 1996;10:1443–1446. [PubMed] [Google Scholar]
- 44.Scheinman R I, Cogswell P C, Lofquist A K, Baldwin A S., Jr Role of transcriptional activation of IκBα in mediation of immunosuppression by glucocorticoids. Science. 1995;270:283–286. doi: 10.1126/science.270.5234.283. [DOI] [PubMed] [Google Scholar]
- 45.Sims T J, Moncla B J, Page R C. Serum antibody responses to antigens of oral gram-negative bacteria by cats with plasma cell gingivitis-pharyngitis. J Dent Res. 1990;69:877–882. doi: 10.1177/00220345900690031001. [DOI] [PubMed] [Google Scholar]
- 46.Snapper C M. Interferon-gamma. In: Snapper C M, editor. Cytokine regulation of humoral immunity: basic and clinical aspects. Chichester, England: John Wiley & Sons, Ltd.; 1996. pp. 325–46. [Google Scholar]
- 47.Takatsu K. Interleukin-5. In: Snapper C M, editor. Cytokine regulation of humoral immunity: basic and clinical aspects. Chichester, England: John Wiley & Sons, Ltd.; 1996. pp. 27–250. [Google Scholar]
- 48.Thompson R R, Wilcox G E, Clark W T, Jansen K L. Association of calicivirus infection with chronic gingivitis and pharyngitis in cats. J Small Anim Pract. 1984;25:207–210. [Google Scholar]
- 49.Tokoro Y, Matsuki Y, Yamamoto T K, Suzuki T, Hara K. Relevance of local Th2-type cytokine mRNA expression in immunocompetent infiltrates in inflamed gingival tissue to periodontal diseases. Clin Exp Immunol. 1997;107:166–174. doi: 10.1046/j.1365-2249.1997.d01-880.x. [DOI] [PMC free article] [PubMed] [Google Scholar]
- 50.Waters L, Hopper C D, Gruffydd-Jones T J, Harbour D A. Chronic gingivitis in a colony of cats infected with feline immunodeficiency virus and feline calicvirus. Vet Rec. 1993;132:340–342. doi: 10.1136/vr.132.14.340. [DOI] [PubMed] [Google Scholar]
- 51.White S D, Rosychuk R A W, Janik T A, Denerolle P, Schultheiss P. Plasma cell stomatitis-pharyngitis in cats: 40 cases (1973–1991) J Am Vet Med Assoc. 1992;200:1377–1380. [PubMed] [Google Scholar]
- 52.Williams C A, Aller M S. Gingivitis/stomatitis in cats. Vet Clin North Am Small Anim Pract. 1992;22:1361–1383. doi: 10.1016/s0195-5616(92)50132-2. [DOI] [PubMed] [Google Scholar]
- 53.Wu C, Wang K, McDyer J F, Seder R A. Prostaglandin E2 and dexamethasone inhibit IL-12 receptor expression and IL-12 responsiveness. J Immunol. 1998;161:2723–2730. [PubMed] [Google Scholar]
- 54.Yamamoto M, Fujihashi K, Hiroi T, McGhee J R, Van Dyke T E, Kiyono H. Molecular and cellular mechanisms for periodontal disease: role of Th1 and Th2 type cytokines in induction of mucosal inflammation. J Periodontal Res. 1997;32:115–119. doi: 10.1111/j.1600-0765.1997.tb01391.x. [DOI] [PubMed] [Google Scholar]
- 55.Yanni, G., M. N. M. R. Farahat, R. N. Poston, and G. S. Panayi. 1994.
- 56.Youssef P P, Haynes D R, Triantafillou S, Parker A, Gamble J R, Roberts-Thomson P J, Ahern M J, Smith M D. Effects of pulse methylprednisolone on inflammatory mediators in peripheral blood, synovial fluid, and synovial membrane in rheumatoid arthritis. Arthritis Rheum. 1997;40:1400–1408. doi: 10.1002/art.1780400807. [DOI] [PubMed] [Google Scholar]
- 57.Zetner K, Kampfer P, Lutz H, Harvey C. Comparative immunological and virological studies of chronic oral diseases in cats. Wein Tieraerztl Monschr. 1989;76:303–308. [Google Scholar]
- 58.Zimmermann K, Mannhalter J W. Technical aspects of quantitative competitive PCR. BioTechniques. 1996;21:268–279. doi: 10.2144/96212rv01. [DOI] [PubMed] [Google Scholar]


