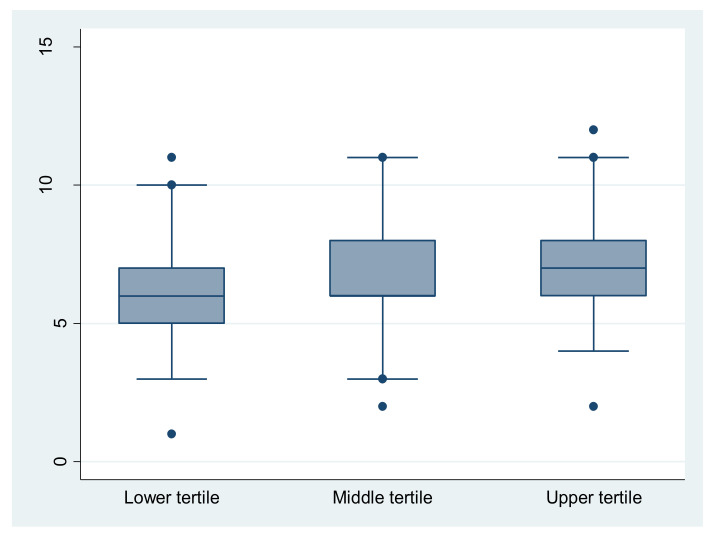
Figure 2.
Distribution of MEDAS score over household welfare proxy. Significant difference for the mean MEDAS score between the three economic classes (p < 0.001). A post hoc analysis showed that a significantly higher mean score is noticed for high economic level (upper tertile) compared to medium (p = 0.025) and low economic classes (p < 0.001).

