Abstract
In this article, we perform a case study of the impact of photobiomodulation (PBM) on brain power spectrum and connectivity in an elderly person with a Self Administered Gerocognitive Exam (SAGE) score indicating probable memory and thinking disorder. First, we designed and realized the prototype of a near-infrared (NIR) device for PBM. Analysing the alpha band of the power spectrum, we found a positive long-term effect in nine out of sixteen electrodes in the eyes-open condition (OE) and in twelve out of sixteen electrodes in the eyes-closed condition (CE), while in the theta band, a positive long-term effect was found in nine out of sixteen electrodes for OE and seven out of sixteen electrodes for CE. When considering the theta-alpha ratio (TAR), the positive long-term effect is found on thirteen of sixteen electrodes for OE and on fourteen of sixteen electrodes for CE. A connectivity analysis using the imaginary component of the complex Pearson correlation coefficient (imCPCC) was also performed, and a global efficiency measure based on connectivity matrices with thresholds was calculated. The global efficiency calculated for the long-term effect was higher than before stimulation by a factor of for the OE condition and by a factor of for the CE condition. This case study suggests that PBM could have positive effects on improving desired brain activity, measured as improvement in power spectrum and connectivity measures in theta and alpha bands, for elderly people with memory and thinking disorders.
Keywords: photobiomodulation, near-infrared stimulation, power spectrum analysis, brain connectivity analysis
1. Introduction
The human brain is a system of neurons () connected by a multitude of synaptic connections (). Today, research to understand the human brain complex is going in several directions and is conducted by scientists from different fields such as social sciences, biology, information technology, and image processing [1].
Brain damage and disease affect the development of various diseases in people of all ages. Degenerative diseases such as dementia and Parkinson’s disease, as well as strokes and headaches, are common neurological conditions in elderly patients [2]. In this article, we will focus on dementia.
1.1. Causes and Symptoms
Dementia refers to a wide range of medical conditions that typically affect elderly persons, including memory impairments and various other decreases of cognitive functioning. Those conditions are triggered by abnormal brain changes which are not a part of normal aging. The most common cause of dementia is Alzheimer’s disease, estimated to contribute by 60% to 80% to the total number of dementia cases [3]. Another type is vascular dementia which is usually connected to a stroke and issues with blood vessels in the brain. This type of dementia accounts for up to 10% of dementia cases. Lewy bodies dementia is the third type of dementia in order of occurrence amounting to an estimated of 5% to 10% of all dementia cases [4]. It is related to abnormal formations in the brain called Levy bodies whose main component is the alpha-synuclein protein. Some other types and causes of dementia are Parkinson’s disease dementia [5], Frontotemporal Dementia [6], Huntington’s Disease [7], and Creutzfeldt-Jakob Disease [8]. In case of mixed dementia there are multiple types of dementia present, such as a combination of Alzheimer’s disease and vascular dementia. Although most types of dementia are progressive and non-reversible there are some which are reversible such as dementia caused by vitamin deficiencies or thyroid problems. Dementia affects many aspects of a person’s life and the symptoms can be quite different, also depending on the type of dementia. Some of the symptoms are memory problems, mood and personality changes, trouble performing simple everyday tasks, losing things, poor planning, difficulty with speaking or understanding speech, problems thinking clearly and making decisions, difficulty with recognizing familiar sights and sounds, problems with walking and balance.
1.2. Diagnostics
Diagnostics of dementia are based on a set of cognitive tests combined with a physical exam, laboratory tests and taking a patient’s history regarding the onset of symptoms, other medical issues and medications being used. The cognitive tests assess various capabilities such as short-term and long-term memory, simple problem solving, attention, orientation in time, and language skills [9]. Additionally, brain scans such as Magnetic Resonance Imaging (MRI) and Computed tomography (CT) can be used to confirm a diagnosis of dementia.
Electroencephalography (EEG) is also a widely used method in diagnosing dementia [10]. It was shown that Alzheimer’s disease (AD) causes the power spectrum of EEG signals to be shifted towards lower frequencies. It is important to note that normal aging also causes a decrease of some spectral components of EEG signals such as alpha activity in temporal regions [11]. However, in case of AD the changes are much more severe and there is an overall decrease of a mean frequency of the EEG signals, decrease of alpha and beta components, and increase of delta and theta components [12].
It was shown that various types of dementia cause reduced interconnectivity between various cortical regions. However, this reduced interconnectivy is not the same for all the frequencies. Rather, it is dominant in higher frequency bands. A measure showing that is EEG coherence which is decreased for both close and distant channels for alpha and beta bands for various types of dementia [13]. This reduced coherence at higher frequencies is an influence of cognitive impairment.
Similarly, in [14], it was shown that the EEG features called epoch-based entropy (a measure of signal complexity) and bump modeling (a measure of synchrony) were sufficient for efficient classification between patients with subjective cognitive impairment (SCI) and possible AD patients (accuracy 91.6%) and with an accuracy of 81.8% to 88.8% for classification of SCI, possible AD and other patients. In [15], the classifier achieved almost 90% accuracy in classifying patients with mild cognitive impairment (MCI) and normal individuals. It was also found that selecting features from a combined set of power and coherence features produced better results than using each feature individually.
In [16], 26 patients diagnosed with AD, 53 MCI patients and 191 cognitively normal healthy participants were included in the study. In comparison between the control group and the AD group, an increase in spectral power and coherence at slower frequencies (delta and theta bands) was observed. In addition, the AD group showed a significant decrease in spectral and coherence analysis in the alpha band (consistent with the same effect in normal ageing). Furthermore, they conclude that the ratio of theta to alpha (TAR) shows the largest and most significant differences between the AD group and the controls [16].
The functional dysregulation of the default mode network that occurs with the progression of AD is often associated with a resting brain state similar to Alpha activity in the occipital area when the eyes are closed, as reported in [17,18].
A more comprehensive measure which takes into account both linear and nonlinear dependencies of various channels is called Mutual Information (MI). It was shown that mutual information between distant electrodes is decreased in patients with AD which can be explained by a reduced information transmission among various cortical regions [19].
Furthermore, in [20], Alzheimer’s dementia was analyzed using Global Field Synchronization (GFS) and patients showed a decrease in GFS values in the alpha, beta and gamma bands and an increase in GFS values in the delta band.
In [21], magnetoencephalography (MEG), connectivity analyses were performed with 18 AD patients and 18 patients in the control group, and AD patients showed a decrease in the mean phase lag index (PLI) value in the lower alpha and beta bands. In addition, both clustering coefficient and path length were decreased in AD patients.
1.3. Treatment of AD
Currently, the U.S. Food and Drug Administration (FDA) has approved several drugs (donepezil, the rivastigmine patch, and a combination drug of memantine and donepezil) for the treatment of moderate to severe Alzheimer’s disease [22]. At the same time, research is being conducted that is exploring a variety of options to not only treat the symptoms, but also to address the underlying disease processes. The possibility of modulating, facilitating, or interrupting this electrical activity of the brain is very appealing; it can help bring about temporary or reasonably permanent desirable changes in the brain [23]. Currently, various types of brain stimulation are being investigated, such as transcranial direct current stimulation (tDCS) [24], transcranial magnetic stimulation (TMS) [25], deep brain stimulation (DBS) [26], photobiomodulation (PBM) [17], etc. Although not yet used for AD, the alternative method of acupuncture to modulate brain activity is worth mentioning [27]. In this article, we focus on PBM.
1.4. Photobiomodulation (PBM)
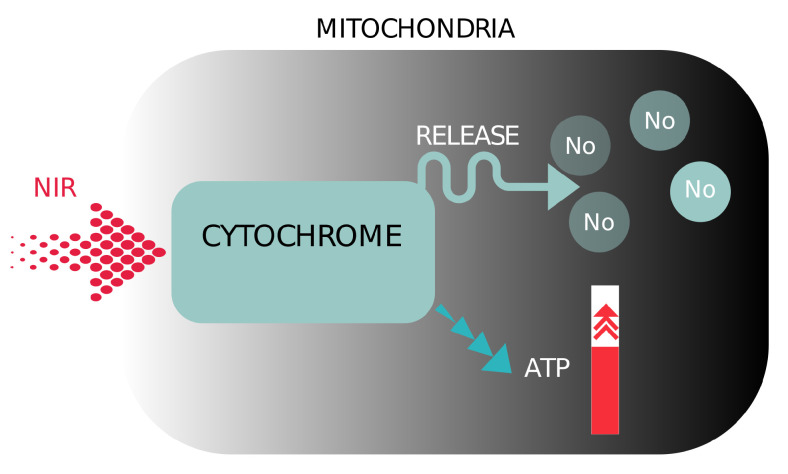
Photobiomodulation (PBM) refers to the therapeutic use of red or near-infrared light to stimulate inflammation, relieve pain, promote healing, and prevent tissue death [17]. The photons of a certain energy or the light of a certain wavelength are able to stimulate a photochemical reaction by being absorbed by the photoaccepting chemical substances in the cell [18]. Different wavelengths can be used, but red and near-infrared (NIR) light with wavelengths from 600 to 1100 nm are most commonly used because of their greater penetration depth. With red and NIR light, the photoacceptor is cytochrome c oxidase, an enzyme in mitochondria involved in the fourth phase of the mitochondrial respiratory chain [18,28]. When PBM is used with red and NIR light, mitochondria in cells produce more ATP (Anti-inflammatroy process), which consequently leads to more energy for the cell. In addition, PBM produces reactive oxygen species, which play an important role in cell healing, signaling, and stimulation of gene transcription by transcription factors and nuclear factors [18,29]. Another benefit of PBM is the release of nitric oxide from the mitochondria, allowing more oxygen to take its place and generate more energy [18], see Figure 1.
Figure 1.
Illustration of the schematic representation of the mechanisms of photobiomodulation near infrared light.
Several studies have already used PBM. In [30], participants took part in 20 min of active transcranial photobiomodulation (tPBM) twice at least one weekend apart. The authors in [30] analyzed the power spectrum and connectivity analysis in all frequency bands.
In addition, the influence of transcranial infrared laser stimulation on the power spectrum was analyzed in [31]. The TILS was performed once a week for 5 weeks with a laser power density of 250 mW/cm.
In [32], the effect of near-infrared photobiomodulation therapy was studied in patients with mild to moderate dementia or possible Alzheimer’s disease diagnosed with the Mini-Mental State Exam (MMSE). Patients were treated weekly in the clinic with a transcranial intranasal PBM device and daily at home with an intranasal device as part of a protocol. After 12 weeks of PBM, significant improvement in MMSE observation and improvement in function, less anxiety, less anger, wandering, and better sleep were noted.
In the study presented in [33], the effect of tPBM on default mode network connectivity was confirmed using functional magnetic resonance imaging.
2. Materials and Methods
2.1. Near Infra Red (NIR) Device Prototype
When selecting the LEDs, care was taken to ensure that the diodes radiate in the infrared range (IR), since it is at these wavelengths that light penetrates deepest into tissue and bone. In addition, a power of was required to achieve greater reliability (due to operation at powers lower than the rated power). LEDs with the following properties were purchased:
1 W, 810 nm; DC IF: 700 mA; DC UF: typical: 1.6–2.2 V; beam angle 120–140.
The control module is based on heltec-wifi-kit-32 development module and ESP32 microprocessor (dual-core 32-bit MCU + ULP cores; Wi-Fi, Bluetooth 2.4 GHz PCB antenna; -inch dot matrix OLED display; LED PWM, up to 16 channels; memory: ROM, 520 KB SRAM, 16 KB SRAM RTC, 4 MB SPI FLASH; Micro USB interface). A step-down buck converter with 9–36 V input and 5 V output and 12–24 V power supply was used to power the development module.
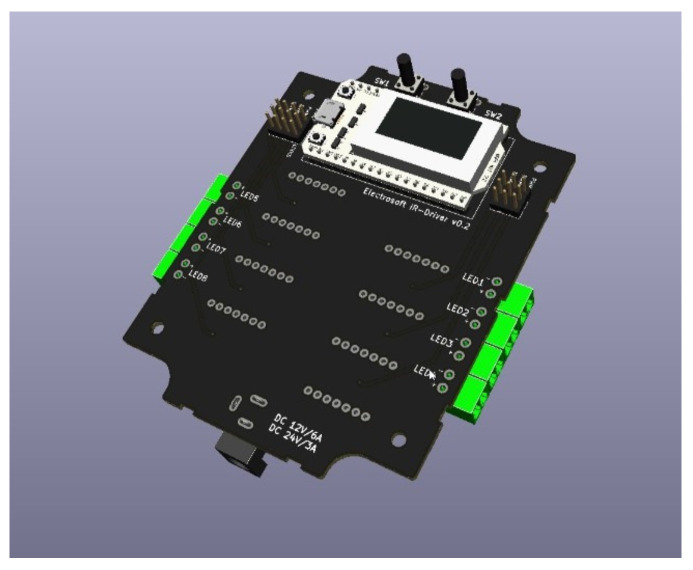
Four output channels LED PWM were used to power 4 clusters of 3 LEDs each, with the possibility of expansion to 8 channels. PT4115 3 W/700 mA max constant current LED driver was used as IR LED driver. The 3D model of the control module is shown in the Figure 2 below.
Figure 2.
The 3D model of the control module.
Output power of the device can be changed in four levels, indicated by a bar graph and modulation with a rectangular signal of frequency 8 Hz, 10 Hz, 12 Hz, 20 Hz and 40 Hz.
Optical power measurements were made with a Newport 843-R instrument, accuracy of full scale. The diameter of the sensor used is 10 mm and the area is 0.79 cm. The following Table 1 shows the mean value of measurements for LEDs, power (P) in mW and power density () in mW/cm, for 3 diodes in a cluster. Square modulation frequencies of 10 Hz and 40 Hz and continuous generation (DC) were tested.
Table 1.
Mean value of measurements for LEDs, power (P) in mW and power density () in mW/cm, for 3 diodes in a cluster. Square modulation frequencies of 10 and 40 Hz and continuous generation (DC) were tested for different power levels (PL).
| Type/Measure | 10 Hz/PL1 | 10 Hz/PL2 | 10 Hz/PL3 | 10 Hz/PL4 | 40 Hz/PL2 | 40 Hz/PL4 | DC/PL4 |
|---|---|---|---|---|---|---|---|
| P(mW) | 1 | 10 | 39 | ||||
| (mW/cm |
To reduce interference when recording EEG signals, two changes were also made: power is supplied by a battery and a two-wire shielded (and grounded) cable is used.
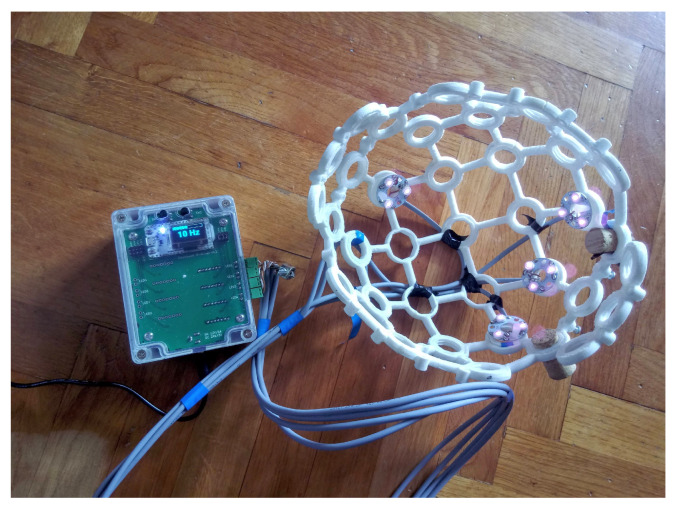
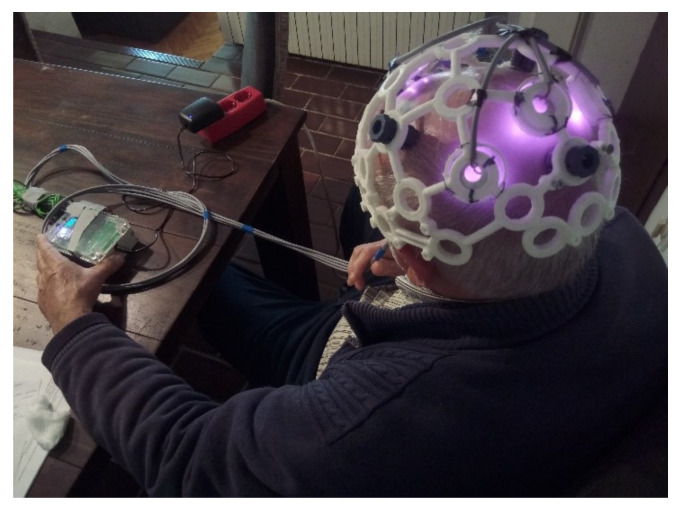
A 3D-printed EEG headset [34] was used to hold the IR LED. The headset used was selected based on the available CAD files and the ability to flexibly place the cluster of IR LEDs, see Figure 3.
Figure 3.
The cluster of IR LEDs mounted on a 3D-printed holder (headset) [34] and a prototype produced.
One cluster of IR LEDs is located between P3/P7, another between P4/P8, and two more clusters are located above electrodes Fz and Pz.
2.2. Stimulation Protocol
Stimulations were performed over a period of 35 days. The stimulation frequency was set at 10 Hz. During the first week of stimulation, three sessions were performed at power level 2, whereas during the remainder of the period, five sessions per week were performed at power level 3.
2.3. EEG Acquisition
EEG recordings were made with sixteen Brain Vision actiCAP active electrodes and the Brain Vision V-Amp amplifier with a resolution of 24 bits or 48.9 nV and a sampling rate of 512 Hz. The ground electrode was located on the right mastoid and the reference electrode on the left mastoid. EEG signals were recorded at positions Fp1, Fp2, F3, Fz, F4, T7, C3, Cz, C4, T8, P3, Pz, P4, O1, Oz, and O2 of the International Standard for electrode placement. An impedance check was performed using the Brain Vision Recorder, before the measurements and was less than 5 k. The study design was implemented in OpenVibe software, and EEGLab Toolbox was used to import the data into Matlab.
2.4. Description of the Pilot Study Design
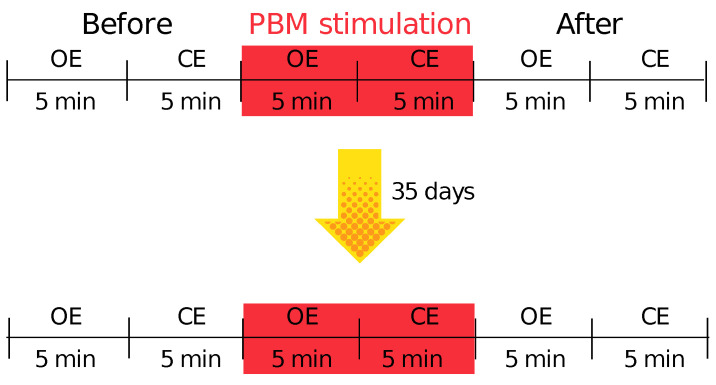
The measurement protocol consisted of the following parts: 10 minutes of EEG signal recording before stimulation (measurement interval marked “Before”) in two conditions with eyes open (OE) and eyes closed (CE) for 5 minutes each. Then EEG signals were recorded during photobiomodulation (measurement interval marked with “Stimulation”) and 10 minutes after photobiomodulation treatment (measurement interval marked with “After”). A schematic representation of the study design can be found in Figure 4.
Figure 4.
Schematic representation of the study design.
The prototype tests were performed on one subject: an elderly person (84 years old). Before starting the experiment, the subject was tested with the SAGE test. SAGE is a short questionnaire for self-assessment of cognitive status with the aim of detecting mild cognitive impairment (MCI) and early signs of dementia. The questionnaire takes an average of 15 minutes to complete. The maximum score is 22, and a score of 17 and above is considered normal (individuals with this score are within the normal range). Individuals with scores of 15 and 16 most likely suffering from a milder memory or thinking disorder. Individuals with a score of 14 or less are most likely to suffer from a more severe memory or thinking disorder [35]. In the first test with the questionnaire SAGE, the subject scored 16. See Figure 5 for the treatment of PBM stimulation.
Figure 5.
Schematic representation of the study design.
2.5. Offline Preprocessing
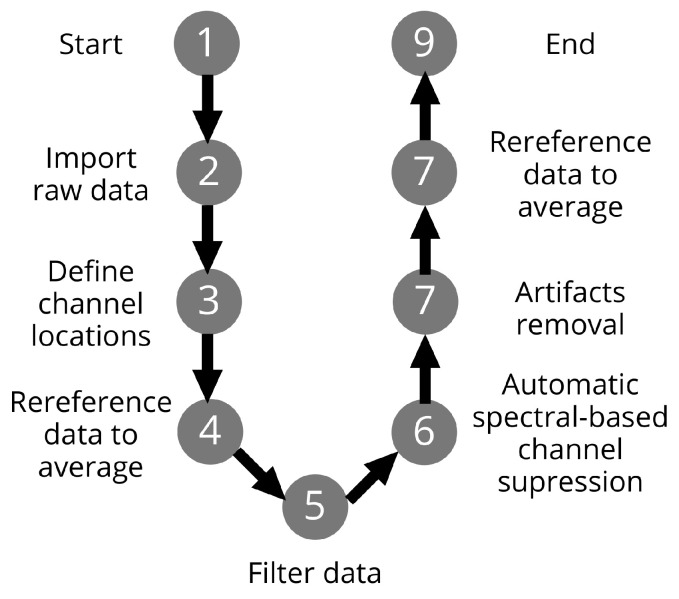
The steps of offline preprocessing of raw EEG signals are shown in the flowchart, see Figure 6.
Figure 6.
The illustration of the offline preprocessing steps.
The EEGLab toolbox was used to import the raw EEG data into Matlab. In addition, channel positions were determined according to the international 10–20 standard. Furthermore, the data were referenced to the average and filtered to the desired frequency bands. Automatic spectral channel suppression () was performed using the EEGLab “pop-rejchan” function. Moreover, artifacts were removed using the EEGLab plugin IClabel. Thresholds to remove components were chosen that were greater than or equal to for artifacts and less than or equal to for brain activity. At the end, the data were referenced to the average.
2.6. Analyses
2.6.1. Power Spectrum Analysis
Frequency analysis was performed by Fast Fourier transform (FFT) on time segments of length 1 s (512 samples) using the Hamming window function. The EEG signal was analyzed in the following frequency ranges: Theta (4–7 Hz) and Alpha (8–12 Hz).
In this work, the short-term effect of PBM on EEG signals and also a long-term effect is observed. The short-term effect is observed using the ratio of the sum of the power in the alpha band after and before the first recording (r1-on the first day of the experiment) (the same is done for the second recording (r2-on the last day of the experiment)). The calculation is repeated for the theta band. The ratio is defined as follows:
| (1) |
where is the FFT coefficients of the i-th spectral component, a and b are the recording after and before PBM stimulation, respectively, STATE represents the OE or CE state in the r1 or r2 sessions.
The short-term effect is also observed using the TAR index and comparing the ratio of the TAR index after and before the r1 and r2.
The long-term effect is observed using the same indices, but looking at the r2 after stimulation and the r1 before stimulation.
2.6.2. Connectivity Analysis
In this work, we will observe functional connectivity at predefined intervals. We observe the brain network dynamics applying the index of functional connectivity called Complex Pearson Correlation Coefficient (CPCC) [36]. The CPCC measure can be divided into two components (measures): the absolute value of the complex Pearson correlation coefficient (absCPCC), where a zero phase shift affects the outcome, and the imaginary component of the complex Pearson correlation coefficient (imCPCC), where a zero phase shift does not affect the outcome. The relationship between the phase locking value (PLV) and absCPCC, and the weighted phase-lag index (wPLI) and imCPCC has been demonstrated numerically and analytically [36], and it was found that PLV can be replaced by absCPCC and wPLI by imCPCC [36]. CPCC is defined as,
| (2) |
where N is the number of samples, and are analytical signals given by Hilbert transform, and is the complex conjugate operator. Where and represent analytical signals given by the Hilbert transform, represents the complex conjugate operator, and N represents the number of samples.
In what follows, we will use imCPCC which is defined as follows [37]:
| (3) |
3. Results
3.1. Power Spectrum Analysis
According to [16], the indicator for the diagnosis of Alzheimer’s disease is a significant and widespread decrease in the power of the alpha band and, in contrast, a power increase in theta band. Accordingly, the goal of PBM stimulation should be to increase the power of the alpha band and decrease the power of the theta band.
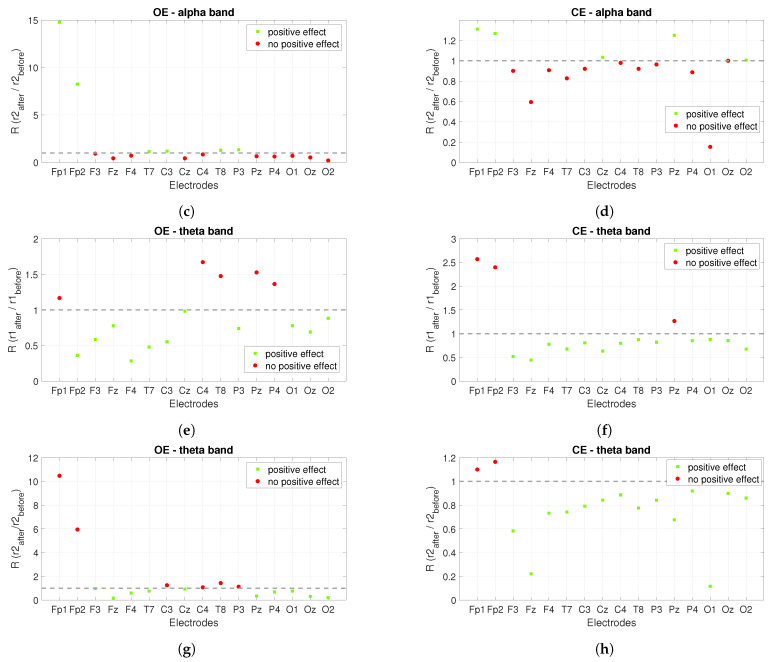
Figure 7 shows the short-term effect of PBM stimulation. The ratio of the power of the alpha band after and before each recording was shown, and for the theta band, the power after and before the stimulations was compared. For the alpha band, the ratio is expected to be greater than one, and for the theta band, the aim is for it to be less than one. The green squares mark the ratios for the electrodes that achieved the desired increase in the alpha band and decrease in the theta band, while the red circles mark ratios that are not satisfactory.
Figure 7.
The short-term effect of PBM stimulation on the power spectrum when the alpha and theta bands are observed. The figures show the ratios in the observed bands for the r1 and r2: (a,b) show the power ratios between the r1 after and before stimulation for the alpha band with OE and CE for each electrode, (c,d) show the ratios for the r2. (e,f) show the power ratios between the r1 after and before stimulation for the theta band with OE and CE for each electrode. Figure (g,h) show the ratios for the r2 for each electrode.
For the r1, the power ratios for the alpha band under the condition OE, showed that there was a visible increase at nine of sixteen electrodes shortly after stimulation (see Figure 7a), and under the condition CE at eleven of sixteen electrodes, see Figure 7b. In the r2, the positive effect is visible at six of sixteen electrodes for OE (Figure 7c) and at five of sixteen electrodes for CE, see Figure 7d. Figure 7e plots the ratio of power in the theta band for the OE condition in the r1. The positive effect is visible on eleven of sixteen electrodes, while for the CE condition the positive effect is visible on thirteen of sixteen electrodes, see Figure 7f. For the r2 in the OE condition (Figure 7g), the positive effect is visible on ten of sixteen electrodes and for the CE condition, the positive effect is visible on fourteen of sixteen electrodes (Figure 7h).
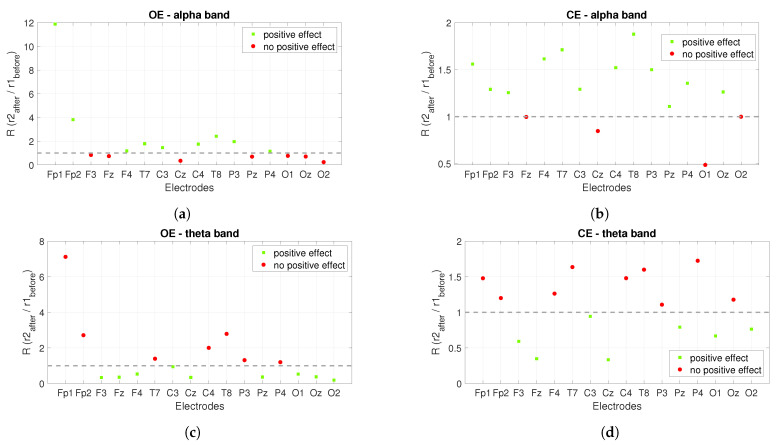
The power ratios between the r2 after stimulation and the r1 before stimulation show us the long-term effect of PBM stimulation, see Figure 8. Similar to Figure 7, a ratio greater than one is expected for the alpha band and the opposite (less than one) for the theta band. The green squares mark satisfactory ratios, while the red circles mark ratios that are not satisfactory. Figure 8a shows the power ratios for the alpha band under the OE condition and the positive effect is founded in nine out of sixteen electrodes, while Figure 8b shows the ratios for the alpha band under the CE condition and the positive effect is visible in twelve out of sixteen electrodes. The power ratios for the theta band are shown in Figure 8c,d. Figure 8c shows the ratios for the OE condition and the positive effect is seen at nine of sixteen electrodes, while for the CE condition the positive effect is seen at seven of sixteen electrodes, see Figure 8d.
Figure 8.
The long-term effect of PBM stimulation on the power spectrum when alpha and theta bands are observed. The figures show the power ratios between the r2 after stimulation and the r1 before stimulation. (a) shows the power ratios for the alpha band at OE, while Figure (b) shows the power ratios at CE. (c) presents the power ratios for the theta band at OE, while (d) is for CE.
Another indicator presented in [16] is TAR. It was concluded that a significant and widespread increase in TAR is an indicator of Alzheimer’s disease. Therefore, we are expecting to decrease TAR by applying PBM stimulation. In Figure 9 and Figure 10, the green squares mark the ratios for the electrodes where the TAR ratio has reached the desired value (less than one), while the red circles mark the ratios where the desired value is not reached (greater than one).
Figure 9.
The short-term effect of PBM stimulation on the power spectrum is observed using TAR. The figures show the ratios of TAR for the r1 and r2 recordings. (a) shows the ratios of TAR for the r1 after and before PBM stimulation under the condition OE, while (b) shows the ratios of TAR under the condition CE. (c,d) show the ratios for the r2 and TAR after and before stimulation was compared.
Figure 10.
The long-term effect of PBM stimulation on the power spectrum is observed using TAR. (a) shows the ratios of TAR between the r2 after and the r1 before stimulation in the OE condition, and (b) shows the ratios of TAR in the CE condition.
Figure 9 shows the short-term effect of PBM stimulation using TAR. Figure 9a shows the ratios of TAR between the r1 after and before stimulation under the OE condition and Figure 9b under the CE condition. The positive effect of PBM stimulation is visible at thirteen of sixteen electrodes for the conditions OE and for CE. Figure 9c shows the ratios of TAR between the r2 after and before stimulation under OE and Figure 9d under CE. Under the OE condition, a positive effect is detected at nine of sixteen electrodes, whereas under the CE condition, the positive effect is seen at fifteen of sixteen electrodes.
Figure 10 shows the long-term effects of PBM stimulation using TAR. The ratios of TAR shown in Figure 10 are calculated between the r2 after stimulation and the r1 before stimulation. Figure 10a shows the observed ratios during the OE condition and the positive effect is seen at thirteen of sixteen electrodes, while Figure 10b shows the observed ratios during the CE condition and the positive effect is seen at fourteen of sixteen electrodes.
In addition, the electrodes show different positive long-term effects under different eye conditions because brain regions are differently active in different conditions, which is confirmed in [38].
3.2. Connectivity Analysis
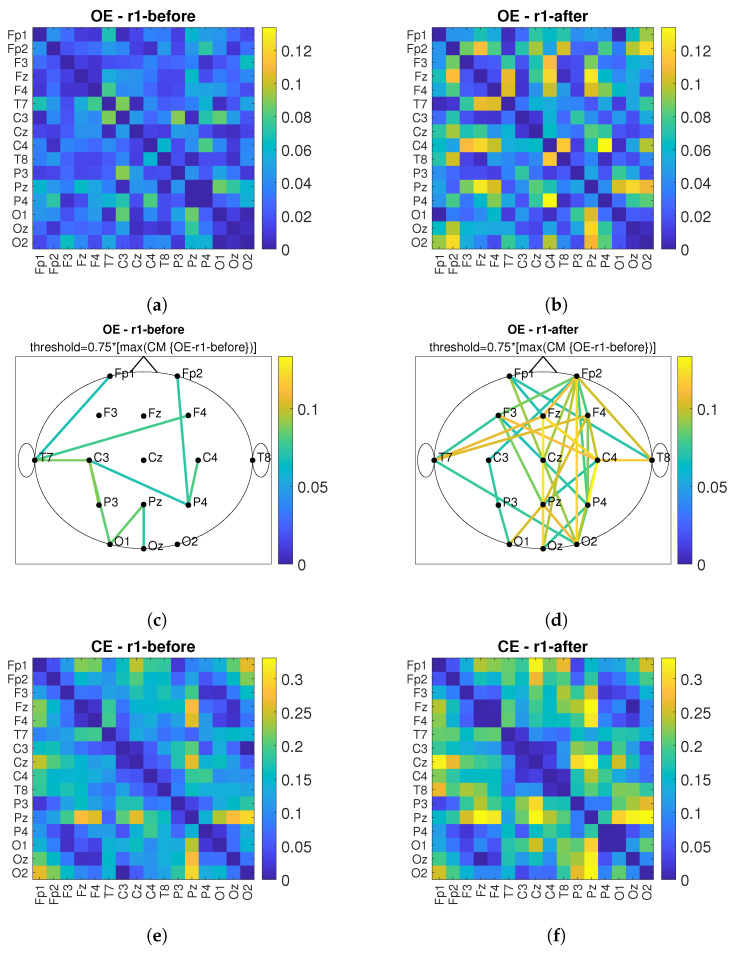
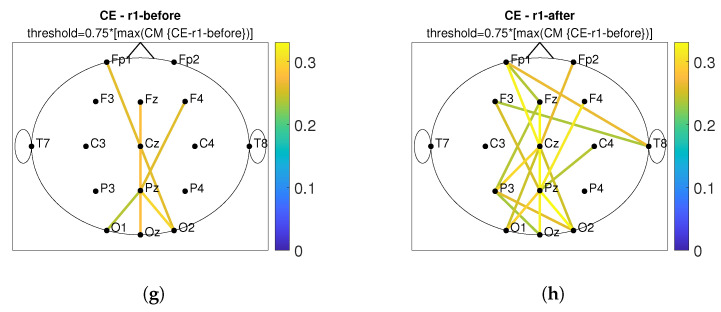
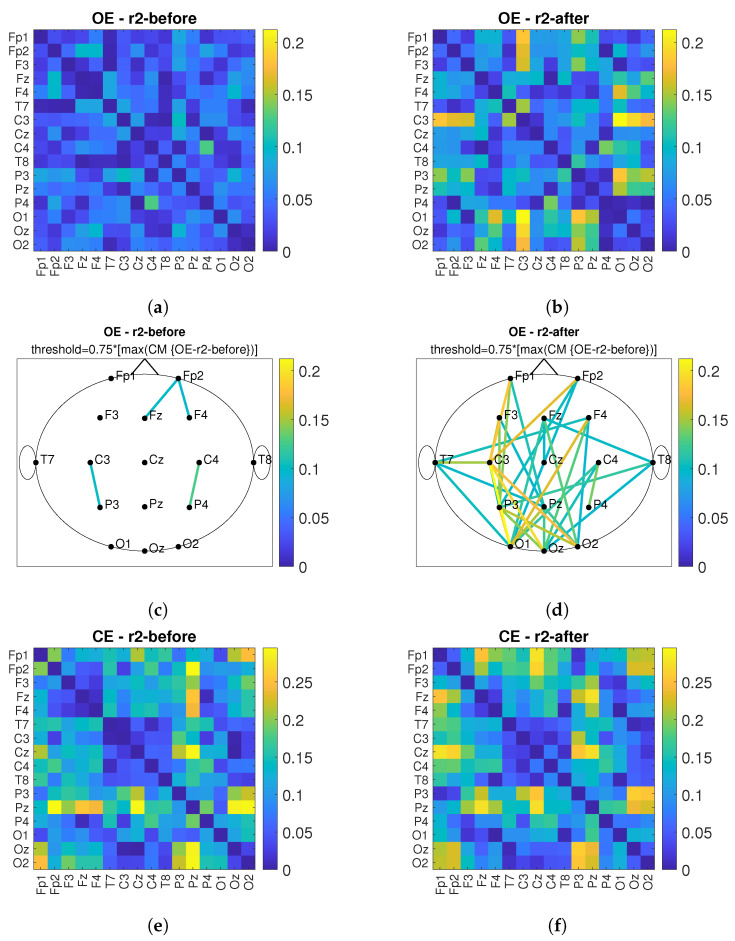
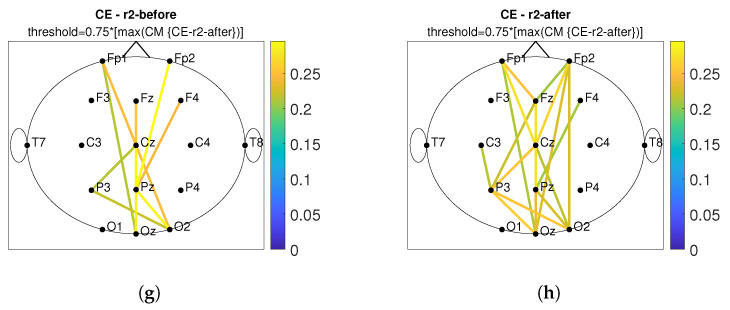
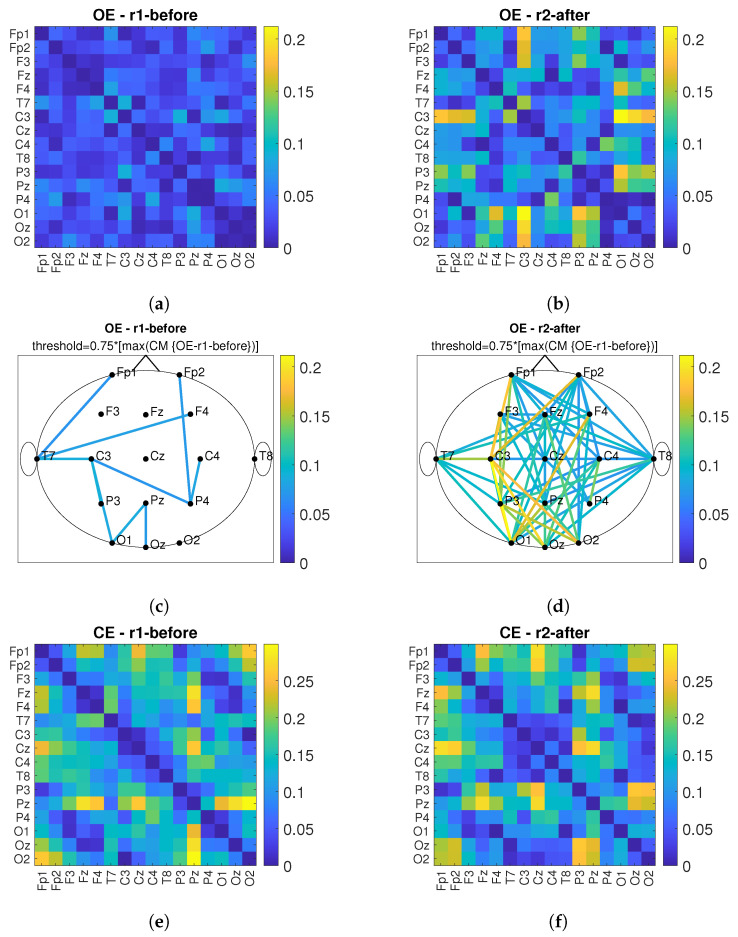
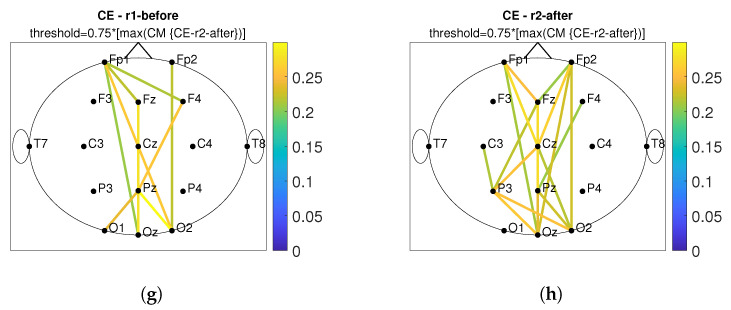
According to [13], connectivity between near and far electrodes for the alpha band decreases in different types of dementia. Therefore, the goal of PBM stimulation is to increase the number of connections and connectivity values between the observed electrodes after PBM stimulation. Figure 11 shows the connectivity matrices (CM) and the head plot of the connections above threshold between pairs of electrodes for the conditions OE and CE and before/after stimulation. First, the maximum value of the compared CMs before and after is determined and the matrix with the lower maximum value is used as the reference matrix. The threshold was set at of the maximum value of the reference matrix. All connections above the threshold are shown in the head plots. The short-term effect is observed and the comparison before and after stimulation is performed for the r1, see Figure 11. By comparing Figure 11a,c with Figure 11b,d, it can be observed that the values of connections between electrode pairs are higher after PBM stimulation and that the number of electrode pairs increases. The same conclusion is obtained when considering the CE condition, which is shown in Figure 11e,g (before stimulation) and Figure 11f,h (after stimulation). Figure 12 shows the short-term effect of PBM stimulation for the r2. For the conditions of OE (Figure 12a–d), it was found that the connection between different brain regions increased more after stimulation compared with CE (Figure 12e–h). Figure 13 shows the long-term effects of PBM stimulation. A comparison of connectivity between the r1 before stimulation and the r2 after stimulation for the OE (Figure 13a–d) and CE (Figure 13e–h) conditions is shown. Higher values of the connection between the electrodes are visible.
Figure 11.
The short-term effect of PBM stimulation in observing the connectivity values of imCPCC at the r1. The connectivity matrices (CM) and the head plot of the connections above threshold between electrode pairs are observed. (a) shows the CM under the OE condition before stimulation and (c) shows the headplot of the connections, while (b,d) show the CM and the headplot of the connections after stimulation. (e–h) show the CM or the headplot of the CE condition.
Figure 12.
The short-term effect of PBM stimulation in observing the connectivity values of imCPCC at the r2. The connectivity matrices (CM) and the head plot of the connections above threshold between electrode pairs are observed. (a) shows the CM under the OE condition before stimulation and (c) shows the headplot of the connections, while (b,d) show the CM and the headplot of the connections after stimulation. (e–h) show the CM or the headplot of the CE condition.
Figure 13.
The long-term effect of PBM stimulation in observing the connectivity values of imCPCC comparing the r1 before and the r2 after stimulation. The connectivity matrices (CM) and the head plot of the connections above threshold between electrode pairs are observed. (a) shows the CM under the OE condition for the r1 before stimulation and (c) shows the headplot of the connections, while (b,d) show the CM and the headplot of the connections for the r2 after stimulation. (e–h) show the CM or headplot of the CE condition.
Global efficiency was calculated for the CM headplots shown in Figure 13c,d,g,h. The global efficiency is defined as follows [39]:
| (4) |
where is the efficiency of node i, is the shortest path length (distance) between nodes i and j, N is the set of all nodes in the network, and n is the number of nodes. Global efficiency is a measure of the efficiency of remote information transmission in a network. It can be described as the inverse of the average characteristic path length between all nodes in the network [40].
The global efficiency values for all observed CM-s can be found in Table 2.
Table 2.
This table contains the values of global efficiency (E) calculated for CM-s, which are shown in headplots Figure 13c,d,g,h.
| Recordings | E |
|---|---|
| r1-OE condition before stimulation | |
| r2-OE condition after stimulation | |
| r1-CE condition before stimulation | |
| r2-CE condition after stimulation |
From Table 2, we can conclude that global efficiency increased after treatment with PBM stimulation in both conditions with OE and CE.
4. Discussion
In this work, we used a stimulation frequency of with power levels 2 and 3 producing a power density of and 12.7 mW/cm for each of the 3 clusters of LED, see Table 1. We chose a stimulation frequency of 10 Hz because the features of Alzheimer’s disease in EEG have been described in [16,17,18], where it is confirmed that participants with AD showed a significant decrease in spectral and coherence analysis in the alpha band. During the first week of stimulation, three sessions were conducted at power level 2, while during the rest of the time, five sessions per week were conducted at power level 3.
When analyzing the power spectrum, an FFT with time segments of 512 samples (1 second) was performed using the Hamming window function. Looking at the power spectrum of the alpha band, we can observe an increase in the power spectrum at most electrodes, observing both the short-term and long-term effect (for the short-term effect, we compare the effect of PBM by comparing the power spectrum before and after stimulation for the r1 and r2 EEG recordings, in contrast, the long-term effect was calculated by looking at r1 before stimulation and r2 (recording after 35 days of PBM stimulation) after stimulation). This is a positive effect due to the fact that participants with AD usually show a decrease in the alpha band power spectrum [16].
Similar results were reported in [30], where spectral analysis was performed using the Welch method (with a window length of 512 points, FFT length of 1024 points, without overlap). They used stimulation at a frequency of . The increase of alpha band power spectrum after active tPBM was found in [30]. In [30], all frequency bands were observed, but it was emphasized that the changes were greatest in the alpha band. They present the changes in the power spectrum in such a way that they averaged the power spectrum across all electrodes. In this article we show the changes for all electrodes used.
Moreover, similar results are confirmed in [31]. In [31], transcranial infrared laser stimulation (TILS) was performed once a week for a period of 5 weeks. The laser wave was continuous and with a power density of 250 mW/cm. The long-term effect of TILS on resting state EEG was observed and the effect of TILS was found in both left and right hemispheres. The largest increase in the analyzed power spectrum was found in the alpha band both during and after TILS. The largest effect was found in the occipital region and the smallest in the parietal and frontal regions.
In [12], the increase in the theta band is presented as an indicator of the detection of AD. For this reason, we decided to analyze the power spectrum of the theta band. The aim was to decrease the values of the theta power spectrum by PBM stimulation. Considering the short-term effect of the power spectrum in the theta band, a positive effect was found in eleven of sixteen electrodes for OE and in thirteen of sixteen electrodes for CE in the r1, while it was found in ten of sixteen electrodes for OE and in fourteen of sixteen electrodes in the CE condition in the r2. In the theta band, a positive long-term effect was found in nine of sixteen electrodes for OE and in seven of sixteen electrodes for CE. In [16], it was found that a significant and widespread increase in TAR is an important indicator of Alzheimer’s disease. When considering TAR, a decrease in TAR was considered a positive effect. When considering the short-term effect with the indicator TAR, the positive effect in the alpha band was found in thirteen of sixteen electrodes for OE and CE on the r1 and in nine of sixteen electrodes for OE and fifteen of sixteen electrodes for CE on the r2. The positive long-term effect is found at thirteen of sixteen electrodes for OE and at fourteen of sixteen electrodes for CE.
In this work, we have chosen to use the connectivity measure imCPCC which was introduced in [36,37] and could replace wPLI for brain connectivity analysis. To evaluate the properties of the brain network (i.e., the network representing the connections between different brain areas), we used the graph-theoretic measure of global efficiency. The alpha band was observed according to [16]. We desired an increase in global efficiency after PBM stimulation, which we obtained. Similar results can be found in [30]. There, the influence of active tPBM was analyzed using the wPLI connectivity measure. To evaluate the integration and segregation properties of the brain network, graph theoretic measures were used, characteristic path length, clustering coefficient, local efficiency, and global efficiency, and the changes were most pronounced in the alpha frequency band for all measures used. The increase in global efficiency was highlighted as a positive effect of PBM [30]. In addition, an increase in connectivity in the posterior region was found in [33] using functional magnetic resonance imaging.
5. Conclusions
In this article, the effects of stimulation treatment with photobiomodulation are analyzed, a case study is performed. Power spectrum analyses and connectivity analyses are performed. Alpha, theta bands, and TAR were observed in the power spectrum analysis, whereas the alpha band was observed in the connectivity analysis. The near-infrared device prototype was designed and realized and PBM stimulation was performed in an elderly person with a SAGE score indicating probable memory and thinking disorder. The short-term effect and long-term effect of PBM stimulation on the power spectrum were analyzed. A positive influence was found in a larger number of electrodes. A connectivity analysis using the imCPCC index was also performed. A long-term effect was observed in the calculation of the global efficiency measure. A global efficiency measure was calculated based on connectivity matrices with threshold values. The global efficiency calculated for the long-term effect was higher than before stimulation by a factor of in the OE condition and by a factor of in the CE condition. In future work, we will conduct the study with a larger number of participants.
Abbreviations
The following abbreviations are used in this manuscript:
| absCPCC | absolute value of complex Pearson correlation coefficient |
| AD | Alzheimer’s disease |
| CE | closed eyes |
| CM | connectivity matrix |
| CPCC | Complex Pearson correlation coefficient |
| CT | Computed tomography |
| DBS | deep brain stimulation |
| EEG | Electroencephalography |
| FDA | U.S. Food and Drug Administration |
| FFT | Fast Fourier transform |
| GFS | Global Field Synchronization |
| IR LED | infra-red Light Emitting Diode |
| imCPCC | imaginary component of complex Pearson correlation coefficient |
| LED | Light Emitting Diode |
| MCI | mild cognitive impairment |
| MEG | Magnetoencephalography |
| MI | Mutual Information |
| MMSE | Mini-Mental State Exam |
| MRI | Magnetic Resonance Imaging |
| NIR | near-infrared |
| OE | opened eyes |
| PBM | photobiomodulation |
| PLI | Phase Lag Index |
| PLV | Phase Locking Value |
| r1 | First Recording |
| r2 | Second Recording |
| TAR | theta-alpha ratio |
| tDCS | transcranial direct current stimulation |
| TILS | transcranial infrared laser stimulation |
| TMS | transcranial magnetic stimulation |
| tPBM | transcranial photobiomodulation |
| SAGE | Self Administered Gerocognitive Exam |
| SCI | subjective cognitive impairment |
| wPLI | Weighted Phase Lag Index |
Author Contributions
Conceptualization, S.V., M.V. and Z.Š.; methodology, S.V., M.V. and Z.Š.; software, Z.Š.; validation, S.V., Z.Š. and M.V.; formal analysis, S.V., Z.Š. and M.V.; investigation, S.V., Z.Š. and M.V.; resources, M.V.; data curation, S.V., Z.Š. and M.V.; writing—original draft preparation, Z.Š., M.V. and S.V.; writing—review and editing, Z.Š., S.V., M.V. and I.M.; visualization, Z.Š.; supervision, S.V. and M.V.; project administration, M.V. and S.V.; funding acquisition, M.V. All authors have read and agreed to the published version of the manuscript.
Institutional Review Board Statement
Not applicable.
Informed Consent Statement
Not applicable.
Conflicts of Interest
The authors declare no conflict of interest.
Funding Statement
This research was co-financed by the Ministry of Economy, Entrepreneurship and Crafts through the Croatian Agency for SMEs, Innovation and Investments (HAMAG-BICRO) through the Proof of Concept (PoC) program with the project code PoC8_2_6.
Footnotes
Publisher’s Note: MDPI stays neutral with regard to jurisdictional claims in published maps and institutional affiliations.
References
- 1.Boccaletti S., Latora V., Moreno Y., Chavez M., Hwang D.U. Complex networks: Structure and dynamics. Phys. Rep. 2006;424:175–308. doi: 10.1016/j.physrep.2005.10.009. [DOI] [Google Scholar]
- 2.Callixte K.T., Clet T.B., Jacques D., Faustin Y., François D.J., Maturin T.T. The pattern of neurological diseases in elderly people in outpatient consultations in Sub-Saharan Africa. BMC Res. Notes. 2015;8:1–6. doi: 10.1186/s13104-015-1116-x. [DOI] [PMC free article] [PubMed] [Google Scholar]
- 3.Alzheimer’s Association What Is Alzheimer’s Disease? [(accessed on 15 June 2022)]. Available online: https://www.alz.org/alzheimers-dementia/what-is-alzheimers.
- 4.Hogan D.B., Fiest K.M., Roberts J.I., Maxwell C.J., Dykeman J., Pringsheim T., Steeves T., Smith E.E., Pearson D., Jetté N. The prevalence and incidence of dementia with Lewy bodies: A systematic review. Can. J. Neurol. Sci. 2016;43:S83–S95. doi: 10.1017/cjn.2016.2. [DOI] [PubMed] [Google Scholar]
- 5.Goetz C.G., Emre M., Dubois B. Parkinson’s disease dementia: Definitions, guidelines, and research perspectives in diagnosis. Ann. Neurol. Off. J. Am. Neurol. Assoc. Child Neurol. Soc. 2008;64:S81–S92. doi: 10.1002/ana.21455. [DOI] [PubMed] [Google Scholar]
- 6.Snowden J.S., Neary D., Mann D.M. Frontotemporal dementia. Br. J. Psychiatry. 2002;180:140–143. doi: 10.1192/bjp.180.2.140. [DOI] [PubMed] [Google Scholar]
- 7.Walker F.O. Huntington’s disease. Lancet. 2007;369:218–228. doi: 10.1016/S0140-6736(07)60111-1. [DOI] [PubMed] [Google Scholar]
- 8.Iwasaki Y. Creutzfeldt-Jakob disease. Neuropathology. 2017;37:174–188. doi: 10.1111/neup.12355. [DOI] [PubMed] [Google Scholar]
- 9.NHS Tests for Diagnosing Dementia. [(accessed on 15 June 2022)]. Available online: https://www.nhs.uk/conditions/dementia/diagnosis-tests/
- 10.Jeong J. EEG dynamics in patients with Alzheimer’s disease. Clin. Neurophysiol. 2004;115:1490–1505. doi: 10.1016/j.clinph.2004.01.001. [DOI] [PubMed] [Google Scholar]
- 11.Busse E.W., Barnes R.H., Friedman E.L., Kelty E.J. Psychological functioning of aged individuals with normal and abnormal electroencephalograms. J. Nerv. Ment. Dis. 1956;124:135–141. doi: 10.1097/00005053-195608000-00003. [DOI] [PubMed] [Google Scholar]
- 12.Brenner R.P., Ulrich R.F., Spiker D.G., Sclabassi R.J., Reynolds III C.F., Marin R.S., Boller F. Computerized EEG spectral analysis in elderly normal, demented and depressed subjects. Electroencephalogr. Clin. Neurophysiol. 1986;64:483–492. doi: 10.1016/0013-4694(86)90184-7. [DOI] [PubMed] [Google Scholar]
- 13.Besthorn C., Förstl H., Geiger-Kabisch C., Sattel H., Gasser T., Schreiter-Gasser U. EEG coherence in Alzheimer disease. Electroencephalogr. Clin. Neurophysiol. 1994;90:242–245. doi: 10.1016/0013-4694(94)90095-7. [DOI] [PubMed] [Google Scholar]
- 14.Houmani N., Vialatte F., Gallego-Jutglà E., Dreyfus G., Nguyen-Michel V.H., Mariani J., Kinugawa K. Diagnosis of Alzheimer’s disease with Electroencephalography in a differential framework. PLoS ONE. 2018;13:e0193607. doi: 10.1371/journal.pone.0193607. [DOI] [PMC free article] [PubMed] [Google Scholar]
- 15.Akrofi K., Pal R., Baker M.C., Nutter B.S., Schiffer R.W. Classification of Alzheimer’s disease and mild cognitive impairment by pattern recognition of EEG power and coherence; Proceedings of the 2010 IEEE International Conference on Acoustics, Speech and Signal Processing; Dallas, TX, USA. 15–19 March 2010; pp. 606–609. [Google Scholar]
- 16.Meghdadi A.H., Stevanović Karić M., McConnell M., Rupp G., Richard C., Hamilton J., Salat D., Berka C. Resting state EEG biomarkers of cognitive decline associated with Alzheimer’s disease and mild cognitive impairment. PLoS ONE. 2021;16:e0244180. doi: 10.1371/journal.pone.0244180. [DOI] [PMC free article] [PubMed] [Google Scholar]
- 17.Hamblin M.R. Photobiomodulation for Alzheimer’s disease: Has the light dawned? Photonics. 2019;6:77. doi: 10.3390/photonics6030077. [DOI] [PMC free article] [PubMed] [Google Scholar]
- 18.Vlahinić S., Šverko Z., Bačnar D., Bebić L. Analyses of IR stimulation influence on EEG; Proceedings of the 2020 IEEE International Instrumentation and Measurement Technology Conference (I2MTC); Dubrovnik, Croatia. 25–28 May 2020; pp. 1–6. [Google Scholar]
- 19.Jeong J., Gore J.C., Peterson B.S. Mutual information analysis of the EEG in patients with Alzheimer’s disease. Clin. Neurophysiol. 2001;112:827–835. doi: 10.1016/S1388-2457(01)00513-2. [DOI] [PubMed] [Google Scholar]
- 20.König T., Prichep L., Dierks T., Hubl D., Wahlund L., John E., Jelic V. Decreased EEG synchronization in Alzheimer’s disease and mild cognitive impairment. Neurobiol. Aging. 2005;26:165–171. doi: 10.1016/j.neurobiolaging.2004.03.008. [DOI] [PubMed] [Google Scholar]
- 21.Stam C., De Haan W., Daffertshofer A., Jones B., Manshanden I., van Cappellen van Walsum A.M., Montez T., Verbunt J., De Munck J., Van Dijk B., et al. Graph theoretical analysis of magnetoencephalographic functional connectivity in Alzheimer’s disease. Brain. 2009;132:213–224. doi: 10.1093/brain/awn262. [DOI] [PubMed] [Google Scholar]
- 22.National Institute on Aging How Is Alzheimer’s Disease Treated? [(accessed on 15 June 2022)]; Available online: https://www.nia.nih.gov/health/how-alzheimers-disease-treated.
- 23.Zhao H., Qiao L., Fan D., Zhang S., Turel O., Li Y., Li J., Xue G., Chen A., He Q. Modulation of brain activity with noninvasive transcranial direct current stimulation (tDCS): Clinical applications and safety concerns. Front. Psychol. 2017;8:685. doi: 10.3389/fpsyg.2017.00685. [DOI] [PMC free article] [PubMed] [Google Scholar]
- 24.Gangemi A., Colombo B., Fabio R.A. Effects of short-and long-term neurostimulation (tDCS) on Alzheimer’s disease patients: Two randomized studies. Aging Clin. Exp. Res. 2021;33:383–390. doi: 10.1007/s40520-020-01546-8. [DOI] [PubMed] [Google Scholar]
- 25.Sabbagh M., Sadowsky C., Tousi B., Agronin M.E., Alva G., Armon C., Bernick C., Keegan A.P., Karantzoulis S., Baror E., et al. Effects of a combined transcranial magnetic stimulation (TMS) and cognitive training intervention in patients with Alzheimer’s disease. Alzheimer’s Dement. 2020;16:641–650. doi: 10.1016/j.jalz.2019.08.197. [DOI] [PubMed] [Google Scholar]
- 26.Laxton A.W., Lozano A.M. Deep brain stimulation for the treatment of Alzheimer disease and dementias. World Neurosurg. 2013;80:S28.e1–S28.e8. doi: 10.1016/j.wneu.2012.06.028. [DOI] [PubMed] [Google Scholar]
- 27.Fernandez Rojas R., Liao M., Romero J., Huang X., Ou K.L. Cortical network response to acupuncture and the effect of the hegu point: An fNIRS study. Sensors. 2019;19:394. doi: 10.3390/s19020394. [DOI] [PMC free article] [PubMed] [Google Scholar]
- 28.Hamblin M.R. Shining light on the head: Photobiomodulation for brain disorders. BAA Clin. 2016;6:113–124. doi: 10.1016/j.bbacli.2016.09.002. [DOI] [PMC free article] [PubMed] [Google Scholar]
- 29.de Freitas L.F., Hamblin M.R. Proposed mechanisms of photobiomodulation or low-level light therapy. IEEE J. Sel. Top. Quantum Electron. 2016;22:348–364. doi: 10.1109/JSTQE.2016.2561201. [DOI] [PMC free article] [PubMed] [Google Scholar]
- 30.Zomorrodi R., Loheswaran G., Pushparaj A., Lim L. Pulsed near infrared transcranial and intranasal photobiomodulation significantly modulates neural oscillations: A pilot exploratory study. Sci. Rep. 2019;9:6309. doi: 10.1038/s41598-019-42693-x. [DOI] [PMC free article] [PubMed] [Google Scholar]
- 31.Vargas E., Barrett D.W., Saucedo C.L., Huang L.D., Abraham J.A., Tanaka H., Haley A.P., Gonzalez-Lima F. Beneficial neurocognitive effects of transcranial laser in older adults. Lasers Med Sci. 2017;32:1153–1162. doi: 10.1007/s10103-017-2221-y. [DOI] [PMC free article] [PubMed] [Google Scholar]
- 32.Saltmarche A.E., Naeser M.A., Ho K.F., Hamblin M.R., Lim L. Significant improvement in cognition in mild to moderately severe dementia cases treated with transcranial plus intranasal photobiomodulation: Case series report. Photomed. Laser Surg. 2017;35:432–441. doi: 10.1089/pho.2016.4227. [DOI] [PMC free article] [PubMed] [Google Scholar]
- 33.Chao L.L. Effects of home photobiomodulation treatments on cognitive and behavioral function, cerebral perfusion, and resting-state functional connectivity in patients with dementia: A pilot trial. Photobiomodul. Photomed. Laser Surg. 2019;37:133–141. doi: 10.1089/photob.2018.4555. [DOI] [PubMed] [Google Scholar]
- 34.2022 OpenBCI OpenBCI. [(accessed on 15 June 2022)]. Available online: https://openbci.com/
- 35.Scharre D.W., Chang S.I., Murden R.A., Lamb J., Beversdorf D.Q., Kataki M., Nagaraja H.N., Bornstein R.A. Self-administered Gerocognitive Examination (SAGE): A brief cognitive assessment Instrument for mild cognitive impairment (MCI) and early dementia. Alzheimer Dis. Assoc. Disord. 2010;24:64–71. doi: 10.1097/WAD.0b013e3181b03277. [DOI] [PubMed] [Google Scholar]
- 36.Šverko Z., Vrankić M., Vlahinić S., Rogelj P. Complex Pearson Correlation Coefficient for EEG Connectivity Analysis. Sensors. 2022;22:1477. doi: 10.3390/s22041477. [DOI] [PMC free article] [PubMed] [Google Scholar]
- 37.Šverko Z., Vrankic M., Vlahinić S., Rogelj P. Dynamic Connectivity Analysis Using Adaptive Window Size. Sensors. 2022;22:5162. doi: 10.3390/s22145162. [DOI] [PMC free article] [PubMed] [Google Scholar]
- 38.Costumero V., Bueichekú E., Adrián-Ventura J., Ávila C. Opening or closing eyes at rest modulates the functional connectivity of V1 with default and salience networks. Sci. Rep. 2020;10:9137. doi: 10.1038/s41598-020-66100-y. [DOI] [PMC free article] [PubMed] [Google Scholar]
- 39.Rubinov M., Sporns O. Complex network measures of brain connectivity: Uses and interpretations. Neuroimage. 2010;52:1059–1069. doi: 10.1016/j.neuroimage.2009.10.003. [DOI] [PubMed] [Google Scholar]
- 40.Latora V., Marchiori M. Efficient behavior of small-world networks. Phys. Rev. Lett. 2001;87:198701. doi: 10.1103/PhysRevLett.87.198701. [DOI] [PubMed] [Google Scholar]


