

Abstract
Helichrysum species are prominent South African medicinal plants. From the essential oils (EOs) of three Helichrysum species, H. petiolare, H. odoratissimum, and H. cymosum, sixty-three constituent components were identified, with hydrocarbons and oxygenated monoterpenes and sesquiterpenes as major components. The compounds were analyzed by gas chromatography-mass spectrometry (GC-MS) and nuclear magnetic resonance (NMR) spectroscopy. In H. petiolare EO, the major components were faurinone (20.66%) and (E)-β-ocimene (17.21%). Faurinone was isolated from this EO for the first time. In H. odoratissimum, 1,8-cineole (17.44%) and α-pinene, and γ-curcumene (15.76%) were the major components whereas, in H. cymosum, α-pinene (29.82%) and (E)-caryophyllene (19.20%) were the major components. In the antibacterial activity study, the EOs were tested against Staphylococcus aureus, Escherichia coli, and Pseudomonas aeruginosa. The EOs were found to possess low antibacterial, anti-tyrosinase, and photoprotection activities and moderate antioxidant capacities, thus establishing these Helichrysum EOs as valuable antioxidant agents.
Keywords: essential oils, Helichrysum, H. petiolare, H. odoratissimum, H. cymosum, antioxidant, antibacterial, tyrosinase inhibition, sun protection factor
1. Introduction
Helichrysum Mill. is a large genus comprising over 600 species spread throughout Africa, Europe, North America, and Australia. Out of these, nearly 244–250 Helichrysum species occur in Southern Africa (including Namibia) with extensively varied morphologies [1,2]. Helichrysum species are popular materials in the traditional medicines of Europe, Asia, and Africa, where their herbal teas are used to treat fever, cough respiratory problems, digestive disorders, skin inflammation, and wounds [3,4,5].
Essential oils (EOs) and their volatile constituents have been important materials for preventing and treating human diseases for a long time [6]. Helichrysum EOs are well studied in the literature [7,8,9,10] and show promising biological potencies. H. italicum EO, also called “immortelle”, is already a renowned ingredient of cosmetics. It is said to promote blood flow in the skin, regenerate it, and help attenuate signs of aging such as fine lines and wrinkles [5].
As the ethnomedicinal records propose Helichrysum species as a skin remedy in the quest to explore the South African flora for novel cosmeceutical ingredients, H. petiolare, H. odoratissimum, and H. cymosum EOs were selected for phytochemical investigation. Table 1 summarizes the studies related to the EO’s of these Helichrysum species with regard to chemical composition and biological activity.
Table 1.
Review of previous studies on essential oils of the selected Helichrysum species under focus.
| Name | Locality | Studies on Essential Oils | References | ||
|---|---|---|---|---|---|
| Analysis Method | Major Components | Biological Tests | |||
| Helichrysum petiolare Hilliard and B.L.Burtt | SA | GC-MS | 1,8-Cineole (22.4%), (E)-caryophyllene (14.0%), p-cymene (9.8%) | Antimicrobial, antioxidant, and anti-inflammatory | Lourens et al. [1] |
| SA | GC-MS | Caryophyllenyl alcohol (36.42–45.26%), β-hydroagarofuran (19.45–25.64%), δ-cadinene (3.39–4.76%) | None | Giovanelli et al. [5]. | |
| Helichrysum cymosum (L.) D.Don subsp. cymosum | Tanzania | GC-MS | (E)-Caryophyllene (27.02%), caryophyllene oxide (7.65%), p-cymene (7.55%). | Antimicrobial | Bougatsos et al. [8]. |
| SA | GC-MS | 1,8-Cineole (20.4%), α-pinene (12.4%), (E)-caryophyllene (10.8%) | Antimicrobial and antimalarial and cytotoxic | Van Vuuren et al. [11]. | |
| SA | TLC and GC-MS | 1,8-Cineole (20.4–34.6%), (E)-caryophyllene (8.4–10.8%), α-pinene (3.6–12.4%). | Antimicrobial | Reddy [12]. | |
| Cameroon | GC-FID and GC-MS | δ-3-Carene (16.1%), (E)-caryophyllene (12.0%), camphene (7.4%). | Radical scavenging and antifungal | Tchoumbougnang et al. [13]. | |
| SA | GC-MS | (Z)-β-Ocimene (35.61–50.44%), (E)-caryophyllene (15.03–16.62%), α-humulene (5.28–8.68%). | None | Giovanelli et al. [5]. | |
| Helichrysum odoratissimum (L.) Sweet | Zimbabwe | GC-MS | α-Pinene (15.0%), α-humulene (13.0%), (E)-caryophyllene (9.6%). | None | Gundidza and Zwaving [14]. |
| SA | GC-MS | p-Menthone 35.4%, pelugone 34.2%, 1,8-cineole 13.0% (fresh plant material). | None | Asekun et al. [15]. | |
| SA | TLC and GC-MS | (E)-Caryophyllene (9.3–25.2%), limonene (11.6–19.6%), and 1,8-cineole (11.2–17.1%). | Antimicrobial | Reddy [12]. | |
| SA | GC-MS | Limonene (14.55%), 1.8-cineole (6.56%), α-pinene (4.20%). | Repellent and fumigation against maize weevil | Odeyemi et al. [16]. | |
| SA | GC-MS | β-Pinene (51.6%), limonene (16.9%), α-humulene (5.6%) | Antimicrobial and cytotoxic | Lawal et al. [17]. | |
| Uganda | GC-MS | Palmitic acid (27.1%), humulene (14.1%), (E)-caryophyllene (12.6%). | Antimicrobial | Ocheng et al. [18]. | |
| SA | GC-MS | α-Pinene (4.11–18.39%), (E)-caryophyllene (9.67–15.85%), 1,8-cineole (2.74–13.35%). | None | Giovanelli et al. [5]. | |
Additionally, as per the literature, these EOs have not been evaluated before for their antityrosinase activity (Table 1). Therefore, the present research aimed to elucidate the chemical composition of the essential oils of these three selected Helichrysum species, and biologically evaluate them for their antimicrobial, antioxidant, antityrosinase, and photoprotective activity.
2. Results and Discussion
2.1. Yield and Chemical Composition of the Helichrysum Essential Oils
The hydrodistilled plant materials of H. petiolare and H. cymosum were isolated as pale green and clear essential oils, respectively. H. petiolare had a higher essential oil yield of 0.25% (v/w) against 0.15% (v/w) for H. cymosum.
The Helichrysum essential oils were found to collectively contain high amounts of α-pinene up to 29.82% as in H. cymosum EO and 1,8-cineole up to 17.44% as in H. odoratissimum EO, as shown in Table 2. These compounds have previously been reported as major constituents in the GC-MS analyses of these Helichrysum species. α-Pinene has been reported in African H. odoratissimum EOs in amounts as high as 43.4% and 40.6–47.1% [19,20]. Lourens et al. [21] have reported 1,8-cineole (22.4%) as the major compound in H. petiolare from the plant collected in Pretoria. Reddy [12] found 1,8-cineole as the major compound in H. cymosum EO as 20.4–34.6%. In H. odoratissimum EO, 1,8-cineole compound has been found between 6.56 and 17.1% [5,12,15,16].
Table 2.
GC-MS analysis of the Helichrysum essential oils.
| Mass Spectral Matching | Composition (%) | Experimental RI | Literature RI | Identification | ||
|---|---|---|---|---|---|---|
| H. petiolare | H. odoratissimum | H. cymosum | ||||
| α-Pinene | 7.49 | 15.76 | 29.82 | 938 | 939 A | RI, MS |
| Camphene | - | 0.32 | 0.44 | 951 | 950 B | RI, MS |
| β-Pinene | 10.54 | 5.18 | 2.56 | 981 | 979 A | RI, MS |
| Myrcene | 0.50 | 0.41 | 0.78 | 993 | 990 A | RI, MS |
| α-Terpinene | - | 1.51 | 1.83 | 1017 | 1017 B | RI, MS |
| 1,8-Cineole | 9.87 | 17.44 | 15.13 | 1035 | 1032 B | RI, MS |
| (E)-β-ocimene | 17.21 | 0.42 | 8.24 | 1051 | 1050 A | RI, MS |
| β-Ocimene (undefined isomer) | 3.79 | - | 3.26 | 1057 | - | Wb MS |
| γ-Terpinene | 0.73 | 0.82 | 2.50 | 1063 | 1060 B | RI, MS |
| allo-Ocimene | 6.66 | - | 3.01 | 1136 | 1132 A | RI, MS |
| Borneol | - | - | 0.45 | 1164 | 1166 B | RI, MS |
| Terpinen-4-ol | 0.57 | 0.63 | 2.18 | 1176 | 1177 B | RI, MS |
| α-Terpineol | - | 5.51 | 0.82 | 1193 | 1190 B | RI, MS |
| Lavandulyl acetate | 0.99 | - | - | 1294 | 1290 A | RI, MS |
| Myrtenyl acetate | 0.41 | - | - | 1325 | 1326 A | RI, MS |
| α-Copaene | 0.65 | - | - | 1372 | 1376 B | RI, MS |
| Unknown | - | 1.13 | - | - | - | - |
| Lavandulyl propionate | 0.41 | - | - | 1384 | - | Match |
| Italicene | - | 3.24 | - | 1409 | 1402 B | RI, MS |
| (E)-Caryophyllene | - | 7.30 | 19.20 | 14.22 | 1420 B | RI, MS |
| α-Humulene | 3.01 | 2.06 | 0.83 | 1450 | 1453 B | RI, MS |
| Unknown | - | - | 0.36 | 1486 | - | - |
| γ-Curcumene | - | 15.76 | - | 1487 | 1481 B | RI, MS |
| Phenyl ethyl 2-methylbutanoate | 0.90 | - | - | 1488 | 1487 A | RI, MS |
| Ar-Curcumene | - | 7.63 | - | |||
| Unknown | 5.29 | 3.06 | - | 1499 | - | - |
| 7-epi-α-Selinene | - | - | 0.60 | 1510 | 1517 B | RI, MS |
| Sesquicineole | - | 2.75 | - | 1514 | 1516 A | RI, MS |
| Lavandulyl isovalerate | 1.28 | - | - | 1514 | 1509 A | RI, MS |
| δ-Cadinene | 2.05 | 1.13 | - | 1522 | 1523 B | RI, MS |
| Unknown | - | 0.54 | - | 1531 | - | - |
| α-Calacorene | 0.68 | 0.40 | - | 1539 | 1540 B | RI, MS |
| Faurinone | 20.66 | - | - | 1568 | - | MS, NMR |
| Caryophyllene oxide | - | 1.66 | 2.65 | 1578 | 1580 B | RI, MS |
| Viridiflorol | - | 0.45 | - | 1585 | 1591 B | RI, MS |
| Unknown | 0.43 | - | - | 1602 | - | - |
| Junenol | - | 0.59 | - | 1610 | 1618 A | RI, MS |
| Unknown | 1.93 | - | - | 1642 | - | - |
| Unknown | 0.62 | - | - | 1649 | - | - |
| Valeranone | 1.07 | - | - | 1666 | 1672 B | RI, MS |
| Monoterpene hydrocarbons: | 46.92 | 24.42 | 53.24 | |||
| Oxygenated monoterpenes: | 12.25 | 23.58 | 18.58 | |||
| Total monoterpenoids: | 59.17 | 48.00 | 71.82 | |||
| Sesquiterpene hydrocarbons: | 6.39 | 37.52 | 20.63 | |||
| Oxygenated sesquiterpenes: | 23.01 | 5.99 | 2.65 | |||
| Total sesquiterpenoids: | 29.40 | 43.51 | 23.28 | |||
| Diterpene hydrocarbons: | 0.60 | 0.72 | 3.09 | |||
| Phenylpropanoids: | 0.90 | 0.00 | 0.00 | |||
| Total identified: | 90.07 | 92.23 | 98.19 | |||
| Unidentified: | 8.27 | 4.73 | 1.82 | |||
| Total | 98.34 | 96.96 | 100.01 | |||
A = Adams [22]. B = Babushok et al. [23]. Wb = NIST Chemistry WebBook [24]. MS = In addition to RI, the MS of the analyzed compound matched with the MS of the compound in [22] and/or NIST Chemistry WebBook [24]. Wb MS = The MS of the analyzed compound matched with the compound listed in [24]. Match = no RI or MS available in the literature. The compound was reported solely based on the mass spectral match with NIST14 libraries reported by MassHunter software (Agilent Technologies, Inc., Santa Clara, CA, USA) (Probability < 0.04). Unknown = The MS of the compound could not be matched with the available literature data. U = Undefined. Higher n-paraffin needed.
H. odoratissimum and H. cymosum EOs both featured a high content of (E)-caryophyllene at 7.30% and 19.20%, respectively, as was previously identified in previous reports by Reddy [12] (9.3–25.2%), and Bougatsos et al. [8] (27.04%). (E)-β-ocimene found in high content in H. petiolare EO (17.21%) and H. cymosum EO (8.24%) was not identified in previous analysis reports of these two essential oils. In this study, γ-Curcumene was found to be present as a prominent constituent (15.76%) in H. odoratissimum EO, which is much higher than the percentage composition (2.15%) reported in an earlier report [16]; however, ar-curcumene, another dominant compound in this EO (7.63%), has also been reported in the Cameroonian H. odoratissimum EO in a higher content of 20.3% [19].
The major compound in H. petiolare essential oil (compound 1; RI = 1568) identified by GC-MS analysis was structurally elucidated as faurinone (Figure 1) through NMR and MS analyses. This sesquiterpene ketone has never been reported before in the essential oil of H. petiolare. The structural elucidation of compound 2 (RI = 1499) is also discussed further below.
Figure 1.
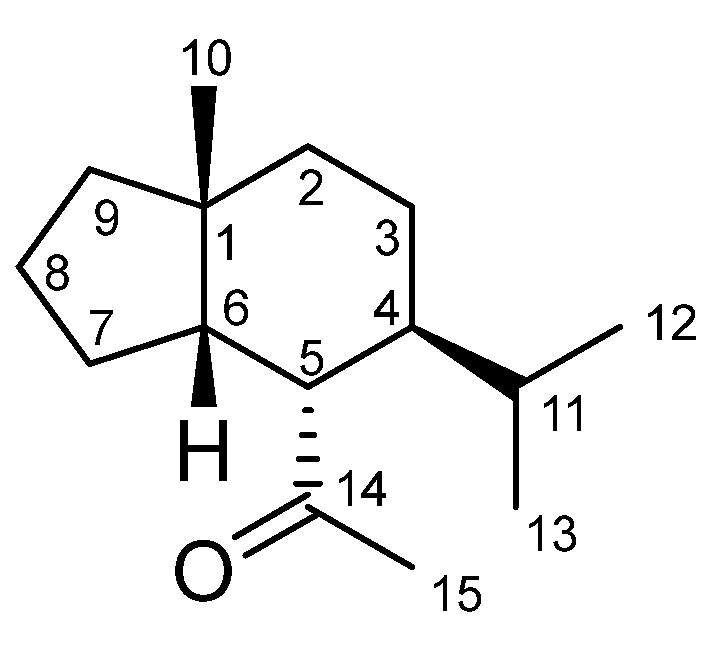
Chemical structure of faurinone.
2.2. Structural Elucidation of Compound 1
Compound 1 (5 mg) was identified as faurinone (Figure 1) by MS, 1H-NMR, and 13C-NMR spectroscopic techniques, and the spectroscopic data were compared with the previously published literature, as presented in the following sections.
2.2.1. Mass Spectrometry
The ion fragment peaks obtained in the MS spectrum (Figure 2) were compared to the data first reported by Hikino et al. [25]. The molecular ion [M+] at m/z = 222.3 suggested the molecular formula to be C15H26O, which translates to the three degrees of unsaturation as it is for faurinone. A base peak was found at m/z = 123.2, which is typical of isomers of faurinone as described by Weyerstahl et al. [26].
Figure 2.

Mass spectrum of faurinone.
2.2.2. 1H NMR Spectroscopy
The 1H NMR spectrum showed four methyl signals, and two of them appear at 0.74 ppm and 0.80 ppm (d, 6.2 Hz, Me-12, Me-13), and the other two methyl groups appear as singlets at 1.02 (Me-10) and 2.19 (Me-15); the latter is adjacent to a carbonyl group (C-14) (Figure 1). The spectrum also showed a proton resonating at 2.31 (ddd, 3.6, 10.7, 14.4 Hz) and assigned to H-4, and another proton at 1.95 (dd, 5.0, 10.7 Hz) and assigned to H-5, in addition to a cluster of protons between 1.92 and 0.80 ppm. The proton signals are summarized in Table 3.
Table 3.
Summary of identified protons in the 1H spectrum of faurinone.
| Title 1 | δ (ppm) Multiplicity (J = Hz) | |
|---|---|---|
| Experimental | Reported | |
| H-4 | 2.31 ddd (3.6, 10.7, 14.4) | tt * (10.4, 3.8) [27] |
| H-5 | 1.95 dd (10.7, 5.01) | dd * (10.4, 4.8) [27] |
| H-10 (Me) | 1.02 s | 1.03 s [25] |
| H-(12,13) (Me) | 0.74 d (6.12) 0.80 d (6.12) |
0.74 d (5) 0.81 d (5) [25] |
| H-15 (Me) | 2.19 s | 2.18 s [25] |
* chemical shifts were not reported.
2.2.3. 13C NMR Spectroscopy
The 13C NMR spectrum revealed fifteen carbons that were classified according to DEPT-135 into four methyls, five methylene, four methines, one fully substituted carbon, and a carbonyl group. The peak at δ 212.1 ppm indicated the presence of the carbonyl carbon (C-14) previously reported at δ 211.8 ppm [27]. The remaining peaks from δ 51.9 to 21.4 ppm were representative of typical saturated (sp3 hybridized) carbons unaffected by electronegative atoms, as found in the structure of faurinone. Besides the carbonyl carbon, the absent peak at δ 41.6 ppm in the DEPT-135 confirmed the presence of a quaternary carbon at position 1, as reported at the same ppm value by Bos et al. [27] and Weyerstahl et al. [26]. The typical shifts in the saturated carbons in the 13C NMR of compound 1 obtained experimentally were in close agreement with the reported values of faurinone [26]. The summary of the comparison with the literature on chemical shifts is presented in Table 4.
Table 4.
Experimental and literature values [27] of 13C NMR shifts (ppm) of faurinone.
| Carbon * | Multiplicity | Compound 1 | Faurinone |
|---|---|---|---|
| CH2 | t | 21.38 | 21.4 |
| C-12 | q | 22.23 | 22.2 |
| C-13 | q | 23.05 | 23.0 |
| CH2 | t | 26.54 | 26.5 |
| C-11 | d | 29.04 | 29.0 |
| C-15 | q | 29.34 | 29.2 |
| CH2 | t | 30.88 | 30.8 |
| CH2 | t | 32.35 | 32.4 |
| C-10 | q | 36.67 | 36.6 |
| C-1 | s | 41.60 | 41.6 |
| C-4 | d | 47.31 | 47.3 |
| C-5 | d | 49.31 | 49.3 |
| C-6 | d | 50.94 | 50.9 |
| C-14 | s | 212.10 | 211.8 |
* The methylene groups could not be assigned in this work.
2.3. Structural Elucidation of Compound 2
Compound 2 (RI = 1499) could not be fully identified. Weak signals obtained in NMR analysis did not permit complete analysis. However, its mass spectrum showed similarities with the published data. In the literature, compound 2 was identified as β-dihydroagarofuran (RI = 1499) in the essential oil of H. petiolare from South Africa as one of the major compounds (19.45–25.65%) by Giovanelli et al. [5]. The mass spectrum of compound 2 (Figure 3) shows similarity to that of β-dihydroagarofuran [22] with the molecular ion [M+] = 222.3, the base peak m/z = 207.3, and other peaks m/z = 189.2 and, m/z = 149.2.
Figure 3.

Mass spectrum of compound 2.
2.4. Antibacterial Activity: Minimum Inhibitory Concentration (MIC) Using the Broth Microdilution Method
Cutaneous infections pose global health problems [28]. Preventing and treating bacterial skin infections can necessitate topical antimicrobials, which may be an antibiotic. Theoretically, a topical antibiotic presents advantages over systemic administration such as delivering high concentrations of active ingredients to the affected site and less systemic toxicity [29]. The Helichrysum EOs were tested against three skin pathogenic bacteria, S. aureus, E. coli, and P. aeruginosa. The MICs of the EOs were taken as the lowest concentration inhibiting visible bacterial growth of strains tested, as detected by the INT (p-iodonitrotetrazolium chloride) reagent and expressed in mg/mL (presented in Table 5).
Table 5.
MICs (mg/mL) of Helichrysum EOs and control.
| Sample | Micro-Organisms | ||
|---|---|---|---|
| S. aureus | E. coli | P. aeruginosa | |
| H. petiolare | >25.6 | 12.8 | 12.8 |
| H. odoratissimum | 12.8 | 12.8 | 12.8 |
| H. cymosum | >25.6 | 12.8 | 12.8 |
| Ampicillin | <0.2 | <0.2 | R * |
* R = resistant.
The MICs of the Helichrysum EOs were found between 12.8 and 25.6 mg/mL, whereas the positive control ampicillin exhibited MIC values lower than 0.2 mg/mL (P. aeruginosa is resistant to ampicillin). Compared to the threshold MIC value of 2 mg/mL for EOs [30], the results indicate that the EOs possess poor antibacterial activities.
2.5. Antioxidant Capacities
The magnitude of antioxidative capacities of the Helichrysum essential oils was evaluated by four in vitro antioxidant capacity assays: 2,2-diphenyl-1-picrylhydrazyl (DPPH), 2,2′-Azino-bis(3-ethylbenzothiazoline-6-sulfonic acid) (ABTS), ferric reducing antioxidant power (FRAP), and oxygen radical absorbance capacity (ORAC) assays. The results are summarized in Table 6.
Table 6.
Antioxidant capacities of Helichrysum EOs in the DPPH, ABTS, FRAP, and ORAC assays.
| Sample | DPPH * | ABTS * | FRAP * | ORAC * | |||
|---|---|---|---|---|---|---|---|
| mg/mL | % RSA6 min ± SD | % RSA6 min ±SD | TEAC (μmol TE/L ± SD) | mg/mL | FRAP (μmol AAE/L ± SD) | ORAC (μmol TE/L± SD) | |
| H. petiolare | 2 | 14.41 ± 0.51 | 84.42 ± 0.43 | 9131.4 ± 45.5 | 2 | −750.5 ± 11.5 | 6587.3 ± 126.3 |
| 1 | 8.98 ± 0.40 | 77.96 ± 0.71 | 8445.9 ± 76.1 | ||||
| 0.5 | 5.29 ± 0.20 | 67.08 ±0.76 | 7281.7 ± 81.5 | ||||
| H. odoratissimum | 2 | 4.09 ± 0.95 | 60.74 ± 1.24 | 6603.8 ± 132.6 | 2 | 3026.6 ± 184.6 | 6624.8 ± 10.8 |
| 1 | 1.27 ± 0.43 | 46.72 ± 0.96 | 5103.8 ± 102.7 | ||||
| 0.5 | −0.57 ± 0.03 | 28.16 ± 0.84 | 3117.5 ± 89.5 | ||||
| H. cymosum | 2 | 5.58 ± 0.61 | 40.26 ± 0.33 | 4412.2 ± 35.7 | 2 | 897.4 ± 173.1 | 6549.7 ± 99.9 |
| 1 | 3.14 ± 0.00 | 23.69 ± 0.70 | 2639.6 ± 75.3 | ||||
| 0.5 | 1.58 ± 0.51 | 10.70 ± 0.22 | 1250.1 ±23.9 | ||||
| Trolox® | 2 | 94.94 ± 0.02 | - | - | - | - | - |
| 1 | 94.78 ± 0.06 | ||||||
| 0.5 | 94.45 ± 0.04 | ||||||
| Gallic acid | 2 | – | 97.97 ± 0.13 | 605,840 ± 27811.3 | 2 | 635,500 ± 4070.9 | – |
| 1 | 97.96 ± 0.16 | 355,740 ± 7127.6 | |||||
| 0.5 | 98.05 ± 0.03 | 195,220 ± 6241.5 | |||||
| EGCG ** | – | – | – | – | 2 | – | 26,904 ± 328.2 |
* Average values of triplicate measurements (n = 3); RSA: radical scavenging activity; SD = standard deviation; RSD = relative standard deviation; TE: Trolox® equivalent; AAE: ascorbic acid equivalent. ** EGCG: (-)-epigallocatechin gallate.
In the DPPH assay, the EOs were found to possess a very low percentage of radical scavenging activities (% RSA). The highest % RSA was exhibited by H. petiolare EO as 14.41 ± 0.51% at 2 mg/mL against 94.94 ± 0.02% for Trolox® positive control at the same concentration. In the ABTS assay, H. petiolare EO exhibited the highest antioxidant capacity with 84.42 ± 0.43% and 9131.4 ± 45.5 μmol TE/L at 2 mg/mL. The % RSA was close to that of the gallic acid positive control, found as 97.97 ± 0.13% at the same concentration. In the FRAP and ORAC assays, H. odoratissimum EO was found to exhibit the highest antioxidant capacities at 2 mg/mL with 3026.6 ± 184.6 μmol AAE/L and 6624.8 ± 10.8 μmol TE/L, respectively. In these two assays, the positive controls exhibited 10- and 100-fold higher capacities than the highest-performing essential oil. Additionally, H. petiolare EO was found inactive in the FRAP assay with an equivalence value of −750.5 ± 11.5 μmol AAE/L, whereas H. cymosum EO was the second-best performing EO in the assay (897.4 ± 173.1 μmol AAE/L). Overall, using the reference controls as benchmarks, the results suggest that the EOs possess low-to-moderate antioxidant capacities.
2.6. Tyrosinase Inhibition
Tyrosinase (EC 1.14.18.1), also known as polyphenol oxidase, is a copper-containing enzyme that has a central role in the production of melanin, the pigment responsible for the color of the skin. It catalyzes the first two steps of the multiphase process of melanogenesis, the biosynthesis of melanin. As tyrosinase inhibitors are increasingly prevalent in cosmeceuticals aiming to reduce hyperpigmentation [31], it is important to investigate EOs as natural options in this regard. In the present work, the selected essential oils were tested in the tyrosinase inhibition assay exploring the monophenolase activity of the enzyme by monitoring the absorbance of L-DOPA (λ490 nm) using L-tyrosine as a substrate. The essential oils were tested at 200 μg/mL and 50 μg/mL and compared to kojic acid, a standard tyrosinase inhibitor used in cosmetics, at the same concentrations. The results were obtained, as presented in Table 7.
Table 7.
Summary of the tyrosinase inhibition assay results for the Helichrysum EOs at 200 μg/mL and 50 μg/mL.
| Samples | Tyrosinase Inhibition (%) | |
|---|---|---|
| at 200 μg/mL | at 50 μg/mL | |
| H. petiolare | 62.66 ± 11.96 | 22.22 ± 1.46 |
| H. odoratissimum | 63.30 ± 2.35 | 28.62 ± 0.30 |
| H. cymosum | 61.59 ± 10.45 | 25.42 ± 1.80 |
| Kojic acid | 96.24 ± 3.62 | 98.34 ± 0.80 |
Overall, the EOs exhibited significantly lower tyrosinase inhibition values than kojic acid at 200 and 50 μg/mL. At both concentrations, the EOs performed near equally in the range of 61.59 ± 10.45 to 63.30 ± 2.35% at 200 μg/mL and 22.22 ± 1.46 to 28.62 ± 0.30% at 50 μg/mL, whereas kojic acid was found as 96.24 ± 3.62% and 98.34 ± 0.80% μg/mL at respective concentrations. Since the enzyme inhibition is concentration dependent, the values obtained indicate that collectively the Helichrysum EOs are relatively weak tyrosinase inhibitors.
2.7. Sun Protection Factor (SPF)
Solar UV rays are the protagonists in external cutaneous aging in humans and provoke a myriad of dermatological complications including skin cancer [32,33,34,35]. Herein, the SPF values of the Helichrysum essential oils were determined by measuring the absorbance of dilute hydroalcoholic solutions of EOs (0.1% v/v) at 290–320 nm at 5 nm intervals then calculated using the equation given by Mansur et al. [36]. The results are presented in Table 8.
Table 8.
Spectrophotometric absorbances of hydroalcoholic aliquots of the Helichrysum essential oils and their calculated SPF.
| Wavelength (nm) | EE(λ) × I(λ) ** Employed | Absorbance * | ||
|---|---|---|---|---|
| H. petiolare EO | H. odoratissimum EO | H. cymosum EO | ||
| 290 | 0.0150 | 0.2999 ± 0.0060 | 0.0632 ± 0.0020 | 0.2955 ± 0.0054 |
| 295 | 0.0817 | 0.2813 ± 0.0079 | 0.0436 ± 0.0048 | 0.2244 ± 0.0085 |
| 300 | 0.2874 | 0.2129 ± 0.0165 | 0.0354 ± 0.0024 | 0.1259 ± 0.0063 |
| 305 | 0.3278 | 0.1290 ± 0.0112 | 0.0283 ± 0.0011 | 0.0746 ± 0.0038 |
| 310 | 0.1864 | 0.0796 ± 0.0070 | 0.0250 ± 0.0015 | 0.0478 ± 0.0024 |
| 315 | 0.0837 | 0.0548 ± 0.0057 | 0.0235 ± 0.0005 | 0.0342 ± 0.0015 |
| 320 | 0.0180 | 0.0384 ± 0.0036 | 0.0208 ± 0.0010 | 0.0254 ± 0.0010 |
| Calculated SPF | 1.511 | 0.309 | 0.956 | |
* Values represent mean absorbance values ± standard deviation of triplicate measurements, n = 3; ** constant values of erythemogenic effect (EE) of radiation with wavelength λ × solar intensity (I) at wavelength λ determined by Sayre et al. [37].
According to the study, the SPF of the essential oils was found to be 1.511, 0.956, and 0.309, for H. petiolare, H. cymosum, and H. odoratissimum Eos, respectively. As compared to the previously reported threshold SPF value of 2 [38,39], the results may not establish these Helichrysum EOs noteworthy for sunscreen formulations.
3. Materials and Methods
3.1. Plant Material
Two out of the three species studied, H. petiolare (6.0 kg) and H. cymosum (3.5 kg), were wildly harvested from the University of the Western Cape campus in December 2018. Their voucher specimens were authenticated by Hlokane Mabela and deposited at the Horticultural Sciences Department of the Cape Peninsula University of Technology. The essential oil of H. odoratissimum was purchased directly from a local South African establishment (Pure Indigenous [Indigo Trading] African Helichrysum, 100% Organic Essential Oil).
3.2. Extraction of Essential Oil
The fresh aerial parts (leaves, stems, and flowers) of the plants were subjected to hydrodistillation using the Clevenger-type apparatus for 3 h as per the European Pharmacopeia guidelines [40]. The essential oil was recovered by decantation in glass vials and stored in the dark at 4 °C until further use. The oil yield was expressed as the average percentage of volume in mL per weight in g (% v/w) of triplicate analyses.
3.3. Gas Chromatography-Mass Spectrometry (GC-MS) Analysis
The GC-MS analyses were carried out according to the procedure previously reported by Kuiate et al. [19] with some adjustments. The instrument consisted of an Agilent GC-7820A fitted with an HP-5MS fused silica column (30 m × 0.25 mm i.d. × 0.25 μm film thickness) and coupled with an Agilent 5977E mass selective compartment (Agilent Technologies, Inc. USA). The oven temperature was programmed at 50 °C for 5 min, 50–220 °C at a rate of 2 °C·min−1 then 220 °C temperature hold for 5 min for the first ramp. For the second ramp, the temperature was set to 300 °C at a rate of 25 °C·min−1. Helium was used as a carrier gas at 1 mL.min−1 flow rate and pressure of 7.6522 psi. Sample injection of 1 μL of 1% (v/v) solution diluted in n-hexane was splitless and operated at 250 °C. A reference standard of homologous n-paraffin series of C8-C20 (Sigma-Aldrich®, Cat no. 04070) was prepared and co-injected under identical experimental conditions as those for samples for the determination of retention indices (RIs). The MS spectra were obtained on electron impact at 70 eV scanning from 30.0 to 650 m/z.
The identification of the constituents was achieved by computerized matching (MassHunter software, Agilent Technologies, Inc., Santa Clara, USA) of each mass spectrum generated with those stored in the instrument’s built-in mass spectral libraries (National Institute of Standards and Technologies, NIST), then by comparing the experimental RIs [41] and generated mass spectra with those of the NIST online data collection [24] and the literature [22,23]. The relative amounts of individual constituents were calculated automatically based on the total ion count detected by the GC-MS and expressed as percentage composition.
3.4. Isolation and Purification of H. Petiolare Essential Oil’s Components
A silica slurry of 3.547 g of H. petiolare EO was packed in a silica gel column (40 cm × 4 cm). The separation was performed using a gradient elution of hexane: ethyl acetate (Hex: EA) in order of increasing polarity from 100:0 to 94:6 (Hex: EA). The separation yielded 53 fractions (20–50 mL) labeled as 1–53 which were further concentrated at 45 °C.
Fraction 29 was subjected to preparative thin-layer chromatography (prep TLC) to purify compound 1. Fraction 29 (20 mg) was dissolved in 750 μL of hexane then 250 μL was loaded on three individual silica gel 60 F254 TLC plates (20 cm × 10 cm; Merck, Germany). Subsequently, the plates were developed at 97:3 hexane: ethyl acetate (double run). Compound 1 was marked under λ254 nm, scrapped off, and eluted with hexane. Compound 2 was purified from fraction 31 by prep TLC at 92:8 hexane: ethyl acetate (double run) as previously described.
The MS spectra of compound 1 and compound 2 were obtained by dissolving 0.5 mg in 300 μL of hexane and analyzing the samples by the method previously described. Their 1H NMR and 13C NMR spectra were recorded at 20 °C using deuterated chloroform on a Bruker Avance™ 400 MHz spectrometer (Germany). The chemical shifts of 1H and 13C in ppm (δ) were determined with tetramethylsilane (TMS) used as an internal reference.
3.5. Antibacterial Assay
3.5.1. Micro-Organisms
The essential oils were tested against three skin pathogenic bacterial strains. These were one Gram-positive strain, wild-type (WT) S. aureus, and two Gram-negative strains, wild-type (WT) E. coli and wild-type (WT) P. aeruginosa.
3.5.2. Preparation of Media
The bacterial species were resuscitated by inoculation into brain heart infusion (BHI) broth (Oxoid UK, Cat. no. CM1135) and incubated at 37 °C for 24 h, after which, each strain was streaked aseptically onto tryptone soya agar for a single colony formation and incubated at 37 °C for 24 h. The cell suspensions were performed in sterile saline, standardized at 0.5 McFarland standard (Remel™, Kansas, Cat. no. R20410) at 1.5 × 10⁸ colony forming units (CFU)/mL. Then, the working suspensions were obtained by a second 1:100 dilution onto BHI to approximately 106 CFU/mL.
3.5.3. Broth Microdilution Susceptibility Assay
The broth microdilution test was performed, as previously described by Lourens et al. [21] and Sartoratto et al. [42] with slight adjustments. An EO stock solution of 51.2 mg/mL was prepared with a BHI:dimethyl sulphoxide (DMSO) (1:1) solution. In a 96-well plate, 100 μL of BHI was added to the experimental wells in triplicate except in well 1. Then, 200 μL of EO stock solution was added to well 1, from which a serial dilution was performed to the last experimental well. Subsequently, 100 μL of cell suspension was added to establish the two-fold 25.6–0.2 mg/mL sample concentration range and a bacterial cell suspension of approximately 5 × 10⁵ CFU/mL. The plate was incubated at 37 °C for 20 h. After incubation, the antimicrobial activity was detected by adding 40 μL of 0.2 mg/mL INT (Sigma-Aldrich®, Cat no. I10406) aqueous solution. The plates were incubated at 37 °C for 1 h. The MICs were defined as the lowest concentration of essential oil that inhibited visible growth, as indicated by the color change of INT. Ampicillin (Sigma-Aldrich®, Cat No. A9393) was used as a positive control.
3.6. Antioxidant Capacity Assays
3.6.1. 2,2-diphenyl-1-picrylhydrazyl (DPPH) Assay
The DPPH assay was performed according to the method previously described by Bondet et al. [43] with slight modifications. In a clear 96-well plate, 275 μL of DPPH reagent (Sigma-Aldrich®, Cat no. D9132) (absorbance of 2.0 ± 0.1 at 517 nm) was added to 25 μL of EO sample and Trolox® (Sigma-Aldrich®, Cat no. 238831) positive control (2.0, 1.0, and 0.5 mg/mL). For the blank, ethanol was added instead of the sample. The total volume of the assay was 300 μL. The absorbance was read at 517 nm and 37 °C at the 6 min time point. The EO/Trolox® sample was read in triplicate (n = 3). The % RSA of the samples was calculated using Equation (1).
| (1) |
where Asample is the absorbance signal of the EO sample and Ablank is the absorbance signal of the DPPH solution (ethanol in place of the sample) at 517 nm and 6 min. The results were expressed as the mean percentage of triplicate measurements (± standard deviation, SD).
3.6.2. 2,2′-Azino-bis(3-ethylbenzothiazoline-6-sulfonic Acid) (ABTS) Assay
The ABTS assay was performed according to Re et al. [44] with slight modifications. The ABTS radical cation (ABTS•+) (Sigma-Aldrich®, Cat no. A1888) stock reagent was produced by reacting 5 mL of freshly prepared 7 mM ABTS solution with 88 μL of a freshly prepared 140 μM K2S2O8 (Merck, Cat no. 105091) then allowing the mixture to sit overnight for 16 h in the dark at room temperature. In a clear 96-well plate, 275 μL of ABTS•+ reagent (absorbance of 2.0 ± 0.1 at 734 nm) was added to 25 μL of each ethanolic Trolox® working standard (50 μM, 100 μM, 150 μM, 250 μM, and 500 μM) and EO sample (2.0, 1.0, and 0.5 mg/mL). Gallic acid (Sigma-Aldrich®, Cat No. G7384) was used as a positive control. For the blank, ethanol was added instead of the sample. The total volume of the assay was 300 μL. The absorbance was read at 734 nm and 37 °C at the 6 min time point. The EO sample, working standard, and gallic acid sample were read in triplicate (n = 3). The % RSA of each EO or positive control working solution was calculated using Equation (1), where Asample is the absorbance signal of the EO sample/positive control and Ablank is the absorbance signal of the ABTS•+ solution (ethanol in place of the sample) at 734 nm. The results were expressed as the mean percentage of triplicate measurements (± standard deviation, SD). The Trolox® equivalent capacity assay (TEAC) values were reduced from the linear regression (R2 = 0.9980) of Trolox® concentrations (μM) and the absorbance readings at 734 nm at 6 min and expressed as mean (±SD) of triplicate measurements in μmol Trolox® equivalents per litre of the sample tested (μmol TE/L).
3.6.3. Oxygen Radical Absorbance Capacity (ORAC) Assay
The ORAC assay was performed according to the method described by Prior et al. [45] with slight modifications. In a black 96-well plate, 12 µL of the Trolox® working solutions (83 µM, 167 µM, 250 µM, 333 µM, and 417 µM were prepared with phosphate buffer at pH 7.4) and EO sample (2.0 mg/mL) were added in triplicate (n = 3). Subsequently, 138 µL of fluorescein solution was added followed by 50 µL of freshly prepared by dissolving 2,2’-Azobis (2-methylpropionamidine) dihydrochloride (AAPH) (Sigma-Aldrich®, Cat no. 440914) in phosphate buffer (150 mg of AAPH in 6 mL buffer). (-)-Epigallocatechin gallate (EGCG) (Sigma-Aldrich®, Cat no. E4143) was used as a positive control. For the blank, the phosphate buffer was added in place of the sample. The total volume of the assay was 200 µL and the temperature was set at 37 °C. Readings of the EO/EGCG samples (2.0 mg/mL) and Trolox® working standard solutions were taken using the excitation wavelength set at 485 nm and the emission wavelength at 530 nm for 2 h at 1 min reading interval. After analysis, the data points of the blank, EO sample, EGCG sample, and Trolox® working standards were summed up over time to obtain the area under the fluorescence decay curve (AUC). The ORAC values were calculated using the linear regression (R2 = 0.9861) equation (Y = aX + c) between Trolox® concentration (Y) (μM) and the net area (blank-corrected) under the fluorescence decay curve (X). The results were expressed as the mean (±SD) of triplicate measurements in μmol of Trolox® equivalents per litre of the sample tested (μmol TE/L).
3.6.4. Ferric Reducing Antioxidant Power (FRAP) Assay
The FRAP assay was conducted as recommended by Benzie and Strain [46] with slight adjustments. Firstly, the fresh blue FRAP reagent was prepared by mixing 30 mL of acetate buffer, 3 mL of 2,4,6-tris [2-pyridyl]-s-triazine (TPTZ) (Merck, Cat no. T1253) with 3 mL of FeCl3 solution and 6.6 mL of distilled water. Then, an L-ascorbic acid (Sigma-Aldrich®, Cat no. A5960) standard series of 50 μM, 100 μM, 200 μM, 500 μM, and 1000 μM was prepared from a 1 mM of L-ascorbic acid stock solution in distilled water. Lastly, in a clear 96-well plate, 300 μL of the FRAP reagent was added to 10 μL of L-ascorbic acid working standard solutions and EO sample (2.0 mg/mL) in triplicate (n = 3). Gallic acid was used as a positive control. For the blank, the phosphate buffer (pH 3.6) was added instead of the sample. The total volume of the assay was 310 μL. The absorbance of TPTZ-Fe (II) in the samples was read at 593 nm at 37 °C for 30 min. The results were calculated using the linear regression (R2 = 0.9965) of the L-ascorbic acid (AA) standard series concentrations (μM) and absorbance signals expressed as mean (±SD) of triplicate measurements in μmol L-ascorbic acid equivalents per litre of the sample tested (μmol AAE/L).
3.7. Anti-Tyrosinase Assays
3.7.1. Essential Oil Samples and Positive Control Preparation
EO working solution (10 mg/mL) was prepared with a DMSO: Tween®20 (1:1) solution to facilitate dispersion of the oils which was further diluted to 1 mg/mL working solution with methanol. A 10 mg/mL kojic acid working solution was made up of 100% DMSO and then diluted to 1 mg/mL with methanol.
3.7.2. Tyrosinase Inhibition Assays
The tyrosinase inhibition assay was performed as described previously by Popoola et al. [47] and Cui et al. [48] with slight modifications. The concentrations of the EO sample and kojic acid chosen, 200 μg/mL and 50 μg/mL, respectively, were achieved by setting up the 96-well plate in the following order: 70 μL of the sample (1 mg/mL) then 30 μL of tyrosinase enzyme (500 U/mL). Each concentration of the sample and positive control was set up in two different wells whereby, one of the wells received enzyme and the other well had no enzyme volume added. All volume deficits were compensated by adding excess buffer. The negative controls, 10% v/v of 1:1 DMSO: Tween®20 in methanol for the EO and 10% v/v DMSO in methanol for kojic acid were treated the same way. The plate was incubated at 37 °C (±2.0 °C) for 5 min. Thereafter, the reaction was initiated by adding 110 μL of L-tyrosine (2 mM) and subsequently incubated at 37 °C (± 2.0 °C) for 30 min. The absorbance of L-DOPA was read at 490 nm on a Multiskan™ spectrum plate reader (Thermo Fisher Scientific, Waltham, MA, USA). Two independent experiments were carried out in triplicate and the percentage of tyrosinase inhibition was calculated using Equation (2).
| (2) |
where A is the negative control with an enzyme, B is the negative control without enzyme, C is the EO sample or kojic acid with enzyme and D is the EO sample or kojic acid without enzyme. The inhibition percentages were expressed as the mean (± standard deviation) of duplicate measurements. One-way ANOVA was used to compare the absorbance values of the two groups (p < 0.05).
3.8. Sun Protection Factor (SPF)
The protocol used for this assay was conducted as per Kaur and Saraf [49]. The solubility of the EO in different ratios of ethanol and water was tested by taking 10% to 50% of ethanol in distilled water. The maximum solubility was detected at ethanol: water in a 40:60 ratio, above which turbidity developed. Thereafter, an initial stock solution of 1% v/v was prepared by making up 10 µL of the EO to 1 mL of ethanol:water (40:60). Then, out of this stock, 0.1% v/v in 40:60 ethanol: water was prepared. Subsequently, 100 µL of the EO aliquot and the blank (ethanol: water, 40:60) were injected into the 96-well plate and read in triplicate (n = 3) over the 290 nm-320 nm range at a 5 nm interval. The SPF value of the essential oil was calculated following the method by Mansur et al. [36]. The mean of the observed absorbance values was multiplied by their respective erythemogenic effect (EE) times solar intensity at wavelength λ values, EE (λ) × I (λ), then their summation was obtained and multiplied with the correction factor (=10). The calculation is described as Equation (3).
| (3) |
where CF is the correction factor (=10), EE (λ) is the erythemogenic effect of radiation at wavelength λ, I (λ) is the solar intensity at wavelength λ, and Abs (λ) represents the spectrometric absorbance value at wavelength λ. The values of EE (λ) × I (λ) are constant values that were determined by Sayre et al. [37], as shown in Table 9.
Table 9.
Relationship between erythemogenic effect and radiation intensity.
| Wavelength (nm) | EE × I (Normalized) |
|---|---|
| 290 | 0.0150 |
| 295 | 0.0817 |
| 300 | 0.2874 |
| 305 | 0.3278 |
| 310 | 0.1864 |
| 315 | 0.0837 |
| 320 | 0.0180 |
| Total | 1 |
4. Conclusions
The present work aimed to investigate the chemical composition of three South African Helichrysum essential oils and to explore their biological activities in the quest to find medicated fragrant ingredients to be used in cosmetic formulations. The GC-MS and NMR analyses revealed that their major constituents were hydrocarbons and oxygenated monoterpenes (α-pinene, 29.82% in H. cymosum; 1,8-cineole, 17.44% in H. odoratissimum) and oxygenated sesquiterpenes (faurinone, 20.66% in H. petiolare). This is the first report elucidating faurinone in the essential oil of H. petiolare. The EOs of all the three reported species of Helichrysum in this study had α-pinene and 1,8-cineole in common and as one of the major phytoconstituents. α-pinene and 1,8-cineole are associated with pharmacological activities such as antimicrobial, antioxidant, and antitumor effects. However, the biological evaluation of these EOs did not correspond to the reported pharamacological activities of these phytoconstituents. This investigation reiterates the fact that the bioactive functional property of a natural product such as essential oil cannot be linked to a single compound or a group of compounds; rather, it can be a result of the concerted effect of many secondary metabolites. Among the in vitro biological activities, this study is the first to report tyrosinase inhibition and sun protection factor of these Helichrysum essential oils. According to the results obtained, the essential oils possessed low antibacterial, anti-tyrosinase activities and photoprotection but moderately promising antioxidant capacities. This study establishes that H. petiolare, H. odoratissimum, and H. cymosum essential oils have great potential to complement antioxidant formulations.
Acknowledgments
Thanks to Hlokane Mabela of the Horticultural Sciences Department of the Cape Peninsula University of Technology for identification of plants.
Author Contributions
All the authors have participated and contributed substantially to this manuscript. S.O.A.: methodology, investigation, data curation, writing the original draft. R.S.: supervision, validation, Writing—Review and editing. C.W.J.A.: methodology, validation, resources-biology-antioxidants. J.L.M.: methodology, validation, resources-biology-antioxidants. A.A.H.: conceptualization, methodology, supervision, resources, Writing—Review and editing. All authors have read and agreed to the published version of the manuscript.
Institutional Review Board Statement
Not applicable.
Informed Consent Statement
Not applicable.
Data Availability Statement
The data supporting reported results can be found at https://etd.cput.ac.za/handle/20.500.11838/3340?mode=simple (accessed on 30 September 2022).
Conflicts of Interest
The authors declare no conflict of interest.
Funding Statement
This study was supported by National Research Foundation, South Africa (grant number 106055), and “The APC was funded by the Cape Peninsula University of Technology”.
Footnotes
Publisher’s Note: MDPI stays neutral with regard to jurisdictional claims in published maps and institutional affiliations.
References
- 1.Lourens A.C.U., Viljoen A.M., Van Heerden F.R. South African Helichrysum species: A review of the traditional uses, biological activity and phytochemistry. J. Ethnopharmacol. 2008;119:630–652. doi: 10.1016/j.jep.2008.06.011. [DOI] [PubMed] [Google Scholar]
- 2.Hassine D.B., Khlifi D., Ferhout H., Raoelison E.G., Bouajila J. Curry plant (Helichrysum sp.) oils. In: Preedy V.R., editor. Essential Oils in Food Preservation, Flavor and Safety. Academic Press; San Diego, CA, USA: 2016. pp. 395–403. [Google Scholar]
- 3.Scott G., Springfield E.P., Coldrey N. A pharmacognostical study of 26 South African plant species used as traditional medicines. Pharm Biol. 2004;42:186–213. doi: 10.1080/13880200490514032. [DOI] [Google Scholar]
- 4.Lall N., Kishore N. Are plants used for skin care in South Africa fully explored? J. Ethnopharmacol. 2014;153:61–84. doi: 10.1016/j.jep.2014.02.021. [DOI] [PubMed] [Google Scholar]
- 5.Giovanelli S., De Leo M., Cervelli C., Ruffoni B., Ciccarelli D., Pistelli L. Essential oil composition and volatile profile of seven Helichrysum species grown in Italy. Chem. Biodivers. 2018;15:e1700545. doi: 10.1002/cbdv.201700545. [DOI] [PubMed] [Google Scholar]
- 6.Properzi A., Angelini P., Bertuzzi G., Venanzoni R. Some biological activities of essential oils. Med. Aromat. Plants. 2013;2:136. [Google Scholar]
- 7.Tsoukatou M., Roussis V., Chinou L., Petrakis P.V., Ortiz A. Chemical composition of the essential oils and headspace samples of two Helichrysum species occurring in Spain. J. Essent. Oil Res. 1999;11:511–516. doi: 10.1080/10412905.1999.9701198. [DOI] [Google Scholar]
- 8.Bougatsos C., Meyer J.J.M., Magiatis P., Vagias C., Chinou I.B. Composition and antimicrobial activity of the essential oils of Helichrysum kraussii Sch. Bip. and H. rugulosum Less. from South Africa. Flavour Fragr. J. 2003;18:48–51. doi: 10.1002/ffj.1152. [DOI] [Google Scholar]
- 9.Rančić A., Soković M., Vukojević J., Simić A., Marin P., Duletić-Laušević S., Djoković D. Chemical composition and antimicrobial activities of essential oils of Myrrhis odorata (L.) Scop, Hypericum perforatum L. and Helichrysum arenarium (L.) Moench. J. Essent. Oil Res. 2005;17:341–345. doi: 10.1080/10412905.2005.9698925. [DOI] [Google Scholar]
- 10.Han X., Beaumont C., Stevens N. Chemical composition analysis and in vitro biological activities of ten essential oils in human skin cells. Biochim. Open. 2017;5:1–7. doi: 10.1016/j.biopen.2017.04.001. [DOI] [PMC free article] [PubMed] [Google Scholar]
- 11.Van Vuuren S.F., Viljoen A.M., Van Zyl R.L., Van Heerden F.R., Başer K.H.C. The antimicrobial, antimalarial and toxicity profiles of helihumulone, leaf essential oil and extracts of Helichrysum cymosum (L.) D. Don subsp. cymosum. S. Afr. J. Bot. 2006;72:287–290. doi: 10.1016/j.sajb.2005.07.007. [DOI] [Google Scholar]
- 12.Reddy D. Master’s Thesis. University of the Witwatersrand; Johannesburg, South Africa: 2007. The Phytochemistry and Antimicrobial Activity of Selected Indigenous Helichrysum Species. [Google Scholar]
- 13.Franccedil T., Lambert S.M., Michel J.D.P., Gaby N.M.E., Fabrice F.B., Zaché N., Henri A.Z.P., Chantal M. Composition, radical scavenging and antifungal activities of essential oils from 3 Helichrysum species growing in Cameroon against Penicillium oxalicum a yam rot fungi. Afr. J. Agric. Res. 2010;4:121–127. [Google Scholar]
- 14.Gundidza M.G., Zwaving J.H. The chemical composition of the essential leaf oil of Helichrysum odoratissimum Sweet from Zimbabwe. J. Essent. Oil Res. 1993;5:341–343. doi: 10.1080/10412905.1993.9698235. [DOI] [Google Scholar]
- 15.Asekun O.T., Grierson D.S., Afolayan A.J. Characterization of essential oils from Helichrysum odoratissimum using different drying methods. J. Appl. Sci. 2007;7:1005–1008. doi: 10.3923/jas.2007.1005.1008. [DOI] [Google Scholar]
- 16.Odeyemi O.O., Masika P., Afolayan A.J. Evaluation of the activities of five essential oils against the stored maize weevil. Nat. Prod. Commun. 2008;3:1097–1102. doi: 10.1177/1934578X0800300712. [DOI] [Google Scholar]
- 17.Lawal O.A., Ogunwande I.A., Kasali A.A., Opoku A.R., Oyedeji A.O. Chemical composition, antibacterial and cytotoxic activities of essential oil from the leaves of Helichrysum odoratissimum grown in South Africa. J. Essent. Oil Bear. Pl. 2015;18:236–241. doi: 10.1080/0972060X.2014.901618. [DOI] [Google Scholar]
- 18.Ocheng F., Bwanga F., Joloba M., Softrata A., Azeem M., Pütsep K., Borg-Karlson A.K., Obua C., Gustafsson A. Essential oils from Ugandan aromatic medicinal plants: Chemical composition and growth inhibitory effects on oral pathogens. Evid. Based Complement. Altern. Med. 2015;2015:230832. doi: 10.1155/2015/230832. [DOI] [PMC free article] [PubMed] [Google Scholar]
- 19.Kuiate J.R., Amvam Zollo P.H., Nguefa E.H., Bessière J.M., Lamaty G., Menut C. Composition of the essential oils from the leaves of Microglossa pyrifolia (Lam.) O. Kuntze and Helichrysum odoratissimum (L.) Less. growing in Cameroon. Flavour Fragr. J. 1999;14:82–84. doi: 10.1002/(SICI)1099-1026(199903/04)14:2<82::AID-FFJ780>3.0.CO;2-Z. [DOI] [Google Scholar]
- 20.Lwande W., Hassanali A., Wanyama O.B., Ngola S., Mwangi J.W. Constituents of the Essential Oil of Helichrysum odoratissimum (L.) Less. J. Essent. Oil Res. 1993;5:93–95. doi: 10.1080/10412905.1993.9698178. [DOI] [Google Scholar]
- 21.Lourens A.C.U., Reddy D., Başer K.H.C., Viljoen A.M., Van Vuuren S.F. In vitro biological activity and essential oil composition of four indigenous South African Helichrysum species. J. Ethnopharmacol. 2004;95:253–258. doi: 10.1016/j.jep.2004.07.027. [DOI] [PubMed] [Google Scholar]
- 22.Adams R.P. Identification of Essential Oil Components by Gas Chromatography/Mass Spectrometry. 4th ed. Allured Publishing Corp.; Carol Stream, IL, USA: 2007. [Google Scholar]
- 23.Babushok V.I., Linstrom P.J., Zenkevich I.G. Retention indices for frequently reported compounds of plant essential oils. J. Phys. Chem. Ref. Data. 2011;40:043101. doi: 10.1063/1.3653552. [DOI] [Google Scholar]
- 24.National Institute of Standards and Technologies. [(accessed on 16 October 2019)]; Available online: https://webbook.nist.gov/chemistry/name-ser/
- 25.Hikino H., Hikino Y., Agatsuma K., Takemoto T. Structure and absolute configuration of faurinone. Chem. Pharm. Bull. 1968;16:1779–1783. doi: 10.1248/cpb.16.1779. [DOI] [Google Scholar]
- 26.Weyerstahl P., Marschall H., Thefeld K., Subba G.C. Constituents of the essential oil from the rhizomes of Hedychium gardnerianum Roscoe. Flavour Fragr. J. 1998;13:377–388. doi: 10.1002/(SICI)1099-1026(199811/12)13:6<377::AID-FFJ755>3.0.CO;2-F. [DOI] [Google Scholar]
- 27.Bos R., Hendriks H., Kloosterman J., Sipma G. A structure of faurinone, a sesquiterpene ketone isolated from Valeriana officinalis. Phytochemistry. 1983;22:1505–1506. doi: 10.1016/S0031-9422(00)84048-0. [DOI] [Google Scholar]
- 28.Orchard A., van Vuuren S. Commercial essential oils as potential antimicrobials to treat skin diseases. Evid. Based Complementary Altern. Med. 2017;2017:4517971. doi: 10.1155/2017/4517971. [DOI] [PMC free article] [PubMed] [Google Scholar]
- 29.Williamson D.A., Carter G.P., Howden B.P. Current and emerging topical antibacterials and antiseptics: Agents, action, and resistance patterns. Clin. Microbiol. Rev. 2017;30:827–860. doi: 10.1128/CMR.00112-16. [DOI] [PMC free article] [PubMed] [Google Scholar]
- 30.Van Vuuren S.F. Antimicrobial activity of South African medicinal plants. J. Ethnopharmacol. 2008;119:462–472. doi: 10.1016/j.jep.2008.05.038. [DOI] [PubMed] [Google Scholar]
- 31.Saeio K., Chaiyana W., Okonogi S. Antityrosinase and antioxidant activities of essential oils of edible Thai plants. Drug Discov. Ther. 2011;5:144–149. doi: 10.5582/ddt.2011.v5.3.144. [DOI] [PubMed] [Google Scholar]
- 32.Baumann L. Skin ageing and its treatment. J. Pathol. 2007;211:241–251. doi: 10.1002/path.2098. [DOI] [PubMed] [Google Scholar]
- 33.Mbanga L., Mulenga M., Mpiana P.T., Bokolo K., Mumbwa M., Mvingu K. Determination of sun protection factor (SPF) of some body creams and lotions marketed in Kinshasa by ultraviolet spectrophotometry. Int. J. Adv. Res. Chem. Sci. 2014;1:7–13. [Google Scholar]
- 34.Tobin D. Introduction to skin aging. J. Tissue Viability. 2017;26:37–46. doi: 10.1016/j.jtv.2016.03.002. [DOI] [PubMed] [Google Scholar]
- 35.Lohani A., Mishra A.K., Verma A. Cosmeceutical potential of geranium and calendula essential oil: Determination of antioxidant activity and in vitro sun protection factor. J. Cosmet. Dermatol. 2019;18:550–557. doi: 10.1111/jocd.12789. [DOI] [PubMed] [Google Scholar]
- 36.Mansur J.S., Breder M.N.R., Mansur M.C.A., Azulay R.D. Determinação do fato de proteção solar por espectrofotometrica. An. Bras. De Dermatol. 1986;61:121–124. [Google Scholar]
- 37.Sayre R.M., Agin P.P., LeVee G.J., Marlowe E. Comparison of in vivo and in vitro testing of sun screening formulas. Photochem. Photobiol. 1979;29:559–566. doi: 10.1111/j.1751-1097.1979.tb07090.x. [DOI] [PubMed] [Google Scholar]
- 38.Kale S., Gaikwad M., Bhandare S. Determination and comparison of in vitro SPF of topical formulation containing Lutein ester from Tagetes erecta L. flowers, Moringa oleifera Lam seed oil and Moringa oleifera Lam seed oil containing Lutein ester. Int. J. Res. Pharm. Biomed. Sci. 2011;2:1220–1224. [Google Scholar]
- 39.Imam S., Azhar I., Mahmood Z.A. In-vitro evaluation of sun protection factor of a cream formulation prepared from extracts of Musa accuminata (L.), Psidium gujava (L.) and Pyrus communis (L.) Asian J. Pharm. Clin. Res. 2015;8:234–237. [Google Scholar]
- 40.Maisonneuve S.A. European Pharmacopoeia. Vol. 3. European Pharmacopoeia Commission; Sainte-Ruffine, France: 1975. pp. 68–80. [Google Scholar]
- 41.Lucero M., Estell R., Tellez M., Fredrickson E. A retention index calculator simplifies identification of plant volatile organic compounds. Phytochem. Anal. 2009;20:378–384. doi: 10.1002/pca.1137. [DOI] [PubMed] [Google Scholar]
- 42.Sartoratto A., Machado A.L.M., Delarmelina C., Figueira G.M., Duarte M.C.T., Rehder V.L.G. Composition and antimicrobial activity of essential oils from aromatic plants used in Brazil. Braz. J. Microbiol. 2004;35:275–280. doi: 10.1590/S1517-83822004000300001. [DOI] [Google Scholar]
- 43.Bondet V., Brand-Williams W., Berset C. Kinetics and mechanisms of antioxidant activity using the DPPH• free radical method. Lebensm.-Wiss. Technol. 1997;30:609–615. doi: 10.1006/fstl.1997.0240. [DOI] [Google Scholar]
- 44.Re R., Pellegrini N., Proteggente A., Pannala A., Yang M., Rice-Evans C. Antioxidant activity applying an improved ABTS radical cation decolorization assay. Free Radic. Biol. Med. 1999;26:1231–1237. doi: 10.1016/S0891-5849(98)00315-3. [DOI] [PubMed] [Google Scholar]
- 45.Prior R.L., Hoang H.A., Gu L., Wu X., Bacchiocca M., Howard L., Hampsch-Woodill M., Huang D., Ou B., Jacob R. Assays for hydrophilic and lipophilic antioxidant capacity (oxygen radical absorbance capacity (ORACFL)) of plasma and other biological and food samples. J. Agric. Food Chem. 2003;51:3273–3279. doi: 10.1021/jf0262256. [DOI] [PubMed] [Google Scholar]
- 46.Benzie I.F.F., Strain J.J. The ferric reducing ability of plasma (frap) as a measure of “antioxidant power”: The FRAP assay. Anal. Biochem. 1996;238:70–76. doi: 10.1006/abio.1996.0292. [DOI] [PubMed] [Google Scholar]
- 47.Popoola O.K., Marnewick J.L., Rautenbach F., Ameer F., Iwuoha E.I., Hussein A.A. Inhibition of oxidative stress and skin aging-related enzymes by prenylated chalcones and other flavonoids from Helichrysum teretifolium. Molecules. 2015;20:7143–7155. doi: 10.3390/molecules20047143. [DOI] [PMC free article] [PubMed] [Google Scholar]
- 48.Cui H., Duan F., Jia S., Cheng F., Yuan K. Antioxidant and tyrosinase inhibitory activities of seed oils from Torreya grandis Fort. ex Lindl. BioMed Res. Int. 2018;2018:5314320. doi: 10.1155/2018/5314320. [DOI] [PMC free article] [PubMed] [Google Scholar]
- 49.Kaur C.D., Saraf S. In vitro sun protection factor determination of herbal oils used in cosmetics. Pharmacogn. Res. 2010;2:22–25. doi: 10.4103/0974-8490.60586. [DOI] [PMC free article] [PubMed] [Google Scholar]
Associated Data
This section collects any data citations, data availability statements, or supplementary materials included in this article.
Data Availability Statement
The data supporting reported results can be found at https://etd.cput.ac.za/handle/20.500.11838/3340?mode=simple (accessed on 30 September 2022).