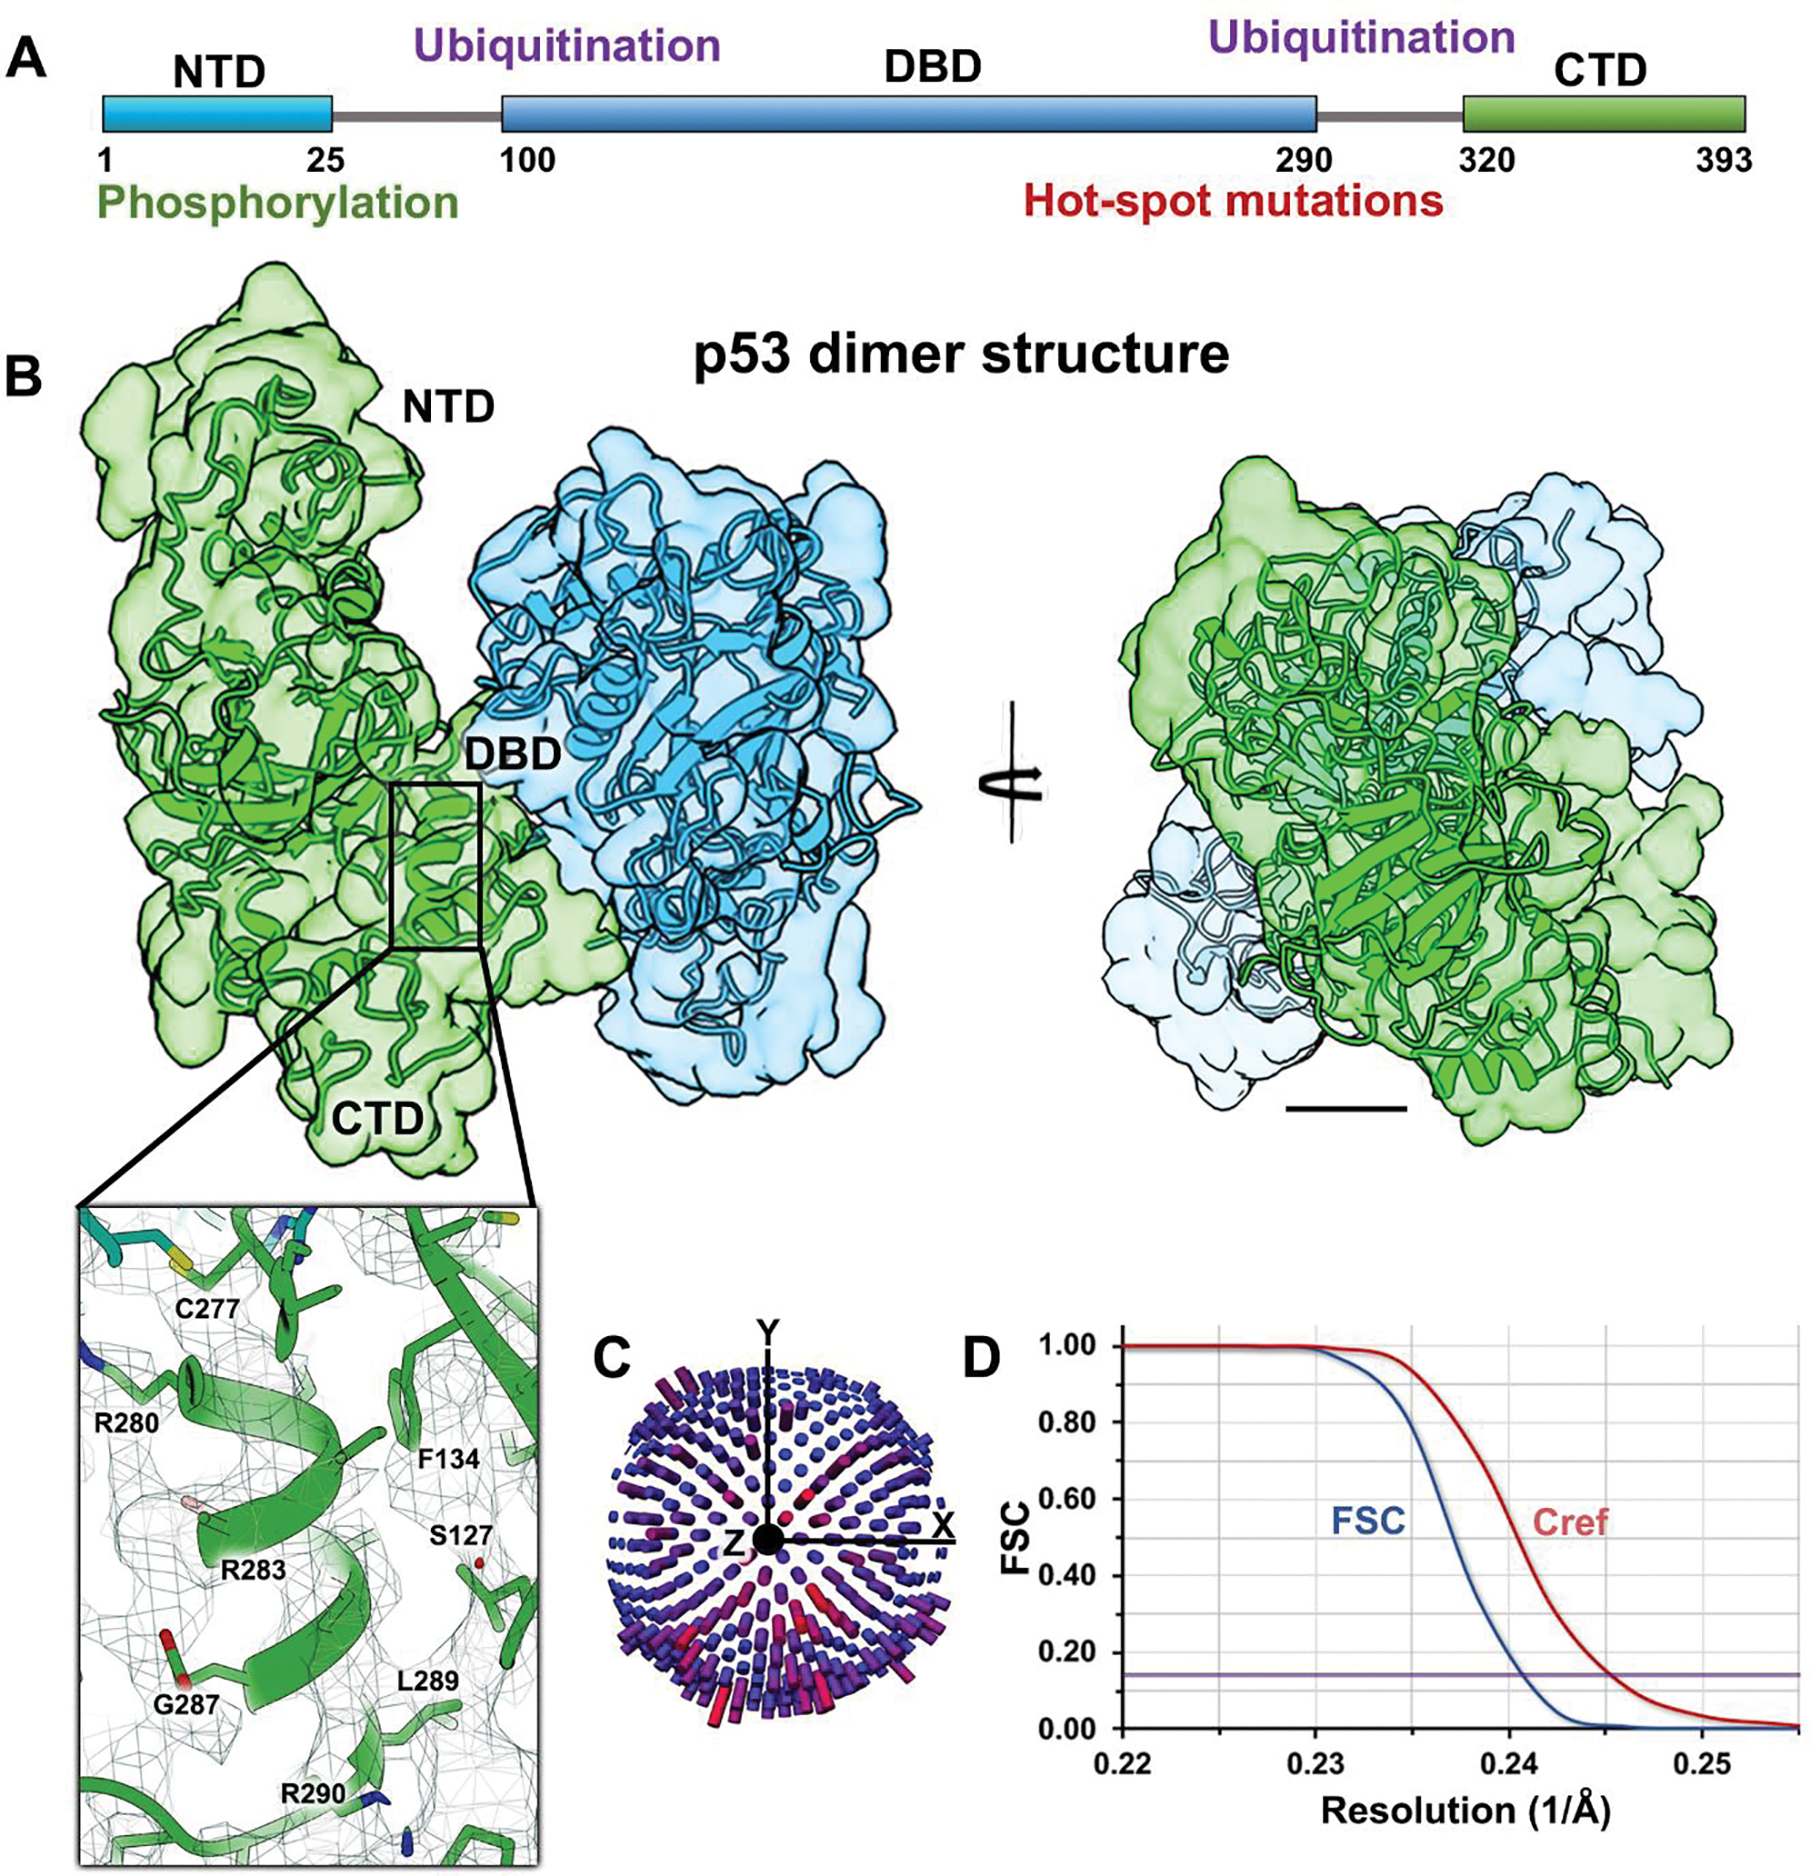
Figure 2. Full-length p53 dimers form a stable “inactive state” in the absence of DNA.

(A) Schematic for the p53 primary structure (residues 1–393) highlighting the NTD, DBD, and CTD along with regions of known phosphorylation or ubiquitination sites and hot spot mutations. (B) Rotational views of the p53 dimer lacking DNA. Two p53 monomers (green and blue) were fit into the EM density map. Close-up view of a helix in the DBD shows some side chains ranging from R280 – R290. Scale bar is 10 Å. (C) Particles were not limited in angular orientations according to their distribution plot. (D) The Fourier shell correlation (FSC) curve and Cref (0.5) evaluation show a resolution of 4.2 Å at the 0.143 value (purple line).
