

Abstract
Chronic kidney disease (CKD)–mineral bone disorder (MBD) is a complex clinical syndrome that begins early during CKD and evolves into one of the deadliest complications of CKD through its effects on the cardiovascular and skeletal systems. Achievement of treatment goals to decrease the risk of accelerated cardiovascular events and fractures has been challenging. We hypothesized that application of quantitative systems pharmacology (QSP) modeling combined with artificial intelligence techniques could improve the management of CKD–MBD with the goal of improving outcomes for patients with CKD. We present the implementation of a reinforcement learning (RL) approach to achieve the prescribed goals for serum calcium, phosphorus, and parathyroid hormone through concurrent dosing of phosphate binders, vitamin D analogs, and calcimimetics by simulation in 80 subjects in Matlab. In silico simulation results demonstrate that the application of a QSP model coupled with RL more effectively and quickly achieves treatment goals even in the setting of inferior simulated subject compliance with medical therapy and identifies key decision variables for therapeutic recommendations.
Study Highlights
WHAT IS THE CURRENT KNOWLEDGE ON THE TOPIC?
The current knowledge on the topic of reinforcement learning combined with a systems pharmacology model is limited.
WHAT QUESTION DID THE STUDY ADDRESS?
By combining these techniques, can we improve patient outcomes by targeting the essential biochemical process without the ability to measure that process directly?
WHAT DOES THE STUDY ADD TO OUR KNOWLEDGE?
Combining traditional pharmacokinetics/pharmacodynamics with advances in artificial intelligence makes exploring the entire therapeutic space possible. This approach might be most advantageous in complex medical conditions where multiple agents are used.
HOW MIGHT THIS CHANGE DRUG DISCOVERY, DEVELOPMENT, AND/OR THERAPEUTICS?
Quantitative system pharmacology models have been noted to provide insight into drug action and can be used in drug discovery. Combining these models with artificial intelligence in the form of reinforcement learning will allow us to attain therapeutic end points quicker and optimally target the desired outcome.
INTRODUCTION
The progression in sophistication of pharmacokinetic and pharmacodynamic models has mirrored the increase of computing power and the ability to handle large amounts of data with multiple complex relationships. This has led to the development of a new modeling technique called quantitative systems pharmacology (QSP). 1 These models are being used to identify novel targets, efficacy, safety, dose optimization, and precision medicine. This approach has even been used in the regulatory process to evaluate the appropriateness of a proposed dosing regimen of a single agent. 2 We would like to expand that QSP approach in precision medicine by combining it with machine learning, specifically reinforcement learning (RL), to leverage the advantages of both techniques.
An ideal candidate disease to assess this approach is the treatment of a complex disease that accompanies chronic kidney disease, known as chronic kidney disease (CKD)–mineral bone disorder (MBD). CKD–MBD results in accelerated skeletal and cardiovascular morbidities and premature death. 3 , 4 , 5 , 6 , 7 , 8 Biochemical manifestations of CKD–MBD include hyperphosphatemia, hyperparathyroidism, and hypocalcemia as well as changes in parameters that are not routinely monitored, such as decreased 1,25 dihydroxy vitamin D, decreased klotho, and high fibroblast growth factor (FGF23). The pathophysiologic sequelae of CKD–MBD are bone disease, commonly called renal osteodystrophy, and life‐limiting cardiovascular morbidities visibly manifested as vascular calcification and left ventricular hypertrophy. Although CKD–MBD is recognized as a major contributor to the high mortality associated with CKD, treatment of the disorder remains inadequate. The bone and cardiovascular damage resulting from CKD–MBD is very modestly reversed by renal replacement therapy with dialysis and is just marginally better with kidney transplantation. 9
The current standard of care for CKD–MBD is published in the Kidney Disease: Improving Global Outcomes (KDIGO) clinical practice guidelines. 10 The recommendations are based on both experimental data and opinion and target the attainment of ranges for calcium (Ca), phosphorus (P), and parathyroid hormone (PTH) using phosphate binders, vitamin D, and a calcimimetic. Patients with mild kidney failure are treated like the general population. Most of the patients who received treatment for CKD–MBD are dialysis patients, and the quality of dialysis is measured by moving patients to the recommended target ranges for Ca, P, and PTH. Clinical guidelines may not address the real processes underlying the morbidity and mortality of CKD–MBD such as fracture and cardiovascular event prefaced by the movement of Ca from the bone and into the tissue, and our proposed approach is one way to address this process.
To help address the challenges in treating CKD–MBD, we use a QSP model of Ca and P metabolism developed by Peterson and Riggs 11 that we modified. 12 We believe that the QSP approach will be useful in modeling this complex disease, which typically involves combination therapy. Furthermore, incorporating the biological variance in response to therapies can help arrive at individualized treatment decisions. In this work, we demonstrate the application of this model as a simulation (in silico) platform to discover a CKD–MBD treatment regimen for achieving the clinical goals for Ca, P, and PTH in CKD‐5D stage patients using an artificial intelligence (AI) technique called reinforcement learning (RL).
METHODS
Description of the QSP model
In a previous publication, 12 we introduced a QSP model of CKD–MBD progression based on the open‐source framework proposed by Peterson and Riggs. 11 The model is based on 31 nonlinear ordinary differential equations describing the movement of Ca and P between various compartments of the body. Importantly, the model represents the following two major pathologies of CKD–MBD: bone resorption, represented as excess Ca and P movement out of the bone compartment; and vascular calcification, represented as excess Ca and P deposition in the vascular smooth muscle cell (VSMC) tissue (Figure 1). The model was validated against more than 33,000 data samples from the Chronic Renal Insufficiency Cohort study. 12
FIGURE 1.
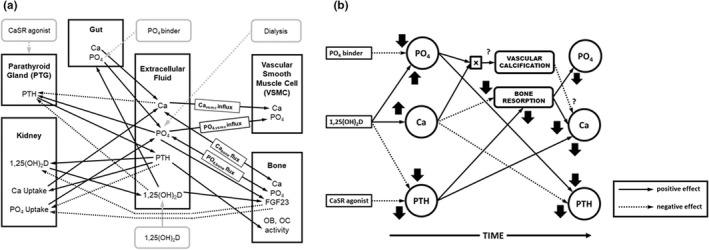
(a) Diagram of the CKD–MBD quantitative systems pharmacology model used in the simulations. (b) Diagram of the effects of the administration of the agents used to treat CKD–MBD on the serum concentrations of Ca, P, and PTH as well as the impact on the complications of CKD–MBD, vascular calcification, and bone resorption. The direction of the effect is shown by the arrow, and positive effects are shown as the solid line, negative effects as the dotted line, and unknown effects as the dashed line. Ca, calcium; CaSR, calcium sensing receptor; CKD, chronic kidney disease; FGF23, fibroblast growth factor 23; MBD, mineral bone disorder; OB, osteoblast; OC, osteoclast; P, phosphorus; PO4, phosphate; PTH, parathyroid hormone.
The expanded model incorporates the following three main pharmacologic interventions used for the treatment of CKD‐MBD: phosphate binders, active vitamin D, and calcimimetics. For demonstration purposes, these interventions are applied at 6‐month intervals in this study. At first, dialysis initiation lowers P and PTH and raises Ca. Phosphate binders are typically used as the first line of attack to lower P and PTH. Active vitamin D is the next preferred treatment. Vitamin D increases intestinal Ca and phosphate absorption and decreases PTH secretion. As predicted by the model, the vitamin D–stimulated increase in serum phosphate is transient as the increased Ca availability and the combined effect of higher Ca and vitamin D to decrease PTH secretion ultimately result in the decreased release of Ca and P from the bone. The net long‐term effect is a further lowering of P. Calcimimetics are used if a further decrease in PTH is required. The use of a calcimimetic results in an instantaneous drop in PTH accompanied by a drop in Ca with no marked effect on P.
Complex interaction of drugs used to treat CKD–MBD
Shown in Figure 2 is the complex relationship between the drugs used in the treatment of CKD–MBD and their effects on the measured biochemical parameters (serum Ca, P, and PTH). These effects change over time as the downstream unmeasured processes are affected, and ultimately those unmeasurable processes change (Ca flux out of bone and into tissue; Figure 1). This is an important relationship to model because physicians are reluctant to modify agents simultaneously and their therapeutic decisions are generally driven by the relatively short‐term weekly to monthly changes in these biochemical parameters. These clinical considerations delay the achievement of practice guidelines.
FIGURE 2.
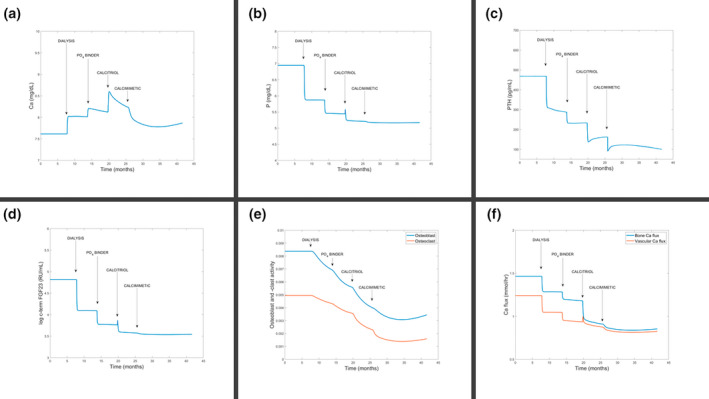
Chronic kidney disease–mineral bone disorder model simulation of different treatment interventions applied in serial order (dialysis, phosphate binder, calcitriol, and calcimimetic) for (a) Ca, (b) P, and (c) PTH serum concentrations. (d) Model‐predicted typically unmeasured concentrations of fibroblast groath factor (FGF23). (e) Model‐predicted and practically unmeasurable activity of osteoclasts and osteoblasts. (f) Model‐predicted and practically unmeasurable net flux of Ca out of the bone and into the tissue. Ca, calcium; P, phosphorus; PTH, parathyroid hormone.
Reinforcement learning
Reinforcement Learning is an AI approach that represents a family of psychology‐inspired learning methods. 13 In the context of medical decision making, RL resembles the way a physician makes therapeutic decisions to maximize a patient's probability of positive outcome and to minimize adverse effects of the treatment. Compared with supervised learning (SL) methods, which presently form the mainstream of AI applications and focus on replicating knowledge encoded in large data stores, RL's major strength is in the ability to discover new knowledge, which was demonstrated by outperforming human experts in the game of Go. 14 , 15 This algorithm (AlphaGo) famously defeated the world champion in Go.
In this work, we demonstrate how RL methods, in combination with a QSP model, can be used to improve an empirical approach to the treatment of CKD–MBD. We first train an AI Agent to replicate human knowledge using SL (behavioral cloning 16 ). We then let the Agent improve on the trained knowledge by interacting with the QSP model using RL to achieve the physician‐specified treatment goals.
Reinforcement Learning is based on the concept of the Markov decision process 13 in which an Agent observes the “state” of its “environment” and performs “actions” for which it receives “rewards.” The objective of the Agent is to perform actions that achieve a certain goal that is mathematically represented as the maximization of the cumulative long‐term reward. The mapping between states and the actions is referred to as “policy.”
In our application, the environment is represented by the QSP model of CKD–MBD. 12 For this simulation, the model is configured as follows:
- Inputs (Actions):
- Phosphate binder dose
- Calcitriol dose
- Calcimimetic dose
- Outputs (State):
- Ca
- P
- PTH
The model sampling time was set to 1 month, consistent with the frequency of measurement of the biochemical parameters of interest and the dose adjustment for the three therapeutics. In addition to the State measurements, we observed model estimated levels of calcitriol, FGF23, Ca flux between serum and bone, and Ca flux between serum and soft tissue. These quantities were not visible to the RL Agent as part of the state measurement and were used in data analysis phase only. We represented the Actor (Policy) in the RL Agent as a deep neural network (DNN) with the following structure:
Input Layer—13 features—Ca, P, PTH levels 3 months (9 features), difference between current Ca and the lower and upper limits of the Ca target range (2 features), difference between current PTH and the lower and the upper limits of the PTH target range (2 features).
Hidden Layer 1—100 fully connected neurons with radial basis (exp[−x 2 ]) activation function.
Hidden Layer 2—100 fully connected neurons with radial basis activation function.
Output Layer—2 outputs—calcitriol dose adjustment (−2/−1/0/+1/+2) and calcimimetic dose adjustment (−1/0/1), where the “−” sign represents the dose decrease and the “+” sign represents the dose increase; the numerical value represents the dose‐adjustment steps with “0” meaning “maintain current dose.”
Dosing of P binders is typically driven by serum P level alone and is independent of the other two drugs and, because P binders are taken at home, strongly affected by the patient adherence. For this reason, in our present approach we chose not to train the Agent to dose P binder. Instead, we simulated P binder dosing using a simple rule‐based approach with 100% patient adherence in the training phase:
IF serum P > upper limit of target range THEN Increase P binder by one dose step
IF serum P < lower limit of target range THEN Decrease P binder by one dose step
The target range for P was set to 3.5–5.5 mg/dl.
The Reward function was defined to achieve the following goals:
Maintain Ca 8.8–9.9 mg/dl
Avoid Ca < 7.0 mg/dl
Avoid Ca > 10.2 mg/dl
Maintain PTH 200–600 pg/ml
Avoid PTH < 100 pg/ml
Maintain Ca × P < 55 mg2/dl2
Reward shaping was used to increase the training efficiency and prevent numerical issues attributed to sparse rewards. Reward shaping augments the training signal by rewarding the Agent for making progress toward the goal. 17
We performed behavioral cloning of the Actor DNN using human expert knowledge:
We created 128,061 training instances by simulating expert physician dosing of P binder/calcitriol/calcimimetic in response to P, Ca, PTH levels. The levels of Ca, P, and PTH were drawn uniformly from the following ranges: 6–11 mg/dl (Ca), 2–10 mg/dl (P), and 0–1500 pg/ml (PTH). The simulated expert dosing was governed by the following rules:
P binder:
IF P > 5.5 THEN Increase P binder by one dose step.
IF P < 3.5 THEN Decrease P binder by one dose step.
Calcitriol and Calcimimetic:
IF PTH > 600 AND Ca < 8.8 THEN Increase calcitriol by one dose step.
IF PTH > 600 AND Ca > 9.9 THEN Increase calcimimetic by one dose step.
IF PTH < 200 AND Ca > 9.9 THEN Decrease calcitriol by one dose step.
IF PTH < 200 AND Ca < 8.8 THEN Decrease calcimimetic by one dose step.
-
2We used SL to pretrain the Actor DNN to replicate expert physician actions. We used the adaptive moment estimation SL method 18 with the following hyperparameters:
- Maximum training epochs: 1000
- Mini‐batch size: 64 samples
- Initial learning rate: 10e−4
- Training data/validation data: 90%/10%
The SL‐trained Actor DNN achieved 99% agreement with expert physician's decisions and was further trained with the deep deterministic policy gradient (DDPG) RL method using the QSP model of CKD–MBD 12 to simulate a patient's response to treatment. The DDPG hyperparameters were set as follows:
Maximum training episodes: 10,000
Training episode length: 4 years
Mini‐batch size: 64
Discount factor: 0.99
Experience buffer size: 106 samples
Critic learning rate: 1e−3
Actor learning rate: 1e−6
The Critic was implemented as a DNN with two hidden layers containing 200 and 100 fully connected neurons with radial basis activation functions. In each training episode, the initial model states were drawn uniformly from the following ranges: 5–8 mg/dl (P), 7–9 mg/dl (Ca), and 100–1500 pg/ml (PTH) to encompass all possible observations at the onset of hemodialysis and to emulate individual patient characteristics.
Validation
To evaluate the efficacy of the RL‐trained Agent, we compared its performance with that of the initial SL‐trained Agent. We simulated a cohort of virtual CKD‐5D patients by varying oral P intake, parathyroid gland Ca sensing receptor sensitivity, and P threshold for vascular calcification resulting in initial p values between 5.0 and 8.0 mg/dl, Ca between 6.9 and 9.0 mg/dl, and PTH between 100 and 1330 pg/ml. The exhaustive sampling of this parameter space resulted in 80 virtual subjects. The simulation follow‐up time was 24 months. To mimic the real‐world adherence problem with phosphate binders, we tested the following four levels of subject adherence: 100%, 75%, 50%, 25%. We used the achieved percent in range for P, Ca, PTH as the primary evaluation criteria. In addition, we compared the effect of treatment on the levels of serum calcitriol and FGF23, the reduction in Ca efflux from the bone compartment, and the reduction of Ca influx into the soft tissue. Finally, we compared the drug usage by both Agents.
Because the Agent is represented by a DNN, it lacks the ability to explain its actions. To enable interpretation of the Agent's actions and verify the dosing policy, we performed a decision tree analysis. We generated dosing recommendations for all possible input combinations for Ca, P, and PTH within the following ranges: Ca 7–11 mg/dl, P 3.5–9.5 mg/dl, PTH 100–1200 pg/ml. Using this new data set (23 million data points), we applied a classification and tree regression approach 19 to generate a classification tree replicating the policy of the trained RL Agent. We also performed importance analysis of the input variables. All simulations were performed in Matlab/Simulink2021b (The Mathworks) with the Reinforcement Learning and Deep Learning Toolbox.
Simulation results were compared for the dose titration and the maintenance (steady‐state) period of treatment using regression analysis of the dependent variable (Ca, P, PTH, calcitriol (CTL), fibroblast growth factor (InFGF), bone calcium flux (bC), or vascular calcium flux (vCa)) over time with the factors RL (RL vs. SL) and P binder adherence. The titration period consisted of Months 1–8, and the steady‐state period consisted of Months 13–20. A difference between the Agents during the titration period would indicate that one of the Agents reaches the target faster and that the steady state was achieved in the second year of treatment. Differences in drug use were tested using analysis of variance. Statistical analysis was performed using SPSS Version 27 (IBM).
RESULTS
Phosphate binder adherence
A widely prevalent challenge in the treatment of CKD–MBD is varying adherence to phosphate binders taken by patients with CKD to blunt the gastrointestinal absorption of dietary phosphate. Therefore, the effect of differing degrees of phosphate binder adherence on the performance of the model, that is, the ability to achieve the desired levels of the CKD–MBD parameters, was tested. Simulation results are shown in Tables 1 and 2 for the SL‐trained (simulated physician) and the RL‐trained (virtual trained physician) Agent, respectively. Values are reported as the percentage in range, mean and standard deviation, median, and the average dose amount per subject. Changes in Ca movement between the bone, serum, and the soft tissue are shown as the percent reduction from the model‐predicted baseline. Results are reported for each level of phosphate binder adherence. Uniformly for both Agents, as binder adherence decreased, the percent of observations in range for Ca and P fell. The effect on PTH varied with adherence, but in general PTH levels increased as phosphate binder adherence decreased. FGF23 increased with decreased phosphate binder adherence, as expected. The effectiveness of therapy on the net Ca bone efflux reduction slightly decreased, whereas the reduction of Ca influx into soft tissue did not change.
TABLE 1.
Results of the simulations for each level of P binder adherence for the SL‐ and RL‐trained Agent
| Phosphate binder adherence percentage | ||||||||
|---|---|---|---|---|---|---|---|---|
| 100% | 75% | 50% | 25% | |||||
| SL | RL | SL | RL | SL | RL | SL | RL | |
| P 3.5–5.5, % | 77 | 91.2 | 67.5 | 75.0 | 49.9 | 59.6 | 35 | 47 |
| P, mg/dl (mean ± SD) | 5.8 ± 0.4 | 5.2 ± 0.0 | 5.5 ± 0.0 | 5.3 ± 0.0 | 5.7 ± 0.0 | 5.5 ± 0.0 | 6.1 ± 0.0 | 5.8 ± 0.0 |
| Ca 8.5–9.9, % | 82 | 87 | 79 | 86 | 77 | 84 | 67 | 78 |
| Ca, mg/dl (mean ± SD) | 8.9 ± 0.04 | 9.1 ± 0.05 | 8.9 ± 0.03 | 9.1 ± 0.05 | 8.8 ± 0.03 | 9.1 ± 0.05 | 8.7 ± 0.03 | 9.0 ± 0.04 |
| PTH 200–600, % | 75 | 56 | 81 | 57 | 85 | 59 | 87 | 54 |
| PTH, pg/ml (median) | 290 | 249 | 303 | 263 | 330 | 273 | 379 | 296 |
| Calcitriol level, pg/ml (mean ± SD) | 33.8 ± 0.0 | 56.2 ± 1.5 | 30.2 ± 7.5 | 59.1 ± 1.4 | 39.7 ± 0.03 | 62.1 ± 1.7 | 44.3 ± 0.2 | 65.8 ± 1.2 |
| c‐term FGF23 level, RU/ml (median) | 5710 | 4547 | 9306 | 6329 | 16,499 | 11,350 | 35,059 | 22,937 |
| Reduction in Ca bone efflux, % | 28.9 | 38.8 | 27.2 | 37.7 | 25.7 | 35.6 | 22.5 | 33.0 |
| Reduction in Ca vascular influx, % | 15.8 | 17.2 | 12.6 | 14.8 | 8.5 | 10.5 | 4.5 | 6.5 |
| Average recommended P binder dose, mg/day per patient | 5253 | 4500 | 5970 | 5284 | 6610 | 5768 | 7190 | 6415 |
| Average recommended calcitriol dose, ug/day per patient | 1.14 | 1.90 | 1.22 | 2.00 | 1.35 | 2.10 | 1.50 | 2.23 |
| Average recommended calcimimetic dose, mg/day per patient | 4.5 | 1.1 | 4.5 | 0.3 | 4.5 | 1.2 | 4.5 | 0.4 |
Abbreviations: Ca, calcium; P, phosphorus; PTH, parathyroid hormone; RL, reinforcement learning; SL, supervised learning.
TABLE 2.
Regression coefficients shown as the 95% confidence interval for the effect of the trained agent (Agent), effect of time (Rate of change), and Binder adherence (25%, 50%, 75%, and 100%)
| RL (p) | Rate of change (p) | Binder adherence (p) | |
|---|---|---|---|
| Titration period | |||
| P | −0.19, −0.10 (<0.001) | −0.14, −0.13 (<0.001) | −0.48, −0.32 (<0.001) |
| Ca | 0.19, 0.24 (<0.001) | 0.15, 0.16 (<0.001) | 0.09, 0.17 (<0.001) |
| PTH | −60, −31 (<0.001) | −60, −54 (<0.001) | −99, −47 (<0.001) |
| CTL | 16, 17 (<0.001) | 6.2, 6.5 (<0.001) | −3.7, −0.6 (0.058) |
| ln fibroblast growth factor | −0.33, −0.18 (<0.001) | −0.23, −0.20 (<0.001) | −0.75, −0.49 (<0.001) |
| vCa | −0.23, −0.01 (0.032) | −0.14, −0.010 (<0.001) | −0.86, −0.047 (<0.001) |
| bCa | −0.10, −0.08 (<0.001) | −0.057, −0.053 (<0.001) | −0.075, −0.038 (<0.001) |
| Steady‐state period | |||
| P | −0.22, −0.16 (<0.001) | −0.004, 0.008 (1.00) | −0.86, −0.76 (<0.001) |
| Ca | 0.24, 0.28 (<0.001) | −0.006, 0.002 (0.997) | 0.14, 0.22 (<0.001) |
| PTH | −69, −55 (<0.001) | −5.5, −2.7 (<0.001) | −102, −78 (<0.001) |
| CTL | 21, 24 (<0.001) | −0.47, 0.083 (0.997) | −16, −11 (<0.001) |
| ln fibroblast growth factor | −0.38, −0.28 (<0.001) | −0.006, 0.014 (1.00) | −1.4, −1.2 (<0.001) |
| vCa | −0.032, −0.013 (<0.001) | −0.001, 0.002 (1.00) | −0.19, −0.15 (<0.001) |
| bCa | −0.15, −0.14 (<0.001) | 0.00, 0.003 (0.85) | −0.12, −0.088 (<0.001) |
Abbreviations: bCa, net flux of Ca out of the bone; Ca, calcium; CTL, calcitriol; P, phosphorus; PTH, parathyroid hormone; RL, reinforcement learning; vCa, net flux of Ca into the soft tissue.
Comparison of SL and RL on measurable parameters
Statistical analysis of the data is shown in Table 3 with the regression coefficient for each factor. The RL‐trained Agent attained steady state faster in all cases and with lower predicted concentrations of P, PTH, and FGF23 and higher concentrations of Ca and CTL. The time effect on FGF23 between the SL‐ and RL‐trained Agents showed statistically significant but less impressive superiority of the latter (Figure 3).
TABLE 3.
Regression coefficients shown as the 95% confidence interval for the effect of the trained agent (Agent), effect of time (Rate of change), and Binder adherence (25%, 50%, 75%, and 100%)
| Trained agent | Rate of change | Binder adherence | |
|---|---|---|---|
| Titration period | |||
| P | −0.19, −0.10 | −0.14, −0.13 | −0.48, −0.32 |
| Ca | 0.19, 0.24 | 0.15, 0.16 | 0.09, 0.17 |
| PTH | −60, −31 | −60, −54 | −99, −47 |
| CTL | 16, 17 | 6.2, 6.5 | −3.7, −0.6 |
| ln fibroblast growth factor | −0.33, −0.18 | −0.23, −0.20 | −0.75, −0.49 |
| vCa | −0.23, −0.01 | −0.14, −0.010 | −0.86, −0.047 |
| bCa | −0.10, −0.08 | −0.057, −0.053 | −0.075, −0.038 |
| Steady‐state period | |||
| P | −0.22, −0.16 | −0.004, 0.008 | −0.86, −0.76 |
| Ca | 0.24, 0.28 | −0.006, 0.002 | 0.14, 0.22 |
| PTH | −69, −55 | −5.5, −2.7 | −102, −78 |
| CTL | 21, 24 | −0.47, 0.083 | −16, −11 |
| ln fibroblast growth factor | −0.38, −0.28 | −0.006, 0.014 | −1.4, −1.2 |
| vCa | −0.032, −0.013 | −0.001, 0.002 | −0.19, −0.15 |
| bCa | −0.15, −0.14 | 0.00, 0.003 | −0.12, −0.088 |
Abbreviations: bCa, net flux of Ca out of bone; Ca, calcium; CTL, calcitriol; P, phosphorus; PTH, parathyroid hormone; vCa, net flux of Ca into tissue.
FIGURE 3.
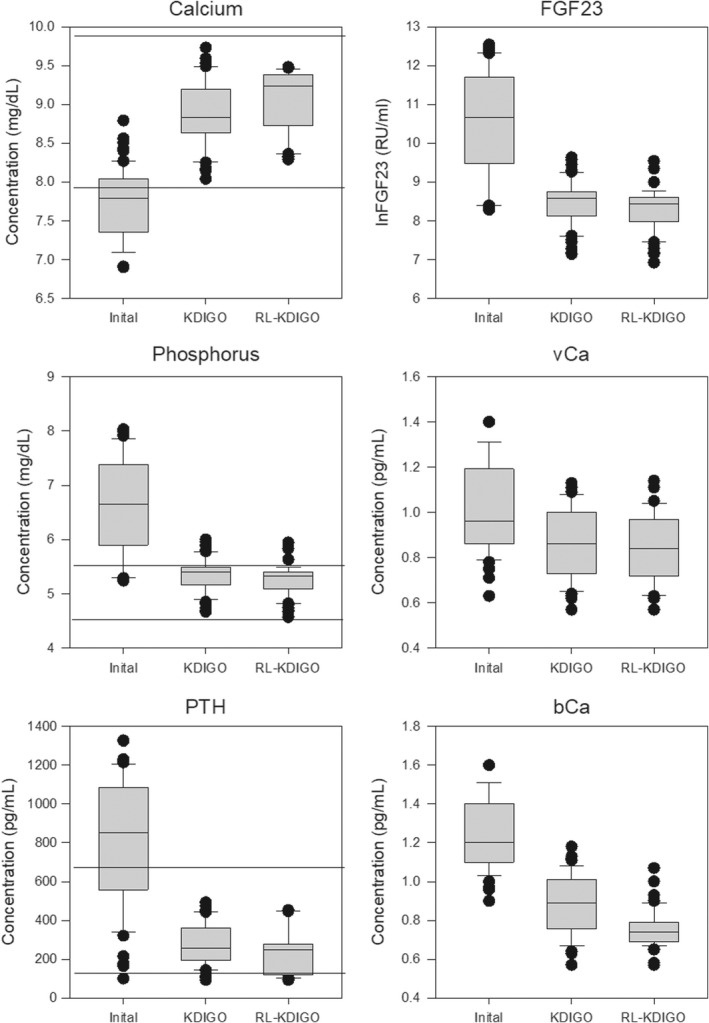
Box plot of the initial concentrations of Ca, P, PTH, and ln fibroblast growth factor (FGF23) and the net flux of Ca into the soft tissue (vCa) and out of the bone (bCa) followed by the final achieved values following supervised learning and RL. Horizontal lines represent the target range for Ca, P, and PTH. Ca, calcium; KDIGO, Kidney Disease: Improving Global Outcomes; P, phosphorus; PTH, parathyroid hormone; RL, reinforcement learning.
Comparison of SL and RL on unmeasurable parameters
The model incorporates two depot compartments for Ca in the bone and in the soft tissue. This allows us to separately investigate the movement of Ca between the bone, serum, and soft tissue. The RL‐trained Agent more rapidly reduced the net bone Ca efflux and Ca influx into soft tissue compared with the SL‐trained Agent (Table 3, Figure 3).
Comparison of SL and RL on drug usage
The RL‐trained Agent used less P binder and calcimimetic and more vitamin D than the SL‐trained Agent. A summary of all administered drugs over two 8‐month periods, one during titration and one at steady state, are shown in Table 1. Despite using more vitamin D, which would be expected to increase serum P concentration, the RL‐trained Agent achieved lower serum P concentrations in the long run compared with the SL‐trained Agent.
Evaluation of importance of temporal measurements in RL
Current Ca and PTH concentrations were the most important decision variables (57%) followed by PTH measured at 2 months (22%). P levels over time appear to not affect the dosing policy of the RL‐trained Agent. This finding can be attributed to the fact that P binder dosing was not performed by the Agent.
DISCUSSION
MBD of CKD is a complex medical condition that presents significant treatment challenges. In this article, we demonstrate how a combination of modern computational tools, QSP and AI, can be useful in individualizing and refining the treatment of CKD–MBD to achieve clinically relevant outcomes. Our major findings include (1) the ability to improve pharmacologic treatment of disease, (2) the superiority of the application of RL in the achievement of treatment goals for complex clinical conditions, and (3) the identification of the variables most important in therapeutic decision analysis.
We address the gaps in knowledge of the complex pharmacology of CKD–MBD by comparing the achievement of KDIGO goals, Ca flux, and drug usage between a simulated physician approach and the AI. The AI approach is robust, demonstrating more rapid achievement of KDIGO goals. This approach can be used to individualize therapy and assess deep bone and tissue compartments and can be expanded to incorporate new therapeutic agents as they are developed. Specifically, we can access how the clinical guideline goals for Ca, P, and PTH influence the model‐predicted fluxes of Ca from the bone and into the soft tissue. This work represents a first step in developing a decision support tool for the medical management of CKD–MBD and is not intended for clinical use. The goals of applying AI to clinical medicine are to allow providers to incorporate a broad range of clinical data into their decision‐making processes, uncover previously unrecognized patterns in clinical disease, and tailor therapy to the individual patient. A significant barrier to the adoption of AI in clinical medicine is the impression on the part of providers that their training, understanding of pathophysiology, and clinical experience is being abandoned. However, this approach is grounded in the underlying physiology of CKD–MBD with insights into the unobserved processes for which the measurements of Ca, P, and PTH are merely surrogates.
Most AI methods applied in medicine are founded on the SL paradigm. In SL, large amounts of existing data are used to train an AI Agent to replicate the information encoded in those data. Our approach uses an AI paradigm called RL, which is focused on discovering new information using a model of the environment. We prime the AI Agent with human expert knowledge before training and verify the recommendations generated by the AI Agent after training to ensure that dosing recommendations by the Agent are acceptable to a human expert.
We have demonstrated that RL improved on the simulated standard‐of‐care approach in achieving the KDIGO guidelines. Decreased P binder adherence, mimicking real life, had a similar effect on both the SL‐ and the RL‐trained Agents, resulting in higher P and PTH concentrations as well as lower Ca levels. However, the outcomes achieved by the RL‐trained Agent were superior to those achieved by the SL‐trained Agent at all levels of P binder adherence. Furthermore, the decreased adherence to P binder was accompanied by a smaller reduction in bone resorption or soft tissue calcification. However, the RL‐trained Agent still demonstrated greater efficacy in this regard. These results underscore the overwhelming importance of phosphate control in the management of CKD–MBD.
The model‐based predictions generated using the RL‐trained Agent warrant further discussion and confirmation before implementation. The greater use of vitamin D analog and the higher levels of serum calcitriol result in a greater reduction in bone demineralization compared with the SL‐trained Agent. This finding suggests that the achievement of elevated calcitriol levels is critical for the maintenance of bone mineral in the setting of CKD. Another effect of higher calcitriol level achieved by the trained Agent is a greater reduction in PTH leading to lesser bone demineralization that, coupled with enhanced intestinal uptake of Ca and phosphate, may lead to preserved bone mineral content.
It is notable that the superior efficacy in decreasing bone resorption was accompanied by a lesser although still significant decrease in soft tissue mineralization, an outcome that persisted even in the presence of lesser degrees of phosphate binder adherence. This observation suggests that the reluctance to use vitamin D analogs in the setting of hyperphosphatemia out of concern for worsening vascular calcification may not be justified. The reasons for the greater reduction in soft tissue calcification cannot be stated with certainty; however, this result correlates with greater reductions in PTH, FGF23, and P and a greater reduction in bone demineralization. A suggested explanation is that the decrease in bone resorption diminishes the available mineral to be deposited in the soft tissue. Bone tissue has mechanisms for both the influx and efflux of mineral through the activation of osteoblasts and osteoclasts, respectively. In contrast, vascular smooth muscle cells take on characteristics of osteoblasts in advanced CKD, permitting the deposition of mineral. 20 However, mechanisms for endogenous reversal of vascular calcification are poorly studied or understood. 21
Alternative approaches could be used in addressing this problem of discovery of innovative methods to simultaneously derive proper dosing for multiple drugs for a multifactorial medical issue. A traditional approach such as maximum a posteriori estimation, although appropriate for parameter estimation, could be applied to the QSP model, but that is not the innovation we present in this work. Other optimal control approaches could be applied, and we have investigated some of those in other work, particularly model‐predictive control in anemia management. 22 , 23 RL can be viewed as an extension to a direct optimal control method, where human learning–inspired methods are used to optimize the objective function (maximize the reward). Although traditional optimal control methods tend to be “black box” in nature, the policy trained by RL can be represented in a transparent form. RL offers more flexibility in defining the objective function. Furthermore, we believe that the human‐inspired nature of RL makes it more tractable to the clinical user compared with traditional math‐heavy control design methods.
In summary, we have demonstrated the ability of an AI technique called RL in connection with a quantitative systems biology model of CKD‐MBD to improve on a simulated human expert in achieving the measurable biochemical goals of CKD–MBD treatment even in the presence of decreased adherence to therapy. Coincidentally, our approach results in the improvement of mineral metabolism parameters that are not routinely measured but impact clinical outcomes. The goal of therapy for CKD–MBD is to prevent fractures and major cardiovascular events, both causes of the accelerated mortality of CKD. The current focus of our guidelines on biochemical targets is clearly limited in efficacy, as the incidence of fractures and the rate of cardiovascular mortality of patients with CKD remain unacceptably high. Our in silico results describing the unmeasured parameters of mineral metabolism highlight the validity of this approach to innovate therapy in CKD–MBD through targeting therapy to clinically meaningful end points. Furthermore, the ability to incorporate additional modulating parameters into the model underscores the flexibility and relevance of this approach as it allows for the generation of testable hypotheses regarding the pathogenesis and therapy of CKD–MBD.
AUTHORS CONTRIBUTIONS
A.E.G., E.D.L., and M.E.B. wrote the manuscript: A.E.G., E.D.L., and M.E.B. designed the research; A.E.G. performed the simulations; A.E.G. and M.E.B. analyzed the data.
FUNDING INFORMATION
This material is based on work supported by the Department of Veterans Affairs, Veterans Health Administration, Office of Research and Development Clinical Sciences Research and Development; US Department of Veterans Affairs: CX001614. The views expressed in this article are those of the authors and do not necessarily reflect the position or policy of the Department of Veterans Affairs or the US government.
CONFLICT OF INTEREST
M.E.B. and A.E.G. have equity interest in Dosis Inc. E.D.L. declared no competing interests for this work.
Supporting information
Appendix S1
Gaweda AE, Lederer ED, Brier ME. Artificial intelligence–guided precision treatment of chronic kidney disease–mineral bone disorder. CPT Pharmacometrics Syst Pharmacol. 2022;11:1305‐1315. doi: 10.1002/psp4.12843
REFERENCES
- 1. Sorger PK, Allerheiligen SRB, Abernethy DR, et al. ed. Quantitative and systems pharmacology in the post‐genomic era: new approaches to discovering drugs and understanding therapeutic mechanisms. Ans NIH White Paper by the QSP Workshop Group. National Institute of Health; 2011. [Google Scholar]
- 2. Peterson MC, Riggs MM. FDA advisory meeting clinical pharmacology review utilizes a quantitative systems pharmacology (QSP) model: a watershed moment? CPT Pharmacometrics Syst Pharmacol. 2015;4(3):e00020. [DOI] [PMC free article] [PubMed] [Google Scholar]
- 3. Block GA, Klassen PS, Lazarus JM, Ofsthun N, Lowrie EG, Chertow GM. Mineral metabolism, mortality, and morbidity in maintenance hemodialysis. J Am Soc Nephrol. 2004;15(8):2208‐2218. [DOI] [PubMed] [Google Scholar]
- 4. Chronic Kidney Disease Prognosis C , Matsushita K, van der Velde M, et al. Association of estimated glomerular filtration rate and albuminuria with all‐cause and cardiovascular mortality in general population cohorts: a collaborative meta‐analysis. Lancet. 2010;375(9731):2073‐2081. [DOI] [PMC free article] [PubMed] [Google Scholar]
- 5. Go AS, Chertow GM, Fan D, McCulloch CE, Hsu CY. Chronic kidney disease and the risks of death, cardiovascular events, and hospitalization. N Engl J Med. 2004;351(13):1296‐1305. [DOI] [PubMed] [Google Scholar]
- 6. Hui X, Matsushita K, Sang Y, Ballew SH, Fulop T, Coresh J. CKD and cardiovascular disease in the Atherosclerosis Risk in Communities (ARIC) study: interactions with age, sex, and race. Am J Kidney Dis. 2013;62(4):691‐702. [DOI] [PMC free article] [PubMed] [Google Scholar]
- 7. Matsushita K, Coresh J, Sang Y, et al. Estimated glomerular filtration rate and albuminuria for prediction of cardiovascular outcomes: a collaborative meta‐analysis of individual participant data. Lancet Diabetes Endocrinol. 2015;3(7):514‐525. [DOI] [PMC free article] [PubMed] [Google Scholar]
- 8. van der Velde M, Matsushita K, Coresh J, et al. Lower estimated glomerular filtration rate and higher albuminuria are associated with all‐cause and cardiovascular mortality. A collaborative meta‐analysis of high‐risk population cohorts. Kidney Int. 2011;79(12):1341‐1352. [DOI] [PubMed] [Google Scholar]
- 9. Iseri K, Carrero JJ, Evans M, et al. Fractures after kidney transplantation: Incidence, predictors, and association with mortality. Bone. 2020;140:115554. [DOI] [PubMed] [Google Scholar]
- 10. Ketteler M, Block GA, Evenepoel P, et al. Executive summary of the 2017 KDIGO Chronic Kidney Disease‐Mineral and Bone Disorder (CKD–MBD) Guideline Update: what's changed and why it matters. Kidney Int. 2017;92(1):26‐36. [DOI] [PubMed] [Google Scholar]
- 11. Peterson MC, Riggs MM. A physiologically based mathematical model of integrated calcium homeostasis and bone remodeling. Bone. 2010;46(1):49‐63. [DOI] [PubMed] [Google Scholar]
- 12. Gaweda AE, McBride DE, Lederer ED, Brier ME. Development of a quantitative systems pharmacology model of chronic kidney disease: metabolic bone disorder. Am J Physiol Renal Physiol. 2021;320(2):F203‐F211. [DOI] [PMC free article] [PubMed] [Google Scholar]
- 13. Sutton RS, Barto AG. Reinforcement learning: an introduction. 2nd ed. The MIT Press; 2018:526 xxii. [Google Scholar]
- 14. Silver D, Huang A, Maddison CJ, et al. Mastering the game of Go with deep neural networks and tree search. Nature. 2016;529(7587):484‐489. [DOI] [PubMed] [Google Scholar]
- 15. Silver D, Schrittwieser J, Simonyan K, et al. Mastering the game of Go without human knowledge. Nature. 2017;550(7676):354‐359. [DOI] [PubMed] [Google Scholar]
- 16. Sammut C. Behavioral cloning. In: Sammut C, Webb GI, eds. Encyclopedia of Machine Learning. Springer US; 2010:93‐97. [Google Scholar]
- 17. Wiewiora E. Reward Shaping. In: Sammut C, Webb GI, eds. Encyclopedia of Machine Learning. Springer US; 2010:863‐865. [Google Scholar]
- 18. Kingma DP, Ba J. Adam: A Method for Stochastic Optimization 2014 December 01, 2014: [arXiv:1412.6980]. Available from: https://ui.adsabs.harvard.edu/abs/2014arXiv1412.6980K.
- 19. Breiman L, Breiman L. Classification and regression trees. First ed. Wadsworth International Group; 1984:358. [Google Scholar]
- 20. Bernardor J, Flammier S, Ranchin B, et al. Inhibition of osteoclast differentiation by 1.25‐D and the calcimimetic KP2326 reveals 1.25‐D resistance in advanced CKD. J Bone Miner Res. 2020;35(11):2265‐2274. [DOI] [PubMed] [Google Scholar]
- 21. Mary A, Objois T, Brazier M, et al. Decreased monocyte calcium sensing receptor expression in patients with chronic kidney disease is associated with impaired monocyte ability to reduce vascular calcification. Kidney Int. 2021;99(6):1382‐1391. [DOI] [PubMed] [Google Scholar]
- 22. Gaweda AE, Muezzinoglu MK, Jacobs AA, Aronoff GR, Brier ME. Model predictive control with reinforcement learning for drug delivery in renal anemia management. Conf Proc IEEE Eng Med Biol Soc. 2006;2006:5177‐5180. [DOI] [PubMed] [Google Scholar]
- 23. Brier ME, Gaweda AE, Dailey A, Aronoff GR, Jacobs AA. Randomized trial of model predictive control for improved anemia management. Clin J Am Soc Nephrol. 2010;5(5):814‐820. [DOI] [PMC free article] [PubMed] [Google Scholar]
Associated Data
This section collects any data citations, data availability statements, or supplementary materials included in this article.
Supplementary Materials
Appendix S1