

Abstract
Metacognition is the ability to weigh the quality of our own cognition, such as the confidence that our perceptual decisions are correct. Here we ask whether metacognitive performance can itself be evaluated or else metacognition is the ultimate reflective human faculty. Building upon a classic visual perception task, we show that human observers are able to produce nested, above-chance judgements on the quality of their decisions at least up to the fourth order (i.e. meta-meta-meta-cognition). A computational model can account for this nested cognitive ability if evidence has a high-resolution representation, and if there are two kinds of noise, including recursive evidence degradation. The existence of fourth-order sensitivity suggests that the neural mechanisms responsible for second-order metacognition can be flexibly generalized to evaluate any cognitive process, including metacognitive evaluations themselves. We define the theoretical and practical limits of nested cognition and discuss how this approach paves the way for a better understanding of human self-regulation.
Keywords: metacognition, perception, confidence, nested cognition, meta-metacognition
Introduction
Metacognition, the ability to monitor and report on the quality of our own cognitive processes, is essential for all forms of human behaviour, from decision-making (Balsdon et al. 2020) and information seeking (Desender et al. 2018) to learning (Guggenmos et al. 2016; Hainguerlot et al. 2018) and communication (Bahrami et al. 2012; De Martino et al. 2017). Impaired metacognition has been linked to multiple clinical conditions (Vaghi et al. 2017; Rouault et al. 2018), and metacognition-based treatments are proving promising (Wells 2008). Metacognitive judgements are also being implemented in artificial intelligence, where ‘learning to learn’ is becoming a foundation for complex functions (Wang 2021). Metacognitive ability is often assessed by asking for a confidence rating, which rates the likelihood that the decision was correct (Nelson 1990; Beran et al. 2012; Mamassian 2016; Fleming and Daw 2017). Visual perception tasks have been a valuable tool in studying metacognition, where the accuracy of confidence ratings (how certain an observer is that they made a correct decision) can be quantified using extensions of well-defined perceptual decision-making models (Mamassian 2016), in particular, Signal Detection Theory (SDT; Green and Swets 1966; Macmillan and Creelman 2005). A crucial domain of research has been determining the neural mechanisms of metacognition (Fleming and Daw 2017), which is thought to compute confidence as a ‘common currency’ (De Gardelle and Mamassian 2014) across tasks, modalities, and contexts, as a driving signal for adaptive behaviour.
There is an appealing advantage in not limiting metacognition to second-order judgements. A student who predicts they will perform well on an exam, and subsequently fails, would benefit not only from additional study but also from understanding why their confidence was miscalibrated. Future improvement requires assessing the quality of their confidence that they will perform well in the exam. Here, a judgement about the quality of their confidence represents a third-order decision. Repeating this process further can form nested decisions that might theoretically be extended to higher and higher orders. In this work, we will use the term ‘nested cognition’ to refer to any cognitive process or judgement targeting a preceding decision, excluding the first-order decision itself. In order to extend the notion of metacognitive ability to decisions beyond the second order, we will also use the generic term ‘nested cognitive ability’ to refer to the objective accuracy of any decision above the first order. While fourth- and higher-order judgements are arguably rarely encountered, third-order judgements are very common. In perceptual decision-making, perceptual confidence alone fails to distinguish between two equally important sources of uncertainty: a lack of sensory evidence and high levels of sensory noise (Zylberberg and Yang 2021). Despite low second-order confidence in both situations, information seeking is valuable in the first scenario, but useless in the second. A third-order signal, beyond confidence evidence, is required to arbitrate the appropriate behavioural response.
Based on current models of second-order judgements, it would not be a trivial task for an observer to compute higher-order decisions. The evidence used for second-order judgements does not strictly reduce to first-order sensory evidence, but can rely on additional processing (Baranski and Petrusic 1994; Pleskac and Busemeyer 2010), additional information (Denison et al. 2018), and incur additional noise (Shekhar and Rahnev 2021). Given that the previous literature suggests additional noise is inherent to the re-evaluation of the evidence used at the second order, one could hypothesize that this same limitation applies to third- and higher-order re-evaluations. In this case, there would be a steady decline in human behaviour relative to the ideal confidence observer (who does not incur additional noise beyond sensory noise) that would place a fundamental limit on the usefulness of nested cognition: at a certain point, the evidence being re-evaluated would be overwhelmed by noise and provide no useful distinction for guiding behaviour. In addition, some studies have found that observers retain only discrete confidence levels (high vs low confidence, Lisi et al. 2021; or several bins, Zhang et al. 2015), neglect evidence contrary to their decision (Peters et al. 2017), and compress uncertain information (Zhang and Maloney 2012). While these abbreviations of the evidence may be more efficient in terms of neural resources, they would severely impair third- (and higher-) order cognition. Evaluating higher-order cognition will provide evidence of the limits of the resolution of confidence evidence, and how fine-grained a resolution could be re-evaluated in nested cognition.
If the human capacity for third- and higher-order cognition were proven, it would place new constraints on the study of the neural mechanisms of metacognition. While second-order decisions have been proposed to require higher-order brain areas to integrate lower-order information (such as various subregions of the prefrontal cortex, see Vaccaro and Fleming (2018) for a review), it would be unrealistic to propose increasingly higher- and higher-order brain areas to achieve third- and fourth-order decision-making. Instead, higher-order cognition could reuse the same mechanisms in a nested manner. This brings into question how the information for recursively re-evaluating lower-order decisions can be progressively encoded and decoded in a useful way. An analogy can be drawn with the literature on Theory of Mind (ToM), where studying higher-order ToM (‘I think that you think that I think’) has been a pivotal step in examining the underlying neural mechanisms and their development (Gallagher and Frith 2003; Liddle and Nettle 2006).
Previous work has naturally concentrated on first-order decision-making and recently on second-order judgements, so far neglecting the very possibility of third- or even fourth-order cognition. Despite the above-mentioned advantage for such nested cognitive ability, a human’s capacity for higher-order decisions remains an issue waiting to be properly addressed. Yet, the empirical investigation of nested cognition would provide valuable insights into the understanding of the empirical limits of metacognition and the nature of metacognitive noise in decision-making. In the present work, we propose to tackle this question by combining a classic perceptual discrimination task with a succession of confidence reports: one confidence judgement for the precision of the perceptual discrimination, a second for the precision of the confidence judgement, and a third for the precision of this precision. Our main aim was to test the hypothesis that observers have the capacity to make reliable third- and fourth-order judgements and to investigate the potential suboptimalities affecting high-order cognition. We also wanted to assess how demanding recursive judgements could affect lower-order cognition. While such nested judgements might at first sound difficult to apprehend, we found—in addition to the classic second-order ability—evidence for above-chance third-order and even fourth-order judgements. These abilities likely rely on the recursive recruitment of a general metacognitive mechanism which must be capable of representing a sufficiently fine-grained representation of the lower-level evidence. However, computational modelling suggested at least two sources of noise affecting high-order cognition, which places an upper bound on nested cognition, making judgements beyond the fourth order unlikely to be usable in the real world.
Materials and methods
Experimental design
Participants
Participants were 12 experienced observers (including three of the authors), recruited by word of mouth. All participants had normal or corrected to normal vision and gave informed consent before beginning the experiment. Ethical approval for this experiment was granted by the local ethical committee (Comité d’Ethique pour les Recherches en Santé (CERES)).
Apparatus and stimuli
Participants sat 57 cm from a 24-inch (1280 × 720 pix) LCD monitor (ViewSonic), with their head supported by a chin rest. Stimuli were vertically oriented Gabor patches subtending 6°, presented at 35% Michelson contrast, centred 5° on either side of a central fixation dot. Stimulus presentation was controlled using MATLAB 2017b and the Psychophysics Toolbox (Brainard and Vision 1997; Pelli and Vision 1997; Kleiner et al. 2007).
Procedure
The first-order task was a two-alternative forced-choice (2AFC) task, where participants had to discriminate the spatial frequency of visual stimuli. On each trial, two Gabor patches were presented at either side of fixation (both vertically oriented, but with a random phase), and observers were asked to report which Gabor (left or right) was of lower spatial frequency. One Gabor was the standard, with a spatial frequency of 1 cyc/deg, while the other was the target with a lower spatial frequency corresponding to each observer’s discrimination threshold. The position of the standard and the target was pseudo-randomized from trial to trial, such that it was presented on the left and right with equal frequency. Each observer’s spatial frequency discrimination threshold (75% correct) was first estimated using an adaptive staircase procedure (accelerated stochastic approximation; Kesten 1958), with four interleaved staircases of 30 trials each (two starting at the minimum spatial frequency difference and two at the maximum). If the first run of staircases did not converge, a second run of the staircase procedure was performed.
The first experiment involved 800 trials of this first-order task, at threshold, while observers also reported second-, third-, and fourth-order decisions. The second-order decision was a standard metacognitive confidence rating: observers reported whether they had high or low confidence that they chose the correct Gabor. The third-order decision was a 2AFC confidence decision (Mamassian 2020) comparing two consecutive second-order decisions: after two consecutive trials of the first- and second-order judgements (spatial frequency discrimination and the confidence rating), observers chose which of the previous two second-order decisions better reflected their first-order performance. For simplicity, we will refer to the second-order decisions that were chosen as better reflecting the first-order performance as ‘chosen’, and the other decision as ‘declined’. Some scenarios were described to the observers to help them understand the third-order task. For example, ‘Imagine on one trial you were really uncertain, perhaps even guessing, and so you gave low confidence. Then on the next trial, you were more confident than on average, so you gave high confidence, but you weren’t very confident in this high confident judgement. At the third order, your first (low) confidence judgement is probably the better one and you should choose that.’ The fourth-order decision was another confidence rating, concerning the third-order decision: observers reported whether they had high or low confidence that they chose the best second-order rating. This full sequence of decisions is shown in Fig. 1A. The main task was completed in 16 blocks of 50 trials. Observers were encouraged to take breaks regularly, and the experiment was completed in ∼1 h.
Figure 1.

Task procedure and higher-order modulations of first-order performance (Experiment 1). (A) On each trial, the observer is presented with the stimulus for 500 ms and then cued to respond to whether the lower spatial frequency was presented on the left or the right. They then rated their confidence (high or low) that their decision was correct. Two consecutive trials (A and B) were used for the third-order decision, where observers chose the trial in which their confidence rating better reflected their first-order performance. They then rated their confidence (high or low) in this third-order decision. The input to each confidence decision is indicated with blue arrows. (B) Theoretical performance at the second order: trials rated with high confidence should have better first-order performance than trials rated with low confidence (distance from the diagonal). (C) Theoretical performance at the third order: chosen trials should better discriminate first-order performance than declined trials (declined trials should be closer to the diagonal). (D) Theoretical performance at the fourth-order: High-confidence trials should reflect better third-order decisions (there should be a greater difference in the distance from the diagonal for high confidence compared to low confidence). (E–G) Average performance of participants plotted in the same manner as the theoretical plots in (B–D). Error bars show the standard error of the mean
Experiments 2 and 3
To test whether asking participants to make higher-order decisions could affect their ability to perform at lower-order decisions, 10 participants returned to complete two additional experiments. The apparatus and stimuli were exactly the same as in Experiment 1. In Experiment 2, observers performed only the first- and second-order decisions. In Experiment 3, observers performed the first-, second-, and third-order decisions. However, the types of confidence reports in the second- and third-order decisions were swapped relative to Experiment 1: the second-order decision was a 2AFC confidence decision where observers chose the trial in which they were more likely to have chosen the correct Gabor, and the third-order decision was a rating of how certain observers were that they had chosen the best trial. Observers performed 400 trials of Experiment 2 and 800 trials (400 pairs) of Experiment 3.
Statistical analysis
Proportion correct
We first analysed the effect of high-order decisions on first-order decision accuracy. A generalized linear mixed effects model was used to examine the effect of higher-order decisions (high vs low second-order confidence; chosen vs declined third-order decisions; and high vs low fourth-order confidence) on first-order decision accuracy. However, this analysis does not account for response biases (nor for differences in first-order sensitivity).
Sensitivity
Proportion correct was normalized using the inverse of the standard cumulative Gaussian function for trials where the stimulus was presented on the left ( ) and right (
 ) separately. Sensitivity was calculated as the average of S1 and S2 trials (to account for interval bias—see Green and Swets 1966; Klein 2001), with a square root of 2 correction for the 2AFC design (Macmillan and Creelman 2005; since observers are provided with two independent samples of evidence for making their perceptual decision):
 |
(1) |
This measure gives an unbiased measure of performance that is properly scaled to examine differences in performance (a difference between 90% and 95% correct is much greater than a difference between 50% and 55% correct). The number of S1 and S2 trials,  and
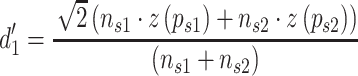
and  , was the same at the first order but could differ at higher orders. Performance in the second-order decision was quantified as:
 |
(2) |
where  is
is  on high-confidence second-order trials, and
  on low-confidence second-order trials. Following similar logic,
 |
(3) |
quantifies performance at the third-order decision, where C stands for chosen and D for declined trials. Finally, at the fourth order,
 |
(4) |
where H stands for high-confidence fourth-order trials, and L for low-confidence fourth-order trials.
Ideal confidence observer model
The difference in sensitivity an observer can achieve at a higher order is dependent on their perceptual sensitivity. Despite the initial staircase procedure, there were some differences in perceptual sensitivity across participants. To fairly compare participants, we scaled participants’ performance by the performance of an ideal confidence observer. The ideal confidence observer has access to a perfect representation of the distribution of the evidence used to make their perceptual decisions and uses this to compute the probability of a correct decision on each trial (in line with classical ideal observer principles; Geisler 1989). We take the minimal assumptions of SDT: on each trial, the observer receives two samples of evidence (from the stimuli presented on the left, S1, and the right, S2), where the mean difference in the strength of the evidence ( ) is disrupted by Gaussian noise of unit variance. The 2D distribution of evidence is shown in Fig. 2A. The observer chooses the stimulus with the greater evidence (or a difference in evidence greater than a biased criterion, for participants who have some interval bias).
Figure 2.

Theoretical decision evidence of the ideal confidence observer and ROCs. (A) The perceptual decision involves comparing two samples of evidence drawn from independent Gaussian distributions, the ideal confidence observer chooses the greater evidence. Hits and false alarms (distributions shown below) are defined as choosing interval S1 when the target stimulus was presented in S1 (hits) and S2 (false alarms). (B) The ideal second-order decision is made by comparing the absolute difference in the evidence for S1 and S2 to some criterion (c2) above which a high-confidence rating is given. Hits and false alarms (below) are defined as reporting high confidence when the first-order decision was correct and incorrect, respectively. (C) At the third order, the ideal confidence observer chooses the trial with greater second-order evidence. A hit was defined as choosing Trial A when the second-order decision on Trial A was correct (second-order hit or correct rejection), and a false alarm was defined as choosing Trial A when the second-order decision on Trial B was correct, trials with equal second-order decision accuracy were treated as half a hit and half a false alarm. (D) At the fourth order, the ideal confidence observer takes the absolute difference in the evidence for the two third-order intervals and compares this to a criterion (c4), allocating high confidence to evidence above the criterion. Hits and false alarms were then defined in the same manner as for second-order ratings. In (A–D), the markers show an example pair of trials. The filled marker corresponds to Interval 1 (Trial A), where the observer does have a lot of evidence in favour of S1; the open marker corresponds to Interval 2 (Trial B), where the observer does not have much more evidence for S1 than S2 (A). For the second-order decision (B), the evidence from Interval 2 just surpasses the criterion to give high confidence, while Interval 1 is definitely low confidence. For the third-order decision (C), the second-order evidence from Interval 1 (x-axis) is plotted against Interval 2 (y-axis). Perhaps counterintuitively, there is more evidence in favour of the low-confidence second-order decision (this was far from the criterion) in comparison with the high-confidence second-order decision for Interval 2 that only just surpassed the criterion. (D) Corresponding evidence for the fourth-order decision, which falls just short of high confidence. (E–H) Theoretical ROCs of an observer with a standard perceptual sensitivity (d′’ = 1) for first-order decision (E), who responds based on exactly the perceptual evidence (ideal confidence observer) at the second-order (F), third-order (G), and fourth-order (H) decisions. Curves were generated by incrementally adjusting the criteria and recalculating the hits and false alarms. The black points show the unbiased criteria (equal proportions of each response), which were used to generate the decisions for the next order. (I–J) ROCs for the ideal confidence observer with each participants’ perceptual sensitivity. Points show the hit and false alarm rates for individual participants (corresponding colours)
To estimate the metacognitive performance of the ideal confidence observer for each participants’ perceptual sensitivity, we simulated higher-order responses based on 10 000 samples of noisy sensory evidence for each trial (given the presented stimuli, the perceptual response of the observer and their underlying sensitivity and interval bias). Although the ideal confidence observer could make their metacognitive decisions using a number of different computations, the simplest description of consecutive confidence decisions is shown in Fig. 2B–D.
We then evaluated the ideal confidence observer’s performance according to Equations (2)–(4). The ratio of the participant compared to the ideal confidence observer gives an estimate of metacognitive performance that equates to perceptual sensitivity (see Supplementary Note S2). At the second order, this is equivalent to a measure of ‘metacognitive efficiency’ (meta-d′/d′; Maniscalco and Lau 2012; Fleming and Lau 2014).
Computational model
We used a simple computational model to examine the contributions of response bias and noise to participants’ behaviour. Aiming to take the minimal assumptions, the model estimated additional sensory noise to best maximize the probability of the participants’ higher-order decisions and set biased criteria to match the participants’ response tendencies. For the second- and fourth-order responses, the criteria were set to match the probability of a high- vs low-confidence rating. For the third-order task, we identified two forms of bias: a bias to choose the second interval over the first interval and a bias to choose the high-confidence second-order choice when a high-confidence rating was given on only one of the two intervals (for further details, see Supplementary Note S3).
The units of the noise were standardized across participants by first normalizing the perceptual decision evidence by the standard deviation of the perceptual noise. The evidence is then represented as being drawn from two Gaussian distributions of unit variance, with means separated by  . The standard deviation of the noise parameterized in the model is that added to the noise from the lower levels, further disrupting the representation of the evidence. In this way, the noise can be compared across participants, and across levels, where a higher value at a higher level suggests that whatever processing was responsible for the computation at the higher level incurred relatively more noise than at the lower level.
The model was fit hierarchically: first, to minimize the negative log-likelihood of the observer’s second-order responses given the presented stimuli, their perceptual decision, and the underlying perceptual decision noise (based on their sensitivity,  ); second, to minimize the negative log-likelihood of the observer’s third-order responses, given the pairs of stimuli, perceptual decisions, and second-order confidence ratings; and finally, to minimize the negative log-likelihood of the fourth-order responses, given the previous stimuli and responses.
The best fitting parameters were chosen as the median of the posterior of 50 iterations of Monte Carlo Markov Chains, taking 10 000 samples of Gaussian distributed noise, with the initial parameter sampled from N(1, 0.1) (truncated at 0). The parameters were constrained to [0.5, 5] (corresponding to half, and five times, the perceptual noise) to prevent local minima at unreasonable values. The fit was conducted using Bayesian adaptive direct search (Acerbi and Ma 2017; see Supplementary Note S5 for parameter recovery). The final model log-likelihood was calculated based on the probability of all four metacognitive responses (pairs of second-order followed by third- and fourth-order judgements), given the pairs of stimuli and perceptual decisions.
Results
We tested the ability of human participants (N = 12, 9 600 trials total) to recursively re-evaluate their decisions in a classic perceptual task. The first-order (perceptual) decision required observers to discriminate which of two Gabor patches (Fig. 1A), presented simultaneously to the left and right of fixation, had lower spatial frequency. Before beginning the experiment, a staircase procedure (accelerated stochastic approximation; Kesten 1958) was used to set the relative spatial frequency of the Gabors for each participant to produce ∼75% accuracy (average performance was 78% correct, 6%, SD). After each first-order response, observers made a second-order (metacognitive) decision, reporting high or low confidence that they chose the correct Gabor. Then, a third-order decision was made on a pair of consecutive first- and second-order responses: observers chose which confidence rating better reflected their first-order performance (confidence forced-choice paradigm). The second-order decisions chosen as better reflecting the first-order performance were labelled as ‘chosen’, and the other decision as ‘declined’ in the analyses. Finally, a fourth-order decision was made to rate high or low confidence in the third-order response (confidence that the third-order choice was the second-order rating that better reflected first-order accuracy). This sequence is depicted in Fig. 1A.
Nested cognitive ability up to the fourth order
Nested cognitive ability can be quantified based on relative performance in higher-order decisions: high-confidence perceptual decisions should be more likely to be correct than low-confidence decisions. Following this line of reasoning, chosen second-order decisions should be better than declined second-order decisions: there should be a greater difference in high- and low-confidence perceptual decision accuracy on chosen trials. This difference should be the greatest when observers report high confidence in their third-order choice. This theoretical pattern is shown in Fig. 1B–D: at the second order, there is greater perceptual decision accuracy for high compared to low-confidence trials (the average is above the diagonal); at the third order, chosen trials show better second-order decisions (the average is further from the diagonal than declined trials); and at the fourth order, high confidence better separates third-order decisions (there is a greater difference between chosen and declined trials with high than low confidence). This predicts an interaction between higher-order responses and perceptual decision accuracy.
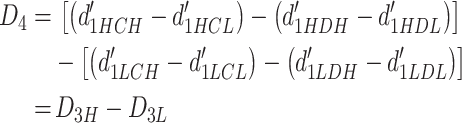
Figure 1E–G shows the average measured proportion correct in first-order decisions split by higher-order responses. We found a significant three-way interaction between higher-order responses and perceptual decision outcome (correct/incorrect) based on a generalized linear mixed effect model (including an intercept at the level of participant; Wald χ2(1) = 18.163, P < 0.01). We confirmed that even fourth-order responses significantly interact with lower-order performance by showing a significant improvement in the goodness-of-fit of the full model in comparison with a model only including up to the third-order responses (χ2(4) = 20.7, P < 0.01, ΔAIC = 13, ΔBIC = 16).
The participants were instructed at each higher order to re-evaluate the evidence with respect to the decision at the order below. Had participants been treating the higher-order judgements as additional second-order discriminations (setting additional criteria on the second-order evidence; Fig. 2B), their third-order choice would be the trial they felt more confident in: the more confident of two high-confidence trials or two low-confidence trials, or always the high-confidence trial where second-order confidence differed across the pairs. Participants would never choose a low-confidence second-order decision at the third order (this would be inconsistent with their interpretation of the instructions). That participants did not misinterpret instructions in this way is evident from the fact that all participants chose a low-confidence second-order response as more accurate than a high-confidence response on a substantial proportion of trials (on average, 34% of trials, ±15% SD; further details in Supplementary Note S1).
Quantifying higher-order cognition
The extent to which higher-order decisions can discriminate lower-order performance depends on lower-order performance itself (and ultimately, perceptual decision accuracy). To quantify higher-order performance within-subjects, we therefore compared human behaviour to a simple ideal confidence observer model (Geisler 1989). The ideal confidence observer was defined based on the minimal assumptions of SDT. On each trial, the observer compares a noisy sample of evidence from each Gabor and chooses the sample (S1 or S2) with more evidence for lower spatial frequency as their perceptual decision (Fig. 2A). The second-order confidence rating takes the absolute difference in evidence between the samples and allocates high confidence above a certain criterion (Fig. 2B). At the third-order, the ideal confidence observer chooses the trial where the evidence is further from their second-order criterion (Fig. 2C). They then allocate high confidence at the fourth order if the absolute difference in third-order evidence (between the two trials) exceeds their criterion (Fig. 2D).
This description allows us to define second-, third-, and fourth-order hits and false alarms, analogous to first-order hits (choosing S1 when S1 was the target stimulus) and false alarms (choosing S1 when S2 was the target stimulus). The receiver operating characteristics (ROCs), based on these definitions of hit and false alarm rates, are shown in Fig. 2E–H, for an ideal confidence observer with a first-order sensitivity (d′) of 1. Of note, the deviation of the ideal ROC away from the diagonal decreases with higher-order judgements. This trend highlights the inherent limit on the usability of recursive evaluation, even for the ideal observer. It also limits our ability to measure high-order cognition: up to 8 000 trials would be required to discriminate an ideal observer from a random observer at the fifth order with similar precision as the third order (see Supplementary Note S6). At the fourth order, 800 trials is sufficient so long as the observer’s first-order sensitivity is between 1 and 1.5 (all but three of our observers; Supplementary Note S6).
Figure 2I and J shows the hit and false alarm rates of participants compared to a simulated ideal confidence observer with each participants’ first-order sensitivity. Comparing the points to the respective curves shows that higher-order performance cannot be examined in isolation but must account for first-order sensitivity (see Supplementary Note S2 for more detail). The spread of the points across the theoretical curves also highlights the idiosyncratic response biases displayed by observers (see Supplementary Note S3 for more detail).
Both the cascading effect of first-order sensitivity and the response biases observed in Fig. 2I and J confirm the need to account for these effects when considering nested cognitive abilities. To quantify higher-order cognition independently of perceptual sensitivity, we can compare human observers’ performance relative to the ideal confidence observer with the same perceptual sensitivity and interval bias (simulated based on the distributions of evidence plotted in Fig. 2A–D). For the second-order decision, this is calculated as the difference in first-order sensitivity for high and low-confidence trials. For the third- and fourth-order decisions, we took the difference at the lower order in the same manner [Equations (1)–(4) in the ‘Materials and Methods’ section]. Participant performance is then divided by the performance of the ideal observer with the same first-order sensitivity (and first-order interval bias). A relative performance of 1 indicates that the participant performed as well as expected given their first-order performance; a relative performance of <1 indicates that the participant performed less well than expected; a relative performance of >1 indicates that they had greater insight into their lower-order decisions than predicted by their first-order performance; and a relative performance of <0 indicates that that their responses at a higher order predicted the opposite pattern of performance at the lower order (e.g. giving high confidence more frequently to incorrect than correct trials).
Two types of noise affecting human nested cognition
The performance of human observers relative to the ideal observer is plotted in Fig. 3A. There is a trend for decreasing relative performance with each re-evaluation. However, there are also interesting individual differences: for most observers, the decrease in relative performance is not linear, and for some observers, relative performance at the third or fourth order is better than at a lower order.
Figure 3.

Relative performance and modelled suboptimalities. (A) Performance of each participant (difference in lower-order sensitivity) relative to an ideal confidence observer with the same first-order sensitivity as the participant. Markers show individual participants, and the thick black line shows the average. The solid red line shows the average model prediction of the winning model, the dashed red line shows the model with constant noise at each re-evaluation. (B) Standard deviation of the perception-like and decision-like noise fitted to individual participants at each decision order. The unit is normalized across observers, such that it is relative to a perceptual decision space with unit variance. (C) Relative performance of participants in each decision order compared to the prediction from the fitted model parameters. Opaque markers show the second-order relative performance, semi-opaque markers show the third-order relative performance, and open markers show the fourth-order relative performance. (D) Difference in the BIC model for the model using a fine-grained evidence representation compared to a discrete evidence model with different numbers of bins. The thick black line shows the average. The open and closed red markers correspond to a 75% and 25% bias in bin limit placement, respectively. Colours correspond to the same participants across plots
We used a simple computational model to characterize these patterns of suboptimal behaviour for each observer. The model assumes that suboptimal responses result from additional (Gaussian distributed) noise disrupting the representation of the evidence used at each re-evaluation. To standardize the parameters so that they are comparable across participants, we first normalized the decision space such that the target and non-target stimulus evidence was drawn from Gaussian distributions with unit standard deviation (and means separated by  for each participant, normalized sensitivity—see Fig. 1A; Macmillan and Creelman 2005). The model accounted for response biases by fixing criteria to match the proportion of each response the participant gave (for third-order decisions, two biases were included: one describing the tendency to choose the second trial and another describing the tendency to choose the high-confidence second-order response; see Supplementary Note S3 for further details). The model was fit hierarchically to maximize the log-likelihood of each response at each decision order, given the responses at lower orders (for further details, see the ‘Materials and Methods’ section). By maximizing the log-likelihood of all responses, this model avoids the assumptions of fitting ROCs.
A single parameter, quantifying the standard deviation of the noise added at each re-evaluation, was unable to appropriately capture the data (this model predicted overall worse performance, in attempting to capture the greater noise at any order; the dashed red line of Fig. 3A predicts a continual decrease in relative performance with high-order decisions). Using three parameters to quantify the noise drawn from distributions with independent standard deviations at each re-evaluation was also inappropriate (this model predicts relative performance at a higher order cannot exceed relative performance at a lower order). The solution that best described the data was to assume different types of noise, allowing some noise to affect the decision without being carried on to the representation of the evidence at the next level. The model used three parameters to quantify the standard deviation of the total noise added to the representation of the perceptual evidence at each order, which was divided into ‘perceptual-like’ noise (affecting the representation of the evidence carried on to the next re-evaluation) and ‘decision-like’ noise (affecting the current output of the decision to the response without disrupting the evidence carried on to the next re-evaluation). ‘Decision-like’ noise was taken as the proportion of noise at a lower order that exceeded the noise at a higher order (see Supplementary Note S4 for further details). The exceedance probability of this model over the model with a single noise parameter and the model with additive independent noise was 0.59 (vs 0.31 for the single noise model and 0.09 for the model with no ‘decision-like’ noise; or protected exceedance probabilities of 0.38, 0.33, and 0.29 respectively; the mean BICs were 1859, 1856, and 1859, respectively). Model recovery analysis suggested that had observers’ behaviour been modulated by a single source of noise, the single parameter model would have been found superior to the three parameter models (winning 98.4% of simulations, with an average exceedance probability of 0.94, and protected exceedance probability of 0.82).
The standard deviations of the ‘perception-like’ and ‘decision-like’ noise fit to each observer are shown in Fig. 3B; these values represent the standard deviation of the noise added at each order to a perceptual decision space normalized to have unit variance (meaning the values are relative to the perceptual decision noise, such that comparisons across observers are unaffected by differences in first-order performance). The predictions of the model in comparison to human relative performance are shown in Fig. 3C. The stability of these parameter values within participants was measured using 10-fold resampling, showing the ratio of within-subject to between-subject variance to be on average 0.19, 0.31, and 0.20 at second-, third-, and fourth orders (more details in Supplementary Note S5).
The resolution of high-order evidence
Another possible source of suboptimality is whether the observer can maintain a fine-grained representation of the evidence, as suggested in previous work (Zhang et al. 2015; Lisi et al. 2021). Discretizing the decision evidence into several bins reduces the information observers have to maintain as they re-evaluate their performance. This would impair higher-order performance, especially at the third order, where observers may encounter pairs of trials with very little difference in the evidence. We therefore tested how fine-grained observers’ representation must be to explain their performance. We simulated a model with different numbers of uniform discretized evidence bins and compared the negative log-likelihood of participants’ responses to that of the model with a continuous representation of the underlying evidence. Averaged across participants, 50 discrete bins were required to meet the explanatory power of the continuous evidence model (Fig. 3D). Nonuniform (biased) bin limit placement could improve the description of behaviour based on discretized evidence, as demonstrated in the two-bin condition in Fig. 3D (open and closed discs in Fig. 3D indicate 75% and 25% bias in bin placement) but the full resolution model is still superior, and the additional parameters would not make this description parsimonious.
Limited retrospective effects of re-evaluation
Requesting high-order decisions could affect observers’ ability to perform at lower-order decisions: performance could suffer from increasing the cognitive resources required by the task; cognitive resources might be unevenly traded off across decision levels; or there could be a benefit from the additional attentional effort. We tested whether a third- or fourth-order task could affect performance in a second-order task by examining second-order performance in Experiment 2 (where the second-order task was performed without the third- and fourth-order tasks).
As shown in Fig. 4A, we observed some differences in perceptual performance across the three experiments. To investigate the effects of making higher-level judgements, we therefore used the computational model, which takes into account changes in first-order sensitivity and interval bias between experiments. Relative performance in the second-order decisions is plotted in Fig. 4B.
Figure 4.
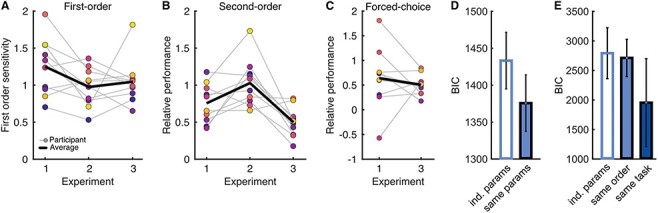
Results of Experiments 2 and 3. (A) First-order sensitivity (d′) across Experiments 1–3. (B) Relative performance in the second-order decision (participant divided by ideal) across Experiments 1–3 (where Experiments 1 and 2 used a confidence rating and Experiment 3 used a forced-choice confidence decision). (C) Relative performance in the forced-choice confidence task in Experiment 1 (third order) and Experiment 3 (second order). In (A–C), markers show individual subjects, with the average in the thick black line. (D) Average BIC of the model fitting independent parameters to responses at the second order in Experiment 2 (open bar), compared to using the same parameters as fit in Experiment 1 (filled bar). Error bars show 95% within-subject confidence intervals. (E) Average BIC of the model fitting independent parameters to responses at the second and third orders of Experiment 3 (open bar), compared to using the parameters fit to responses at the second and third orders of Experiment 1 (same order, light-filled bar) and the parameters fit to responses at the third and fourth orders of Experiment 1 (same tasks, dark-filled bar). Error bars show 95% within-subject confidence intervals
We found that the standard deviation of the noise fit to observers’ second-order responses in Experiment 1 was sufficient to describe their second-order responses in Experiment 2. This was a more parsimonious description of the data than employing an additional parameter quantifying independent noise in Experiment 2 (model exceedance probability > 0.99, protected exceedance probability = 0.95, with the average BICs of 1434 and 1376, as shown in Fig. 4D), meaning that second-order performance across experiments did not substantially vary, once differences in first-order performance were appropriately accounted for. Model recovery analyses suggested that these exceedance probabilities would only be possible with a true difference in parameters of <0.1, with evidence in favour of the independent noise model at differences of 0.21 (Supplementary Note S5). Thus, second-order performance was not substantially affected by requesting higher-order judgements: there were limited retrospective effects of re-evaluation.
Evidence for task-specific suboptimalities
In Experiment 1 we found that behaviour could not be described by a single additive noise parameter, but rather, each re-evaluation was accompanied by some additional ‘perception-like’ noise corrupting the evidence and a certain amount of noise affecting the output to response. These differences could be attributable to the order of evaluation or to the task required of the observer. We tested this in Experiment 3, where a forced-choice confidence judgement was used at the second order (as opposed to the third order). The relative performance in the forced-choice confidence task is shown for Experiment 1 (third order) in comparison to Experiment 3 (second order) in Fig. 4C.
We compared whether observers’ responses in Experiment 3 were more parsimoniously described by (i) independent parameters (two additional parameters fit to quantify the standard deviation of the total noise at the second and third orders); (ii) the parameters fit to the second- and third-order responses of Experiment 1 (different tasks but matching order of re-evaluation); or (iii) the parameters fit to the third- and fourth-order responses of Experiment 1 (same tasks but at different orders of re-evaluation). The parameters fit to the third- and fourth-order responses of Experiment 1 were the most parsimonious description of the responses at the second and third orders in Experiment 3 (model exceedance probability = 0.98, protected exceedance probability = 0.89, the average BICs of 2 795, 2 716, and 1 958, as shown in Fig. 4E). Model recovery analyses suggested that these exceedance probabilities would only be possible with a true difference in parameters of <0.1, with evidence in favour of the independent noise model at differences of 0.68 (Supplementary Note S5). This indicates that some of the noise affecting observers’ ability to re-evaluate their decisions is affiliated with task requirements. In combination with the evidence from Experiment 1, that some of the noise disrupting responses are not inherited at the next re-evaluation, this indicates that there are likely separable processes involved in metacognitive evaluations: one that encodes the decision evidence relevant for evaluating confidence (affected by ‘perception-like’ noise) and another that decodes this evidence for formulating the behavioural response (affected by ‘decision-like’ noise). While ‘perception-like’ noise quantifies the observers’ ability to accurately assess their own decision evidence, ‘decision-like’ noise could be due to independent factors such as working memory load, attention, or other factors leading to criterion instability, as opposed to nested cognitive ability per se.
Discussion
We found that human participants were not only able to accurately weigh their discrimination performance (second-order cognition) but also above chance in judging the accuracy of their metacognition (third-order cognition) and even the accuracy of their meta-metacognitive accuracy (fourth-order cognition). An ideal confidence observer model, constrained by participants’ individual perceptual sensitivity and bias, was used to quantify metacognitive sensitivity at each order of recursive metacognitive judgement. Most participants were below, albeit close to, ideal performance in their second-order judgements, and the gap increased for third- and fourth-order judgements. Computational modelling suggested that this ability relies on a fine-grained representation of the evidence, corrupted by both ‘perception-like’ noise and ‘decision-like’ noise. While the presence of additional nested judgements did not significantly alter performance, we found differences in performance between judgements types (rating vs 2AFC), suggesting that some aspects of nested cognition are dependent on the re-evaluation task. To gain a comprehensive understanding of individual observers’ metacognitive abilities, the use of multiple tasks, if not nested re-evaluations, may be required.
By examining metacognitive ability across consecutive nested re-evaluations, we found evidence supporting a model in which types of noise affect confidence judgements. This implies at least two subprocesses: the transformation of evidence and the following inference(s) for enacting behavioural responses. What evidence should be considered relevant for confidence depends on the situation, and the same confidence evidence can have different relevance for the following inference (80% confidence could be considered ‘high’ for playing Mario Kart, but ‘low’ for actually driving). Moreover, while in some situations high confidence means one should act more quickly and decisively, in other situations it could mean one should wait longer for a reward (Lak et al. 2014). The variety of behaviour metacognition supports might require various combinations of subprocesses, rather than a single pipeline. This could imply a network of brain regions flexibly recruited for multiple metacognitive subprocesses, according to the contextual demands. Thus, the challenge for researchers in metacognition is not only identifying neural and computational correlates of confidence but also isolating their function within the multiple processes contributing to the behavioural response, and defining which functions should count as truly metacognitive.
Our results highlight the fact that while there are different tasks and measures of meta—and nested—cognitive ability, ‘one size will not fit them all’. Higher-order performance was at least partially dependent on the re-evaluation task: the forced-choice confidence task appeared to be affected by greater noise but was also more resilient to bias (resulting in more consistent measures across experiments). Task requirements certainly play a role: in the forced-choice confidence task, there may be many difficult decisions where confidence is very similar across both trials of the pair, and the task can be taxing on working memory. Whereas for the confidence rating task, often the evidence is far from the confidence criteria and so easily classified, although some difficulty may arise from setting and maintaining appropriate criteria. Different requirements could also affect the quality of metacognitive evidence: our findings suggest a fine-grained representation of the evidence in nested cognition, contrary to some previous findings (Zhang et al. 2015; Lisi et al. 2021). Our results imply that the granularity of higher-order evidence can be maintained when task demands require it, or there is an appropriate incentive (Lebreton et al. 2018).
In this way, researchers should be mindful of task requirements and how these can affect estimates of metacognitive and nested cognitive ability. This is especially important when the aim is to relate metacognitive ability to other functions, traits, or conditions (e.g. ageing, Palmer et al. 2014; psychiatric disorders, David et al. 2012). An individual’s performance in a metacognitive task may depend on aspects of the task that should not be considered strictly metacognitive, such as the demands on working memory, their ability to maintain stable criteria, or—as shown in the present work—their incentive to maintain a fine-grained representation of the evidence.
We observed multiple limits to nested cognition. Beyond noise corruption, we found nested cognition to be limited by the reduction in available evidence, which is tied to the underlying first-order evidence. Very low first-order sensitivity limits the quality of the evidence available for re-evaluation, while very high first-order sensitivity limits the benefit of nested cognition (there is little difference in performance to discriminate at the higher order). This could be circumvented by the use of additional information or heuristics (e.g. attention; Denison et al. 2018; Recht et al. 2019). Further questions therefore include how, and how efficiently, humans adjudicate whether a decision deserves a re-evaluation or whether a different action is more appropriate (such as seeking additional sensory information).
This highlights an important area of further research in the field. Increasing the order of nested cognition inevitably comes with decreasing usefulness, which needs to be weighed against the resources required for these kinds of judgements. The detrimental use of nested judgements relates to a variety of maladaptive thinking patterns displayed in psychiatric disorders, such as over-rumination in depression and anxiety (which could be described as too much re-evaluation) and, at the opposite end, feelings of a lack of control in schizophrenia (which could be described as under-confidence at the third order, precluding further re-evaluation). While recent research into metacognitive behavioural therapy has shown promising applications in these conditions (Fisher and Wells 2008; Jordan et al. 2014; Lysaker et al. 2018; Nordahl et al. 2018), benefit may be gained not only from training metacognitive insight but also from learning when to apply re-evaluation.
Conclusion
The work reported here shows that second-order metacognitive judgements are part of a broader family of nested, inferential judgements. The use of recursive re-evaluations may well depend on both the limits inherent to sensory systems and the resource trade-offs imposed by task demands. It is crucial to better understand the neural mechanisms and computational architecture of nested (meta)cognition for translational applications, such as in psychiatry and artificial intelligence. We present here the first step in addressing this issue, demonstrating how the use of nested judgements can help us understand the nature of the evidence used for metacognitive decisions and disentangle different sources of suboptimalities in metacognitive decision-making.
Supplementary Material
Contributor Information
Samuel Recht, Department of Experimental Psychology, University of Oxford, Anna Watts Building, Woodstock Road, Oxford OX2 6GG, UK.
Ljubica Jovanovic, School of Psychology, University Park, University of Nottingham, Nottingham NG7 2RD, UK.
Pascal Mamassian, Laboratoire des Systèmes Perceptifs, DEC, ENS, PSL University, CNRS, 29 rue d'Ulm, Paris 75005, France.
Tarryn Balsdon, Laboratoire des Systèmes Perceptifs, DEC, ENS, PSL University, CNRS, 29 rue d'Ulm, Paris 75005, France; School of Psychology and Neuroscience, University of Glasgow, 62 Hillhead Street, Glasgow, Scotland G12 8QB, UK.
Supplementary data
Supplementary data is available at NCONSC online.
Data availability
The data for the experiments are freely available via the Open Science Framework: https://osf.io/jasyu/.
Funding
This work is supported by the French National Research Agency (ANR) grant ‘VICONTE’ ANR-18-CE28-0015 (PM) and the French ANR grant ‘FrontCog’ ANR-17-EURE-0017 (PM). Open access licence charges for this article were paid by Scottish institutions (SHEDL affiliated).
Author contributions
S.R., L.J., and T.B. participated in the conceptualization; S.R., L.J., T.B., and P.M. participated in the methodology; S.R., L.J., and T.B. participated in the investigation, formal analysis, and visualization; P.M. participated in the resources and funding acquisition; S.R., L.J., and T.B. participated in the writing—original draft; and S.R., L.J., T.B., and P.M. participated in the writing—review & editing.
Conflict of interest statement
The authors declare no competing interests.
References
- Acerbi L, Ma WJ. Practical Bayesian optimization for model fitting with Bayesian adaptive direct search. Adv Neural Inf Process Syst 2017;30. [Google Scholar]
- Bahrami B, Olsen K, Bang D. et al. What failure in collective decision-making tells us about metacognition. Philos Trans R Soc B 2012;367:1350–65. [DOI] [PMC free article] [PubMed] [Google Scholar]
- Balsdon T, Wyart V, Mamassian P. Confidence controls perceptual evidence accumulation. Nat Commun 2020;11:1–1. [DOI] [PMC free article] [PubMed] [Google Scholar]
- Baranski JV, Petrusic WM. The calibration and resolution of confidence in perceptual judgments. Percept Psychophys 1994;55:412–28. [DOI] [PubMed] [Google Scholar]
- Beran MJ, Perner J, Proust J eds. Foundations of Metacognition. Oxford University Press, 2012. [Google Scholar]
- Brainard DH, Vision S. The psychophysics toolbox. Spat Vis 1997;10:433–6. [PubMed] [Google Scholar]
- David AS, Bedford N, Wiffen B. et al. Failures of metacognition and lack of insight in neuropsychiatric disorders. Philos Trans R Soc B 2012;367:1379–90. [DOI] [PMC free article] [PubMed] [Google Scholar]
- De Gardelle V, Mamassian P. Does confidence use a common currency across two visual tasks? Psychol Sci 2014;25:1286–8. [DOI] [PubMed] [Google Scholar]
- De Martino B, Bobadilla-Suarez S, Nouguchi T. et al. Social information is integrated into value and confidence judgments according to its reliability. J Neurosci Res 2017;37:6066–74. [DOI] [PMC free article] [PubMed] [Google Scholar]
- Denison RN, Adler WT, Carrasco M. et al. Humans incorporate attention-dependent uncertainty into perceptual decisions and confidence. Proc Natl Acad Sci 2018;115:11090–5. [DOI] [PMC free article] [PubMed] [Google Scholar]
- Desender K, Boldt A, Yeung N. Subjective confidence predicts information seeking in decision making. Psychol Sci 2018;29:761–78. [DOI] [PubMed] [Google Scholar]
- Fisher PL, Wells A. Metacognitive therapy for obsessive–compulsive disorder: a case series. J Behav Ther Exp Psychiatry 2008;39:117–32. [DOI] [PubMed] [Google Scholar]
- Fleming SM, Daw ND. Self-evaluation of decision-making: a general Bayesian framework for metacognitive computation. Psychol Rev 2017;124:91. [DOI] [PMC free article] [PubMed] [Google Scholar]
- Fleming SM, Lau HC. How to measure metacognition. Front Hum Neurosci 2014;8:443. [DOI] [PMC free article] [PubMed] [Google Scholar]
- Gallagher HL, Frith CD. Functional imaging of ‘theory of mind’. Trends Cogn Sci 2003;7:77–83. [DOI] [PubMed] [Google Scholar]
- Geisler WS. Sequential ideal-observer analysis of visual discriminations. Psychol Rev 1989;96:267. [DOI] [PubMed] [Google Scholar]
- Green DM, Swets JA. Signal Detection Theory and Psychophysics. New York: Wiley, 1966. [Google Scholar]
- Guggenmos M, Wilbertz G, Hebart MN. et al. Mesolimbic confidence signals guide perceptual learning in the absence of external feedback. eLife 2016;5:e13388. [DOI] [PMC free article] [PubMed] [Google Scholar]
- Hainguerlot M, Vergnaud JC, De Gardelle V. Metacognitive ability predicts learning cue-stimulus associations in the absence of external feedback. Sci Rep 2018;8:1–8. [DOI] [PMC free article] [PubMed] [Google Scholar]
- Jordan J, Carter JD, McIntosh VV. et al. Metacognitive therapy versus cognitive behavioural therapy for depression: a randomized pilot study. Aust N Z J Psychiatry 2014;48:932–43. [DOI] [PubMed] [Google Scholar]
- Kesten H. Accelerated stochastic approximation. Ann Math Stat 1958;1:41–59. [Google Scholar]
- Klein SA. Measuring, estimating, and understanding the psychometric function: a commentary. Percept Psychophys 2001;63:1421–55. [DOI] [PubMed] [Google Scholar]
- Kleiner M, Brainard D, Pelli D. What’s new in Psychtoolbox-3? 2007.
- Lak A, Costa GM, Romberg E. et al. Orbitofrontal cortex is required for optimal waiting based on decision confidence. Neuron 2014;84:190–201. [DOI] [PMC free article] [PubMed] [Google Scholar]
- Lebreton M, Langdon S, Slieker MJ. et al. Two sides of the same coin: monetary incentives concurrently improve and bias confidence judgments. Sci Adv 2018;4:eaaq0668. [DOI] [PMC free article] [PubMed] [Google Scholar]
- Liddle B, Nettle D. Higher-order theory of mind and social competence in school-age children. J Cult Evol Psychol 2006;4:231–44. [Google Scholar]
- Lisi M, Mongillo G, Milne G. et al. Discrete confidence levels revealed by sequential decisions. Nat Hum Behav 2021;5:273–80. [DOI] [PubMed] [Google Scholar]
- Lysaker PH, Gagen E, Moritz S. et al. Metacognitive approaches to the treatment of psychosis: a comparison of four approaches. Psychol Res Behav Manag 2018;11:341–51. [DOI] [PMC free article] [PubMed] [Google Scholar]
- Macmillan NA, Creelman CD. Detection Theory: A User’s Guide, 2nd edn. New Jersey, USA: Lawrence Erlbaum Associates Inc., 2005. [Google Scholar]
- Mamassian P. Visual confidence. Annu Rev Vis Sci 2016;2:459–81. [DOI] [PubMed] [Google Scholar]
- Mamassian P. Confidence forced-choice and other metaperceptual tasks. Perception 2020;49:616–35. [DOI] [PubMed] [Google Scholar]
- Maniscalco B, Lau H. A signal detection theoretic approach for estimating metacognitive sensitivity from confidence ratings. Conscious Cogn 2012;21:422–30. [DOI] [PubMed] [Google Scholar]
- Nelson TO. Metamemory: a theoretical framework and new findings. In: Bower GH (ed.), Psychology of Learning and Motivation. Academic Press, 1990, Vol. 26, 125–73. [Google Scholar]
- Nordahl HM, Borkovec TD, Hagen R. et al. Metacognitive therapy versus cognitive–behavioural therapy in adults with generalised anxiety disorder. BJPsych Open 2018;4:393–400. [DOI] [PMC free article] [PubMed] [Google Scholar]
- Palmer EC, David AS, Fleming SM. Effects of age on metacognitive efficiency. Conscious Cogn 2014;28:151–60. [DOI] [PMC free article] [PubMed] [Google Scholar]
- Pelli DG, Vision S. The Videotoolbox software for visual psychophysics: transforming numbers into movies. Spat Vis 1997;10:437–42. [PubMed] [Google Scholar]
- Peters MA, Thesen T, Ko YD. et al. Perceptual confidence neglects decision-incongruent evidence in the brain. Nat Hum Behav 2017;1:1–8. [DOI] [PMC free article] [PubMed] [Google Scholar]
- Pleskac TJ, Busemeyer JR. Two-stage dynamic signal detection: a theory of choice, decision time, and confidence. Psychol Rev 2010;117:864. [DOI] [PubMed] [Google Scholar]
- Recht S, Mamassian P, De Gardelle V. Temporal attention causes systematic biases in visual confidence. Sci Rep 2019;9:1–9. [DOI] [PMC free article] [PubMed] [Google Scholar]
- Rouault M, Seow T, Gillan CM. et al. Psychiatric symptom dimensions are associated with dissociable shifts in metacognition but not task performance. Biol Psychiatry 2018;84:443–51. [DOI] [PMC free article] [PubMed] [Google Scholar]
- Shekhar M, Rahnev D. Sources of metacognitive inefficiency. Trends Cogn Sci 2021;25:12–23. [DOI] [PMC free article] [PubMed] [Google Scholar]
- Vaccaro AG, Fleming SM. Thinking about thinking: a coordinate-based meta-analysis of neuroimaging studies of metacognitive judgements. Brain Neurosci Adv 2018;2:2398212818810591. [DOI] [PMC free article] [PubMed] [Google Scholar]
- Vaghi MM, Luyckx F, Sule A. et al. Compulsivity reveals a novel dissociation between action and confidence. Neuron 2017;96:348–54. [DOI] [PMC free article] [PubMed] [Google Scholar]
- Wang JX. Meta-learning in natural and artificial intelligence. Curr Opin Behav Sci 2021;38:90–5. [Google Scholar]
- Wells A. Metacognitive therapy: cognition applied to regulating cognition. Behav Cogn Psychother 2008;36:651–8. [Google Scholar]
- Zhang H, Daw ND, Maloney LT. Human representation of visuo-motor uncertainty as mixtures of orthogonal basis distributions. Nat Neurosci 2015;18:1152–8. [DOI] [PMC free article] [PubMed] [Google Scholar]
- Zhang H, Maloney LT. Ubiquitous log odds: a common representation of probability and frequency distortion in perception, action, and cognition. Front Neurosci 2012;6:1. [DOI] [PMC free article] [PubMed] [Google Scholar]
- Zylberberg A, Yang T. Decision prioritization and causal reasoning in decision hierarchies. PLoS Comput Biol 2021;17:e1009688. [DOI] [PMC free article] [PubMed] [Google Scholar]
Associated Data
This section collects any data citations, data availability statements, or supplementary materials included in this article.
Supplementary Materials
Data Availability Statement
The data for the experiments are freely available via the Open Science Framework: https://osf.io/jasyu/.