Abstract
Purpose
This study proposes a method to draw attention toward the specific radiological findings of coronavirus disease 2019 (COVID-19) in CT images, such as bilaterality of ground glass opacity (GGO) and/or consolidation, in order to improve the classification accuracy of input CT images.
Methods
We propose an induction mask that combines a similarity and a bilateral mask. A similarity mask guides attention to regions with similar appearances, and a bilateral mask induces attention to the opposite side of the lung to capture bilaterally distributed lesions. An induction mask for pleural effusion is also proposed in this study. ResNet18 with nonlocal blocks was trained by minimizing the loss function defined by the induction mask.
Results
The four-class classification accuracy of the CT images of 1504 cases was 0.6443, where class 1 was the typical appearance of COVID-19 pneumonia, class 2 was the indeterminate appearance of COVID-19 pneumonia, class 3 was the atypical appearance of COVID-19 pneumonia, and class 4 was negative for pneumonia. The four classes were divided into two subgroups. The accuracy of COVID-19 and pneumonia classifications was evaluated, which were 0.8205 and 0.8604, respectively. The accuracy of the four-class and COVID-19 classifications improved when attention was paid to pleural effusion.
Conclusion
The proposed attention induction method was effective for the classification of CT images of COVID-19 patients. Improvement of the classification accuracy of class 3 by focusing on features specific to the class remains a topic for future work.
Keywords: COVID-19, Chest CT volume classification, Deep learning, Attention induction
Introduction
Coronavirus disease 2019 (COVID-19) is a viral infection that has caused a global pandemic since December 2019. Reverse transcription-polymerase chain reaction (RT-PCR) is usually used for clinical testing of SARS-CoV-2, which causes COVID-19. However, the RT-PCR test has limited sensitivity [1]. Therefore, radiological imaging techniques using X-ray and CT images have been attracting attention as a complement to RT-PCR tests [2]. The diagnosis of radiological images requires expert readers due to radiological findings specific to COVID-19, but the number of expert readers who can diagnose COVID-19 images precisely is scarce. In order to reduce the burden on experts, a computer-aided diagnosis system is required.
In the previous studies on image classification of COVID-19 pneumonia, deep-learning-based methods [3–5] have played an important role. In particular, convolutional neural network (CNN)-based methods were mainly used [6–10], where DenseNet121, ResNet50, ResNet101, Xception, and VGG19 were adopted to understand the relationship between an input image and output classes, such as COVID-19, community-acquired pneumonia, non-pneumonia, non-COVID-19, and healthy classes. However, these methods suffer from low classification accuracy because of difficulties in capturing global features of COVID-19 pneumonia, such as the bilaterality of ground glass opacity (GGO) [11], which distributes in both lungs. To focus on such features, several studies [12–16] introduced attention mechanisms into CNNs. Horry et al. [12] combined VGG-16 with spatial attention to obtain spatial features in chest X-ray images, thus enabling classification based on spatial information. Wang et al. [13] coupled two 3D-ResNets and extended them with prior-attention residual learning, where prior-attention maps were generated from the detection branch and used to guide the pneumonia type-classification branch to identify more discriminative representations for the pneumonia classification. Zhang et al. [14] created an end-to-end multiple-input deep convolutional attention network using a convolutional block attention module that can provide both spatial and channel attention. Maftouni et al. [15] integrated residual attention with DenseNet architectures by focusing on complementary, attention-aware, and global feature sets, in which the extracted features were stacked together and processed by a meta-learner to provide the final prediction. Nguyen et al. [16] proposed a method in which lesions and generated heat maps were integrated with the input image via an attention mechanism during the learning process to consider the spatial features of COVID-19. Although these attention-based approaches achieved higher performance, they had a common shortcoming: When attention is out of focus from the regions of interest (e.g., lesions), the classification failed. To tackle this problem, Mitsuhara et al. [17] proposed mechanisms to guide attention to targets, where they focused on the attention mechanism of an attention branch network [18] and fine-tuned it so that the attention map corresponded to manually edited ones. They applied this method to the ImageNet dataset to demonstrate its effectiveness.
This study proposes a novel method to incorporate radiological interpretation of a CT volume of COVID-19 pneumonia into the deep network, in which a CT volume is classified into four classes: 1. Typical appearance of COVID-19 pneumonia, 2. indeterminate appearance of COVID-19 pneumonia, 3. atypical appearance for COVID-19 pneumonia, and 4. negative for pneumonia [11]. To the best of our knowledge, this is the first study that brings attention to COVID-19-specific findings, such as the bilaterality of GGO and/or consolidation. The induction mechanism was inspired by a previous study [17]; however, we extended the mechanism by combining it with nonlocal blocks [19] to capture the global features of COVID-19, which are widely and symmetrically distributed in both lungs. An attention induction mechanism can be designed using lesion segmentation, which requires lesion annotation. On the contrary, the proposed method does not require annotation and captures COVID-19-specific radiological findings distributed in both the lungs. Moreover, we involved pleural effusion [9, 16] into the mechanism to improve the classification. We demonstrated the effectiveness of the proposed method by applying it to 1504 CT volumes.
Materials
The experiment was approved by the ethics committee of the Tokyo University of Agriculture and Technology (Approval No. 200705-0226). This study used chest CT volumes of 1504 cases collected by the Japan Radiological Society (JRS). Each case had a CT volume whose axial slice image was pixels, number of axial slice images per case distributed from 34 to 3376, and slice thickness ranging from 0.625 to 10 mm.
All the cases were diagnosed by an expert committee of the JRS with reference to the four classes reported in the study [11]. This paper focuses on the bilaterality of GGO, consolidation, and pleural effusion as specific radiological findings, wherein the bilaterality of GGO is typical of class 1, consolidation is mainly observed from classes 1–3, and pleural effusion is typically seen in class 3.
Figure 1 shows examples of CT images. The typical appearance of Fig. 1a shows multifocal GGO in the peripheral area of both lungs. Indeterminate appearance of Fig. 1b shows nonspecific imaging features of COVID-19 pneumonia. The atypical appearance exhibited in Fig. 1c has uncommon or unreported features of COVID-19 pneumonia and often shows smooth interlobular septal thickening with pleural effusion. Figure 1d presents no CT features suggestive of pneumonia.
Fig. 1.
Examples of CT images of four classes
The number of the cases of four classes is shown in Table 1.
Table 1.
Number of cases of four classes
| Class | 1 | 2 | 3 | 4 |
|---|---|---|---|---|
| Number of cases | 574 | 353 | 153 | 424 |
Three hundred and sixty-seven cases were collected before the COVID-19 epidemic, and 1137 cases were registered after the epidemic, including 237 cases from patients on the cruise ship Diamond Princess [20].
Method
Overview
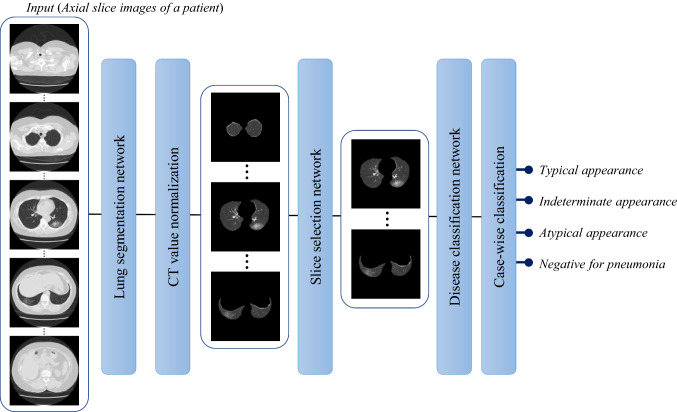
An overview of the system is shown in Fig. 2. First, the internal region of the parietal pleura is extracted, which is composed of the lung field and pleural effusion, and is known as a lung mask. Second, two different CT value normalizations are performed to enhance the lesions and pleural effusion. Third, axial slices with lesions and/or pleural effusions are selected by a slice selection network. Fourth, the system classifies the selected slices into four classes, as explained in the previous section. Finally, a case-wise classification is derived by computing the average probabilities for the four classes over all selected slices of a given case and selecting a class with the maximum average probability. Note that we designed the entire process as an axial slice image-wise process so that it can be applied even to cases with a single axial slice.
Fig. 2.
Outline of the proposed process
Extraction of lung mask [21]
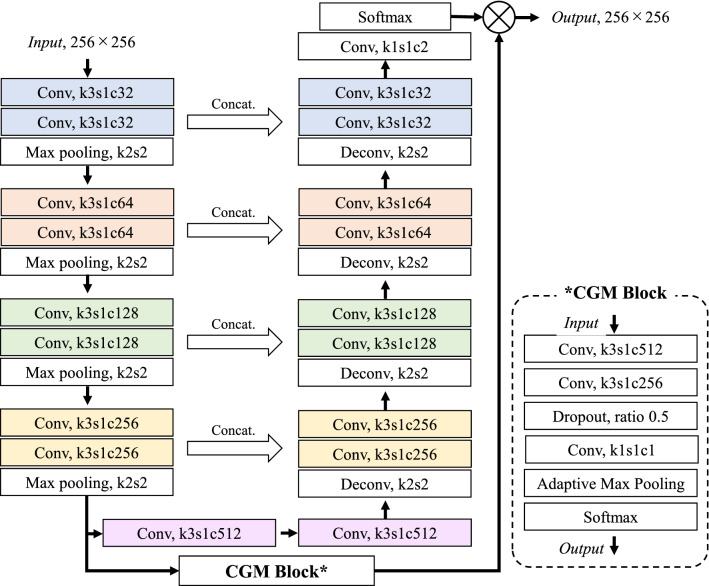
The lung mask was extracted from an axial slice image by a U-Net based model. Since a no new U-Net (nnU-Net) [22] suffers from false positives in a slice image that does not contain the lung, we introduced a classification-guided module (CGM) [23] that predicts whether the input image contains the lung. The network architecture of lung mask segmentation is presented in Fig. 3. The size of the input axial slice image was pixels, down-sampled to half the size of the original image. The network was trained using a combination of binary cross-entropy loss and Dice loss in a method previously described in a paper [23]. Output was a lung mask of pixels, which was forwarded to the slice selection network after being up-sampled to pixels.
Fig. 3.
Lung mask segmentation network that introduces CGM into nnU-Net
CT value normalization
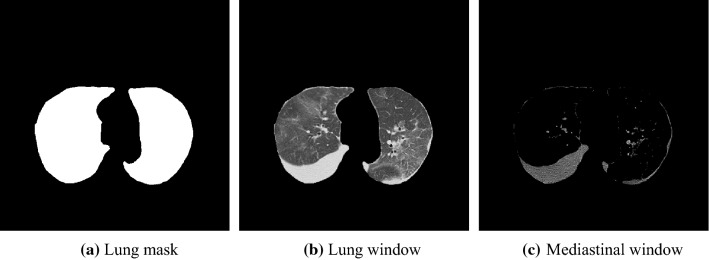
This study prepares two different normalization images referring to the display window setting in actual clinical situations, namely the lung (− 1250 to 250 H.U.) and mediastinal (− 140 to 260 H.U.) windows. Two images with different window settings were normalized from 0 to 1, and CT values outside the window range were clipped. Both images were forwarded to a slice selection network after computing the product of extracted lung mask and the normalized image, as shown in Fig. 4.
Fig. 4.
Examples of a lung mask (a), a normalized image by lung window (b) a normalized image by mediastinal window (c)
To stabilize the slice selection network, we rejected slice images with a very small lung mask. Specifically, we rejected a slice image with lung mask whose area was less than 5% of the whole area of axial slice ().
Slice selection network
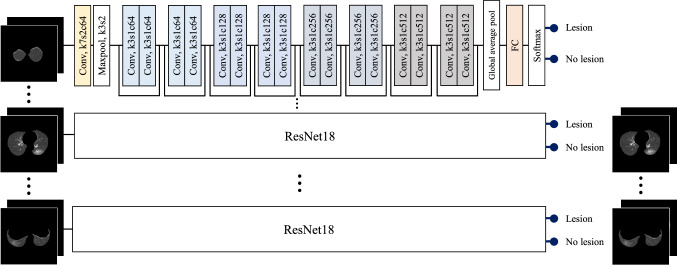
ResNet18 [24] was employed to predict whether an input axial slice image would include lesions. All slice images of a given case were independently processed as shown in Fig. 5. For a slice image, two images with different window settings were analyzed by the network, and only the slices judged as including lesions were forwarded to the next network or disease classification network. Note that if there is no slice image classified as having lesions, no image is processed by the subsequent network and the case is immediately classified as class 4, or “Negative for pneumonia.”
Fig. 5.
Slice selection network
Disease classification network
The inputs were axial slice images selected by the slice selection network, and the two images with different window settings were processed independently.
ResNet18 [24] was employed again for disease classification, modified to include nonlocal blocks with proposed attention induction mechanisms of COVID-19-specific findings.
The network architecture is presented in Fig. 6. Each slice image was independently processed by the modified ResNet18, and a feature vector of 512-dimension was extracted for each slice. Subsequently, a max-pooling operation integrated multiple feature vectors was extracted from multiple slices of a CT volume, and case-wise classification was carried out using a fully connected layer and a softmax operation.
Fig. 6.
Disease classification network
“Nonlocal block” and “Induction mask” sections explain the details of the proposed attention induction mechanism using nonlocal blocks.
Nonlocal block
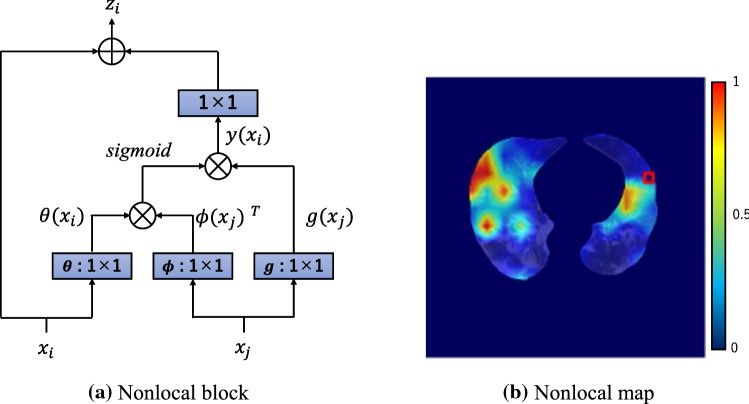
It is easy for a CNN to acquire local information, but difficult to acquire global information. A nonlocal block [19], shown in Fig. 7, was developed to solve this problem. A nonlocal block projects the data into a feature space by convolution denoted as, and in Fig. 7a, where denotes a CT value at pixel of interest (POI), is a CT value at different pixels , and is a set of indices of pixels in a lung mask. A nonlocal block finds pixels that relate to the POI by evaluating dot-product similarity between and.
| 1 |
Fig. 7.
Architecture of a nonlocal block and an example of nonlocal map, where red is 1 and blue is 0
After applying a sigmoid function, a production with is computed (see Eq. (2)) and the output of Eq. (3) is computed by affine transformation of .
| 2 |
| 3 |
where represents a weight tensor of convolution. Figure 7b shows a nonlocal map given denoted by a red square.
Induction mask
The difficulties of attention induction are mainly caused by two aspects: CT values of GGOs and consolidation which are highly diverse, and the lesions being symmetrically distributed in both lungs. Considering the first aspect, we propose to generate an adaptive mask according to the CT value of POI so that the generated mask focuses on regions whose appearance is similar to . In addition, the proposed method induces attention on a region symmetric to the POI. Unlike a previous study [17] that edited the mask manually, we automated the mask generation process in the following three steps that met the abovementioned requirements.
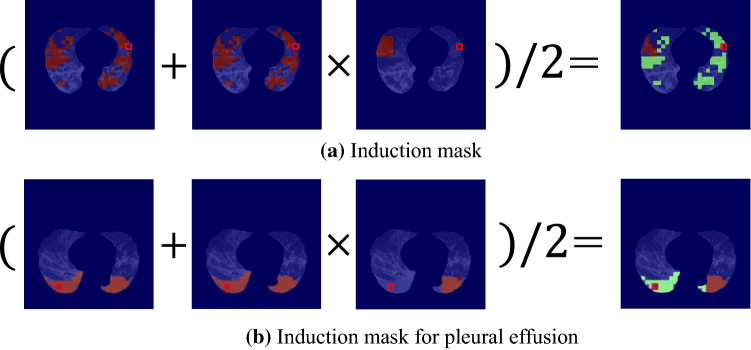
In the first step, since the size of a nonlocal map is pixels, an original CT image is downsized using a median filter of pixels, followed by down-sampling of 16-pixel intervals. Subsequently, a similarity mask is generated for each POI of H.U. so that pixels with CT values ranging from H.U. to H.U. are set to 1, as presented in Fig. 8a, in which is a constant value that will be optimized in the experimental section.
Fig. 8.
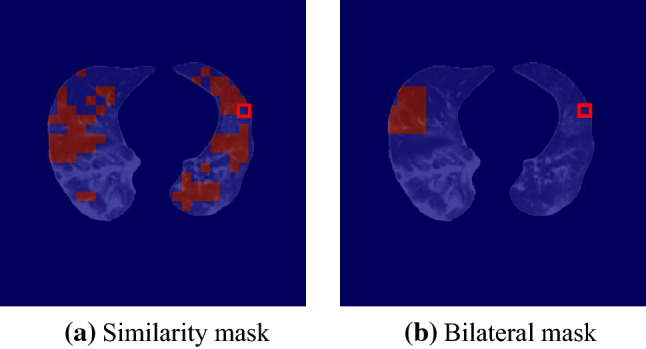
Examples of similarity masks and bilateral masks. Pixels that show similar appearance ( with POI (red square) are set as 1 in the similarity mask and pixels that are nearly symmetrical to POI are set to 1 in the bilateral mask
The second step generates a mask focusing on the opposite side of lung, known as a bilateral mask. We assumed that lungs were nearly symmetrical with respect to the center of the slice image. Pixels that are symmetric to POI with respect to the center of a down-sampled image were set as 1. Size of a symmetric region was pixels in a down-sampled image, and the region is limited in a lung mask. Figure 8b shows an example of a bilateral mask where POI is given as a red square.
The third step merged a similarity mask and a bilateral mask by a pixel-wise product operation, followed by a pixel-wise average operation between the mask by the product operation and the similarity mask to generate an induction mask (see Fig. 9a). Note that an induction mask was generated for POI and the total number of induction masks for a slice image is equal to the size of a set .
Fig. 9.
Examples of induction masks (right side of equations) generated from a similarity mask and a bilateral mask. Red pixel’s value is 1, and green pixel’s value is 0.5. POI is indicated by a red square
As mentioned in the introduction section, pleural effusion is an important radiological finding for performing the four-class classification. The proposed method induces attention on pleural effusion when a POI belongs to pleural effusion. We limited the above mask generation process inside a mask of pleural effusion when POI was included in pleural effusion.
Loss function for attention induction
We minimize the mean square difference between the nonlocal map (e.g., Fig. 7b) and induction mask (e.g., Fig. 9).
| 4 |
This study combined the proposed with cross-entropy loss of Eq. (5) for classification.
| 5 |
where denotes predicted probability of class , indicates true label of class , and denotes number of classes. Total loss function employed in this study is as follows:
| 6 |
Experiment
Performance indices
This study employed three different types of classification accuracy. Four-class classification accuracy was the most detailed performance index. In addition, we evaluated two different types of two-class classification accuracy, namely COVID-19 classification accuracy and pneumonia classification accuracy. COVID-19 classification accuracy evaluates classification performance where classes 1 and 2 are defined as a COVID-19 class, and classes 3 and 4 are considered as others. Pneumonia classification accuracy is defined such that classes 1, 2, 3 are pneumonia class and class 4 is others. Note that all accuracies were estimated by n-fold cross-validation (CV), in which the dataset was divided into n groups, and n − 1 groups were used for training. The remaining group was divided into two subgroups and used for validation and testing. Data division in n-fold CV was consistent for all processes, which means that data for training the lung mask segmentation network were also used for training the slice selection network and the disease classification network.
Experimental design
We conducted three experiments. The first experiment optimized parameter to generate a similarity mask using a part of our dataset. The second carried out a larger-scale classification experiment using 1504 cases with the optimized parameter . The third was performed to evaluate the effectiveness of attention induction for pleural effusion.
Optimization of parameter
A grid search strategy was employed to optimize the parameter, changing it from 25 to 200 H.U. with 25 H.U. interval. We performed experiments in a threefold CV of 247 cases to reduce computational cost. The lung mask segmentation network used He’s initialization [25]. Maximum number of epochs was set to 100, and the mini-batch size was 32. For the slice selection and disease classification networks, we employed pre-trained ResNet-18 distributed in the torchvision package [26]. Maximum number of epochs was set to 300, and the mini-batch size was 1. Weight of the loss function of the disease classification network was set to . Adam optimizer [27] was applied with β1 = 0.9 and β2 = 0.999, and a learning rate of . All networks were implemented using PyTorch and trained on an NVIDIA Tesla V100 GPU with 32 GB memory. Optimal training epochs for three different networks were selected sequentially such that the performance on validation data was maximum.
Table 2 shows disease classification accuracy using 247 cases, in which 175 of gives best performance in terms of four-class classification and COVID-19 classification.
Table 2.
Disease classification accuracy using 247 cases
| 25 | 50 | 75 | 100 | 125 | 150 | 175 | 200 | |
|---|---|---|---|---|---|---|---|---|
| Four-class | 0.6235 | 0.6275 | 0.6220 | 0.6397 | 0.6356 | 0.6559 | 0.6559 | 0.6275 |
| COVID-19 | 0.7652 | 0.7733 | 0.7602 | 0.7733 | 0.7692 | 0.7692 | 0.7935 | 0.7814 |
| Pneumonia | 0.8381 | 0.8623 | 0.8618 | 0.8421 | 0.8623 | 0.8462 | 0.8502 | 0.8462 |
Bold numerals show the best performance in terms of for each performance indices
We compared classification performance between a conventional attention network that combines ResNet18 with nonlocal blocks, and the proposed attention induction network with the optimized parameter. Table 3 presents the disease classification accuracies, and Table 4 shows confusion matrices.
Table 3.
Comparison using 247 cases between a conventional attention network (ResNet18 + Nonlocal block) and the proposed attention induction network
| ResNet18 + nonlocal block | Proposed attention induction network () | |
|---|---|---|
| Four-class | 0.5789 | 0.6559 |
| COVID-19 | 0.7692 | 0.7935 |
| Pneumonia | 0.8502 | 0.8502 |
Table 4.
Confusion matrices of a conventional attention network (ResNet18 + Nonlocal block) and the proposed attention induction network
| Prediction | ||||
|---|---|---|---|---|
| Class 1 | Class 2 | Class 3 | Class 4 | |
| (a) ResNet18 + nonlocal block | ||||
| True | ||||
| Class 1 | 57 | 17 | 2 | 4 |
| Class 2 | 24 | 35 | 6 | 15 |
| Class 3 | 4 | 14 | 5 | 5 |
| Class 4 | 4 | 8 | 1 | 46 |
| (b) Proposed attention induction network() | ||||
| True | ||||
| Class 1 | 63 | 11 | 3 | 3 |
| Class 2 | 15 | 46 | 5 | 14 |
| Class 3 | 3 | 11 | 8 | 6 |
| Class 4 | 4 | 8 | 2 | 45 |
Table 3 indicates the superiority of the proposed attention induction network against the conventional attention network. Four-class classification accuracy was improved by 7.7 pts. Table 4 shows that classification accuracy of classes 1 and 2 was largely improved. McNemar test [28] was applied to evaluate the differences. Null hypothesis (there is no difference between a conventional attention network and the proposed attention induction network) was rejected for four-class classification accuracy and COVID-19 classification accuracy at the 5% level of significance (, ).
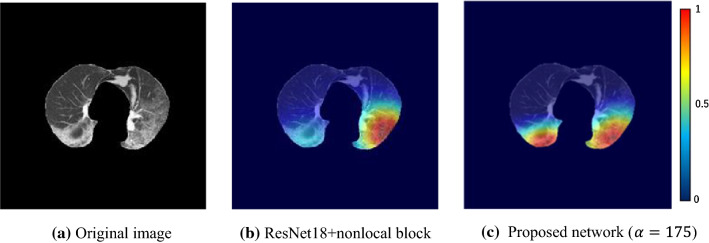
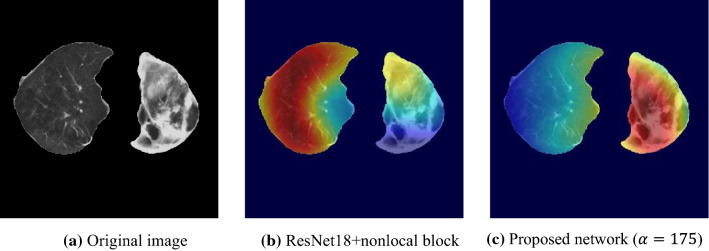
Figure 10 presents an example of class 1, where prediction by a conventional attention network is class 2 and that of the proposed attention induction network is class 1. Color maps generated by a grad-CAM [29] are localization maps highlighting important regions in an image for predicting the class. As it is visualized, a conventional network mainly focuses on lesions of the left lung, while the proposed network highlights lesions symmetrically distributed over both lungs, leading to the correct class.
Fig. 10.
Visualization of attention area of class 1 using grad-CAM, where red is 1, and blue is 0
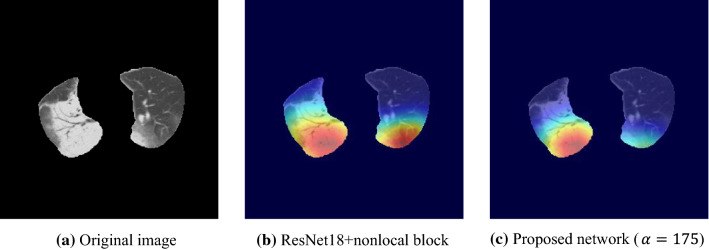
Figure 11 shows a case of class 2, where the lesions are mainly distributed in right lung. The visualization map of a conventional attention network (predicted class 1) focuses on both lungs, resulting in mis-classification. In contrast, the proposed attention induction network (predicted class 2) mainly highlights the high-intensity lesions of right lung.
Fig. 11.
Highlighted regions of a case of class 2 visualized by grad-CAM
Figure 12 shows a case of class 3, where the lesions distribute asymmetrically. A conventional attention network predicts as class 2, while the proposed attention induction network mainly focuses on lesions of left lung, resulting in correct classification.
Fig. 12.
Visualization of attention area of a case of class 3 using grad-CAM
Ablation study to confirm the effectiveness of nonlocal block and each process
First, we conducted an ablation study by removing the nonlocal block. The classification accuracy of ResNet18 was 0.5628 for four-class classification, 0.7449 for COVID-19 classification, and 0.8502 for pneumonia classification, all of which were slightly lower or equal to those of ResNet18 with nonlocal block in Table 3. The results suggest that the vanilla nonlocal block did not significantly change the performance; however, large improvements were achieved by combining the nonlocal block with the proposed attention induction as shown in Table 3.
Second, an ablation study was performed on 247 cases to confirm the effectiveness of each process in Fig. 2. Each process was removed individually from the proposed attention induction network . The results and the McNemar test (H0: there was no difference in classification accuracy between the proposed and ablated models) are shown in Table 5. It is notable that the network implementation details are exactly the same as the “Optimization of parameter ” subsection.
Table 5.
Ablation study of the proposed attention induction network
| (w/o) Lung segmentation | (w/o) Normalization by mediastinal window | (w/o) Normalization by lung window | (w/o) Slice selection | |
|---|---|---|---|---|
| Four-class | 0.4939** | 0.5951** | 0.4773** | 0.5263** |
| COVID-19 | 0.7247** | 0.7895 | 0.6599** | 0.7045** |
| Pneumonia | 0.8178* | 0.8502 | 0.8178** | 0.7733** |
*p < 0.05; **p < 0.01
This result suggests that each process was mandatory to achieve the best performance in the four-class classification. On the contrary, CT value normalization by the mediastinal window might not be necessary for COVID-19 and pneumonia classification. However, the other processes were found to be effective in achieving the best performance.
Classification using 1504 cases with optimized parameter
The network implementation details are exactly the same as the experiment “Optimization of parameter ,” except for the number of cases, and the performance was evaluated by fivefold CV with the optimized parameter .
Tables 6 and 7 show disease classification accuracy and confusion matrix of the proposed attention induction network with the optimized parameter.
Table 6.
Classification accuracy of the proposed attention induction network ()
| Proposed attention induction network () | |
|---|---|
| Four-class | 0.6443 |
| COVID-19 | 0.8205 |
| Pneumonia | 0.8604 |
Table 7.
Confusion matrix of the proposed attention induction network ()
| Prediction | ||||
|---|---|---|---|---|
| Class 1 | Class 2 | Class 3 | Class 4 | |
| True | ||||
| Class 1 | 477 | 77 | 13 | 7 |
| Class 2 | 118 | 124 | 45 | 66 |
| Class 3 | 26 | 46 | 48 | 33 |
| Class 4 | 8 | 59 | 37 | 320 |
The classification accuracy of 1504 cases in Table 6 is similar to that of 247 cases in Table 2. A slight decrease in four-class classification accuracy was accounted by the lower classification accuracy of class 2 (Table 7), in which many cases were misclassified as class 1. Note that such mis-classifications do not affect the COVID-19 classification accuracy when classes 1 and 2 are defined as a COVID-19 class, and classes 3 and 4 are considered as others, resulting in high accuracy for COVID-19 and pneumonia classification.
Figure 13 shows the attention areas of cases of classes 1, 2, 3, and 4. Highlighted regions of classes 1, 2, and 3 seem to correspond to lesions correctly, while the proposed network focuses on whole lungs of class 4. The attention area of class 4 can be accounted by the proposed method inducing attention to regions with similar appearance of POI. The appearance of lung field without lesions is similar everywhere.
Fig. 13.
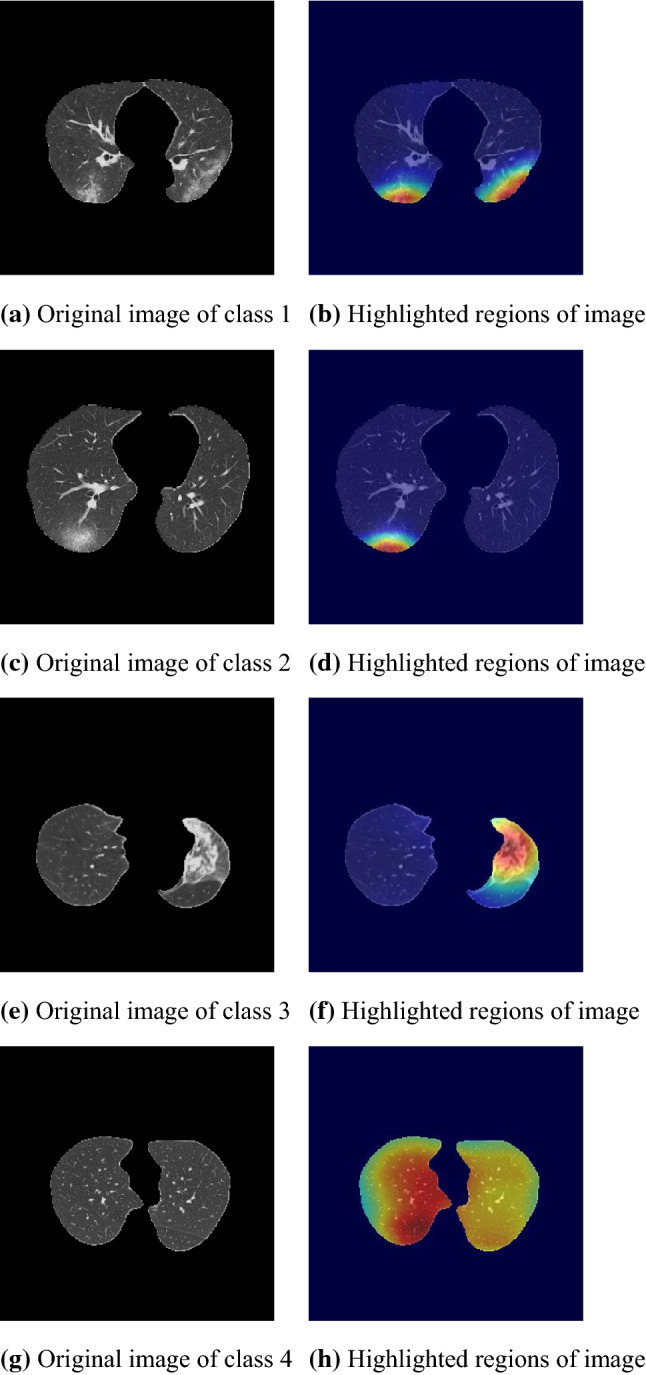
Visualization of attention areas of the proposed network ()
Attention induction to pleural effusion
We incorporated pleural effusion [9, 16] into the proposed attention induction mechanism to improve the classification. Network implementation details are exactly the same as the experiment of “Classification using 1504 cases with optimized parameter α” section except for attention to pleural effusion explained in “Induction mask” section.
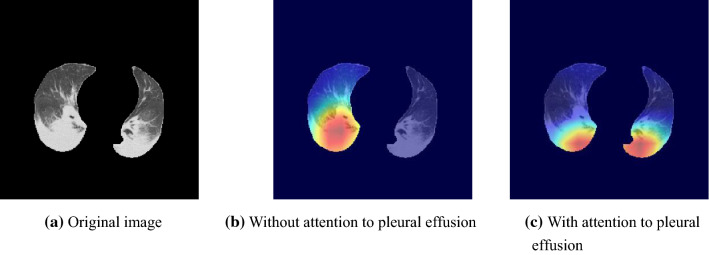
Accuracies of the four-class, COVID-19, and pneumonia classifications were 0.6689, 0.8358, and 0.8544, respectively. The four-class and COVID-19 accuracies were improved and significantly differed from the network without attention induction to pleural effusion ( and ). Figure 14 demonstrates that the proposed attention induction succeeded in focusing the pleural effusion in both lungs.
Fig. 14.
Visualization of attention areas of the proposed network () without and with attention induction to pleural effusion
Discussion and conclusion
This paper proposed an attention induction method for the classification of CT images of COVID-19 that achieved a higher four-class classification accuracy than a conventional attention network by 7.7 pts (p < 0.01) when using 247 cases. A large-scale experiment using 1504 cases demonstrated the high classification accuracy as well as the effectiveness of attention to pleural effusion.
The advantage of the attention induction network is its focus on COVID-19-specific radiological findings, such as the bilaterality of GGO and/or consolidation. As presented in Figs. 10, 11, 12 and 13, the network focuses on lesions symmetrically distributed over both lungs of class1 in Figs. 10c and 13b. Notably, the network can adaptively change the attention area depending on lesions. Figures 11c, 12c and 13d, f are examples of focusing on asymmetrically distributed lesions with a variety of CT values. In contrast, the conventional attention network focused on a part of the lesion in Fig. 10b, or on both lesions and healthy regions in Figs. 11b and 12b, which is inconsistent. We suppose that the appropriate flexibility of the proposed method is caused by the similarity mask generation process, which adaptively selects pixels similar to the POI.
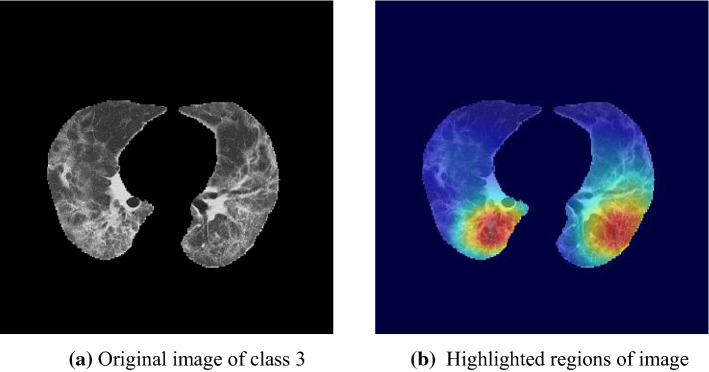
A limitation of the proposed system is low classification accuracy in class 3 (Atypical appearance for COVID-19 pneumonia). Figure 15 presents an example of class 3, where lesions are distributed symmetrically in both lungs. The proposed attention induction network focused on symmetrical regions, but failed to detect the detailed difference in appearance between classes 1 and 3, resulting in being classified as class 1.
Fig. 15.
Visualization of attention area of a case of class 3 that shows limitations of the proposed method
Future work should include the improvement of classification accuracy of class 3 by focusing on features specific to class 3, such as consolidation without GGO, mass lesions, and pleural effusion. Exploring an integration operation in a disease classification network other than a max-pooling operation is an interesting topic for future work. An examination using a larger-scale dataset remains an important consideration for future research. Classification using not only CT images but also meta-clinical information will be a challenging task in future. Another challenge is to employ a Bayesian optimization approach when optimizing the hyperparameters over a wider search space.
Acknowledgements
This research used the dataset of J-MID of JRS (AMED: JP20lk1010025) and Japan Agency for Medical Research and Development (JP20lk1010036).
Declarations
Conflict of interest
The authors declare that they have no conflict of interest.
Ethical approval
All procedures performed in studies involving human participants were in accordance with the ethical standards of the institutional and/or national research committee and with the 1964 Helsinki declaration and its later amendments or comparable ethical standards.
Informed consent
We applied opt-out method to obtain consent.
Footnotes
Publisher's Note
Springer Nature remains neutral with regard to jurisdictional claims in published maps and institutional affiliations.
Contributor Information
Yusuke Takateyama, Email: s216965t@st.go.tuat.ac.jp.
Akinobu Shimizu, Email: simiz@cc.tuat.ac.jp.
References
- 1.Yicheng F, Huangqi Z, Jicheng X, Minjie L, Lingjun Y, Peipei P, Wenbin J. Sensitivity of chest CT for COVID-19: comparison to RT-PCR. Radiology. 2020;296:E115–E117. doi: 10.1148/radiol.2020200432. [DOI] [PMC free article] [PubMed] [Google Scholar]
- 2.Xingzhi X, Zheng Z, Wei Z, Chao Z, Fei W, Jun L. Chest CT for typical 2019-nCoV pneumonia: relationship to negative RT-PCR testing. Radiology. 2020;296:E41–E45. doi: 10.1148/radiol.2020200343. [DOI] [PMC free article] [PubMed] [Google Scholar]
- 3.Hamed T, Amir M, Akos S, Imre F, Laszlo N (2021) Rapid COVID-19 diagnosis using deep learning of the computerized tomography scans. In: CANDO-EPE
- 4.Ming X, Liu O, Lei H, Kai S, Tingting Y, Qian L, Hua T, Lida S, Hengdong Z, Yue G, Forrest S, Yuanfang C, Patrick R, Yaorong G, Baoli Z, Jie L, Shi C. Accurately differentiating between patients with COVID-19, patients with other viral infections, and healthy individuals: multimodal late fusion learning approach. J Med Internet Res. 2021;22:1–17. doi: 10.2196/25535. [DOI] [PMC free article] [PubMed] [Google Scholar]
- 5.Xing G, Yu Z, Siyuan L, Zhihai L. A survey on machine learning in COVID-19 diagnosis. CMES Comput Model Eng Sci. 2021;130:23–71. [Google Scholar]
- 6.Stephanie AH, Thomas HS, Sheng X, Evrim BT, Holger R, Ziyue X, Dong Y, Andriy M, Victoria A, Amel A, Maxime B, Michael K, Dilara L, Nicole V, Stephanie MW, Ulas B, Anna MI, Elvira S, Guido GP, Giuseppe F, Cristiano G, Giovanni I, Dominic L, Dima H, Ashkan M, Elizabeth J, Ronald MS, Peter LC, Daguang X, Mona F, Kaku T, Hirofumi O, Hitoshi M, Francesca P, Maurizio C, Gianpaolo C, Peng A, Bradford JW, Baris T. Artificial intelligence for the detection of COVID-19 pneumonia on chest CT using multinational datasets. Nat Commun. 2020;11:1. doi: 10.1038/s41467-020-17971-2. [DOI] [PMC free article] [PubMed] [Google Scholar]
- 7.Lin L, Lixin Q, Zeguo X, Youbing Y, Xin W, Bin K, Junjie B, Yi L, Zhenghan F, Qi S, Kunlin C, Daliang L, Guisheng W, Qizhong X, Xisheng F, Shiqin Z, Juan X, Jun X. Using artificial intelligence to detect COVID-19 and community-acquired pneumonia based on pulmonary CT: evaluation of the diagnostic accuracy. Radiology. 2020;296:E65–E71. doi: 10.1148/radiol.2020200905. [DOI] [PMC free article] [PubMed] [Google Scholar]
- 8.Ali A, Alireza R, Rajendra A, Nazanin K, Afshin M. Application of deep learning technique to manage COVID-19 in routine clinical practice using CT images: Results of 10 convolutional neural networks. Comput Biol Med. 2020;121:103795. doi: 10.1016/j.compbiomed.2020.103795. [DOI] [PMC free article] [PubMed] [Google Scholar]
- 9.Sachin S. Drawing insights from COVID-19-infected patients using CT scan images and machine learning techniques: a study on 200 patients. Environ Sci Pollut Res. 2020;27:37155–37163. doi: 10.1007/s11356-020-10133-3. [DOI] [PMC free article] [PubMed] [Google Scholar]
- 10.Michael J, Subrata C, Manoranjan P, Anwaar U, Biswajeet P, Manas S, Nagesh S. COVID-19 detection through transfer learning using multimodal imaging data. IEEE Access. 2020;8:149808–149824. doi: 10.1109/ACCESS.2020.3016780. [DOI] [PMC free article] [PubMed] [Google Scholar]
- 11.Scott S, Fernando U, Suhny A, Sanjeev B, Jonathan H, Michael C, Travis S, Jeffrey P, Seth K, Jane P, Harold L. Radiological society of north america expert consensus document on reporting chest CT findings related to COVID-19: endorsed by the Society of Thoracic Radiology, the American College of Radiology, and RSNA. Radiology. 2020;2:e200152. doi: 10.1148/ryct.2020200152. [DOI] [PMC free article] [PubMed] [Google Scholar]
- 12.Chiranjibi S, Mohammad B. Attention-based VGG-16 model for COVID-19 chest X-ray image classification. Appl Intell. 2020;51:2850–2863. doi: 10.1007/s10489-020-02055-x. [DOI] [PMC free article] [PubMed] [Google Scholar]
- 13.Jun W, Yiming B, Yaofeng W, Hongbing L, Hu L, Yunfei X, Xiaoming L, Chen L, Dahong Q. Prior-attention residual learning for more discriminative COVID-19 screening in CT images. IEEE Trans Med Imaging. 2020;39:2572–2583. doi: 10.1109/TMI.2020.2994908. [DOI] [PubMed] [Google Scholar]
- 14.Yu Z, Zheng Z, Xin Z, Shui W. MIDCAN: a multiple input deep convolutional attention network for Covid-19 diagnosis based on chest CT and chest X-ray. Pattern Recogn Lett. 2021;150:8–16. doi: 10.1016/j.patrec.2021.06.021. [DOI] [PMC free article] [PubMed] [Google Scholar]
- 15.Maede M, Andrew C, Bo S, Zhenyu J, Yangze Z, Niloofar A (2021) A robust ensemble-deep learning model for COVID-19 diagnosis based on an integrated CT scan images database. In: IIE annual conference
- 16.Duy M, Duy M, Huong V, Binh T, Fabrizio N, Daniel S (2021) An attention mechanism with multiple knowledge sources for COVID-19 detection from CT images. In: AAAI
- 17.Masahiro M, Hiroshi F, Yusuke S, Takanori O, Tsubasa H, Takayoshi Y, Hironobu F (2021) Embedding human knowledge into deep neural network via attention map. In: VISAPP
- 18.Hiroshi F, Tsubasa H, Takayoshi Y, Hironobu F (2019) Attention branch network: learning of attention mechanism for visual explanation. In: CVPR
- 19.Xiaolong W, Ross G, Abhinav G, Kaiming H (2018) Non-local neural networks. In: CVPR
- 20.Shohei I, Akira F, Motoyuki J, Naoaki K, Sadahiro W, Yuhi S, Satoshi U, Yasuhide U. Chest CT findings in cases from the cruise ship diamond princess with coronavirus disease (COVID-19) Radiology. 2020;2:e200110. doi: 10.1148/ryct.2020200110. [DOI] [PMC free article] [PubMed] [Google Scholar]
- 21.Nakagomi K, Shimizu A, Kobatake H, Yakami M, Fujimoto K, Togashi K. Multi-shape graph cuts with neighbor prior constraints and its application to lung segmentation from a chest CT volume. Med Image Anal. 2017;17:62–77. doi: 10.1016/j.media.2012.08.002. [DOI] [PubMed] [Google Scholar]
- 22.Olaf R, Philipp F, Thomas B (2015) U-Net: convolutional networks for biomedical image segmentation. In: MICCAI
- 23.Huimin H, Lanfen L, Ruofeng T, Hongjie H, Qiaowei Z, Yutaro I, Xianhua H, Yen W.C, Jian W (2020) UNet 3+: a full-scale connected UNet for medical image segmentation. In: ICASSP
- 24.Kaiming H, Xiangyu Z, Shaoqing R, Jian S (2016) Deep residual learning for image recognition. In: CVPR
- 25.He K, Zhang X, Ren S, Sun J (2015) Delving deep into rectifiers: surpassing human-level performance on imagenet classification. In: ICCV
- 26.Russakovsky O, Deng J, Su H, Krause J, Satheesh S, Ma S, Huang Z, Karpathy A, Khosla A, Bernstein M, Berg A, Fei L. ImageNet large scale visual recognition challenge. Int J Comput Vis. 2015;115:211–225. doi: 10.1007/s11263-015-0816-y. [DOI] [Google Scholar]
- 27.Diederik K, Jimmy L (2015) ADAM: a method for stochastic optimization. In: ICLR
- 28.Quinn M. Note on the sampling error of the difference between correlated proportions or percentages. Psychometrika. 1947;12:153–157. doi: 10.1007/BF02295996. [DOI] [PubMed] [Google Scholar]
- 29.Ramprasaath R, Michael C, Abhishek D, Ramakrishna V, Devi P, Dhruv B (2017) Grad-CAM: visual explanations from deep networks via gradient-based localization. In: ICCV.


