

Abstract
Bacterial endotoxin, a major component of the Gram-negative bacterial outer membrane leaflet, is a lipopolysaccharide shed from bacteria during its growth and infection and can be utilized as a biomarker for bacterial detection. Here, the surface enhanced Raman scattering (SERS) spectra of eleven bacterial endotoxins with the average detection amount of 8.75 pg per measurement have been obtained based on silver nanorod array substrates, and the characteristic SERS peaks have been identified. With appropriate spectral pre-processing procedure, different classical machine learning algorithms, including support vector machine, k-nearest neighbor, random forest, etc., and a modified deep learning algorithm, RamanNet, have been applied to differentiate and classify these endotoxins. It has been found that most conventional machine learning algorithms can obtain a differentiation accuracy of > 99%, while the RamanNet can achieve 100% accuracy. Such an approach has the potential for precise classification of endotoxin and could be used for rapid medical diagnosis and therapeutic decision for pathogenic infections.
Graphical Abstract

A rapid and simple method was proposed for differentiation and classification of eleven bacterial endotoxins based on surface enhanced Raman scattering (SERS) and advanced machine learning algorithms.
Introduction
Bacterial infections in human account for significant burden of disease and require rapid detection and treatment. Different approaches have been implemented to detect bacterial infections. The most common method is the gold standard bacterial culture method utilized in clinical and diagnostic microbiology laboratory. Other methods detect bacterial infections indirectly by detecting bacterial biomarkers such as endotoxin, pigments, metabolites, small molecules such as pyocyanin and pyoverdine.1, 2 Among different bacterial biomarkers, endotoxin is very unique. Gram-negative bacteria outer membrane contains glycolipid or endotoxin knows as lipopolysaccharides (LPS) that is shed during infection or bacterial lysis.3 Bacterial endotoxins are very potent inducers of inflammation by activating Toll-like receptor 4 (TLR4) -mediated innate immune responses leading to cytokine storm usually observed in sepsis.4 Endotoxin circulating in blood even at low concentrations is associated with septic shock and mortality.5 Therefore, rapid detection of endotoxin is highly desired and could aid in medical diagnosis and therapeutic decision.
In recent years, with the development of nanotechnology, biosensors based on novel nanostructures have been used to detect and identify trace amounts of endotoxin in human fluid samples based on fluorescence, chemiluminescence, and electrical gradient.6, 7 Surface-enhanced Raman spectroscopy (SERS), with the potential to achieve single molecule detection, is very attractive and promising for multiplex detection.8, 9 SERS offers a unique “signature” spectral profile with very narrow spectra peaks for individual analyte and has been demonstrated to be able to directly detect various biomolecules.10–13 Recently, Wu et al. reported the SERS fingerprint spectra of the LPS, KDO2-lipid A, and lipid A of Neisseria meningitidis endotoxin structures as well as the enteric LPSs from E. coli, S. typhimurium, S. Minnesota, V. cholerae, R. CE3, and R. NGR,14, 15 and demonstrated the possibility of using SERS for endotoxin detection.
One challenge for SERS endotoxin detection is to identify the unique SERS spectral features. Since the chemical structures of many endotoxins are similar, their SERS spectra are very much alike. Therefore, in order to classify the spectra, different statistical methods are applied, including supervised and unsupervised learning.16–19 Since the SERS spectra can be viewed as multi-variant data, chemometric analysis is often applied to reduce the dimensionality of the spectral data and maximize the variance among spectral fingerprints in order to differentiate bacteria. For unsupervised learning, such as principal component analysis (PCA) and hierarchical cluster analysis (HCA), training data do not have ground truth labels, the model identifies structure such as clusters, and testing data can be assigned to different clusters. For supervised learning, including partial least square discriminant analysis (PLS-DA), partial least square regression (PLS), linear discriminant analysis (LDA), support vector machine (SVM), k-nearest neighbor (KNN), random forest (RF), etc., each training sample has a ground truth label. The model learns a decision boundary and replicates the labeling on the testing data. These methods allow successful spectral and image analysis of complex biological samples such as cell identification,20 disease diagnosis,21 and forensic analysis.22
However, the use of traditional chemometrics methods to differentiate SERS spectra are increasingly challenged due to several reasons. First, the high dimensionality of the spectra and the multivariate or even megavariate nature, as a result of the inherent complexity of the biological systems, increase the difficulty of data analysis. Second, the vibrational spectra of single cellular or microbial systems suffer from the low signal-to-noise ratio (SNR), which further increases the difficulty for the data analysis. Third, advanced high-throughput chemical profiling for biological detection can significantly increase data size. This not only leads to the difficulty in calculation but also prevents extraction of a subtle variation of sophisticated hidden features within the big data through a single traditional data processing algorithm. However, deep learning methods have the potential to circumvent the complexity and heterogeneity in data. For example, convolutional neural networks (CNNs), which is one of the most popular deep leaning architectures, has been widely used and shown superior performance to analyze spectroscopic signals including SERS spectroscopy of complex biological samples.23–25
In this paper, SERS spectra of eleven bacterial endotoxins have been measured based on silver nanorod array (AgNR) substrates. The characteristic SERS peaks from these endotoxins have been identified. Different classical machine learning algorithms (MLAs) and a modified CNN model, i.e., RamanNet, have been applied to differentiate and classify endotoxins based on these SERS spectra. It has been shown that with appropriate spectral pre-processing procedure and MLAs, the SERS spectra of endotoxin can be differentiated with 100% accuracy. Such an approach has the potential for rapid detection of endotoxin and could be used in medical diagnosis and therapeutic decision.
Experimental section
General detection and classification strategy.
The procedure to use SERS and MLA to differentiate and classify eleven bacterial endotoxins is illustrated in Fig.1. First, an extensive SERS spectra database of bacterial endotoxins is produced by collecting spectra from highly sensitive silver nanorod array (AgNR) substrates. Then, according to the spectral feature, a simple and reliable baseline correction method is developed to obtain the highly reproducible spectra. Finally, by applying a classical MLA, such as SVM, RF, KNN, PLS-DA, LDA, or a novel deep learning model (RamanNet, based on CNN), bacterial endotoxins can be accurately distinguished based on SERS spectra.
Fig. 1.

The general schematic strategy for classification of bacterial endotoxins using SERS and MLA. (A) Sample preparation and SERS measurements; and (B) spectra pre-processing and classification using an MLA.
Materials.
Sulfuric acid (Fisher Scientific, 98%), ammonium hydroxide (Fisher Scientific, 98%), hydrogen peroxide (Fisher Scientific, 30%), and ethyl alcohol (EtOH, reagent grade) were acquired to clean the glass slides (Gold Seal, Part# 3010). Silver (Kurt J. Lesker, 99.99%) and titanium pellets (Kurt J. Lesker, 99.995%) were purchased as the evaporation materials. Pure water (Sigma-Aldrich) was used throughout all the experiments.
AgNR substrate fabrication.
AgNR arrays prepared by the oblique angle deposition (OAD) are excellent SERS substrates as reported previously.26–29 Briefly, clean glass slides (0.5 inch × 0.5 inch) were loaded into a vacuum deposition chamber with the substrate normal antiparallel to the incident vapor direction. A layer of 20 nm-thick Ti film and a layer of 200 nm-thick Ag film were deposited in sequence at a rate of 0.2 nm/s and 0.3 nm/s, respectively. Then, the substrate normal was rotated to 86° relative to the incident vapor direction, and a thickness of 2000 nm Ag film was deposited at a rate of 0.3 nm/s to obtain the AgNR arrays. The entire evaporation process was conducted under a high vacuum condition with a pressure < 3 × 10⁻⁶ Torr. A typical SEM image of an AgNR substrate is shown in Fig. S1, and detailed deposition procedure and condition can be found in Ref. [30]. According to previous extensive study, the AgNR substrates have been demonstrated to possess good SERS reproducibility with <10% relative standard deviation (RSD), high SERS enhancement factor up to 109, and large area uniformity.26, 27, 31, 32
Preparation and purification of bacterial endotoxins.
Eleven different kinds of LPSs were prepared for this study. These 11 kinds of LPSs are representative of the most common bacteria that cause disease in humans (see Section S1 in Electronic Supplementary Information (ESI†) for details). The lipopolysaccharides were extracted from the bacterial cells by hot phenol-water extraction procedure.33 The water phases were dialyzed (12-14 kDa cutoff membrane), freeze-dried, washed in 90% EtOH to remove traces of phospholipids. The detailed purifications of specific LPS samples are in corresponding references: Francisella tularensis LVS;34 LOS Moraxella catarrhalis;35 Pseudomonas aeruginosa,36 S. meliloti (this work). The endotoxin of Salmonella enterica serovar. Typhimurium (S-type LPS), Salmonella enterica serovar. Minnesota Re595 (R-type LPS; Re), E.coli-EH100 (R-type LPS; Ra), LPS E.coli-O128:B12, E.coli-O11:B4, E.coli-J5 (R-type LPS; Rc) were obtained from Sigma Aldrich, and the LPS of Helicobacter pylori GU2 was obtained from Wako Pure Chemicals (Tokyo, Japan). Table S1 in ESI† lists the general structures and properties of these LPSs. Of note, all LPSs used in this study were derived from bacteria that can cause disease in human except for S. meliloti which is a Gram-negative bacteria found in soil and does not cause infections in human. The LPS structure of S. meliloti (also known as Rhizobium meliloti) is very different from other bacteria as it harbors long fatty acyl chains.37 LPS with extended length fatty acyl chains are also found in gut microbiota species such as Bacteroides and Prevotella, which harbor biologically inactive LPS as a TLR4 ligand and therefore would not lead to innate immune activations.38 Three different macromolecules were used as control samples since they are structurally very different from the LPS: a peptidoglycan (PGN) from Gram-positive S. aureus (Sigma-Aldrich), lipoteichoic acid (LTA) from B. subtilis (Sigma-Aldrich) and chitin from crab shell (Sigma-Aldrich). In rare mixed infections of Gram-positive and Gram-negative bacteria, PGN and LTA could be present along with LPS in a clinical sample. The SERS spectra may look similar. Chitin, however, is not present in bacteria that cause disease in humans but used as a control since it is a repeating sugar polymer found in plants and fungi. Note that LPS structure contains O-antigen which is a repeating sugar chains linked to lipid A part of the LPS molecule. PGN purified from S. aureus and the LTA purified from B. subtilis originated from Gram-positive bacteria. PGN is the main membrane component in Gram-positive bacteria, which is in contrast to Gram-negative bacteria that also contain a quite thin layer of PGN embedded in the membrane beneath the LPS layer. Chitin is not found in bacteria and characteristic to fungi and insects.39
SERS characterization.
Bacterial endotoxin samples or negative controls were diluted into 100 μg/mL using pure water. 2 μL of the diluted sample was dispensed onto the AgNR substrate and air dry at 20℃. The average spreading area was estimated to be 3.5 mm2. The SERS spectra were collected by a confocal Raman microscope (Renishaw, InVia) using a 785 nm excitation laser. To reduce the florescence background signal from the targeted analytes, 785 nm excitation wavelength were selected. Additionally, 785 nm excitation can generate large SERS enhancement from AgNR substrates compared to other short wavelength excitations. Unless otherwise specified, the laser power was set to be 9 mW at sample with a 5× objective lens and 10 s acquisition time. The excitation laser spot size was 1875 μm2 and the amount of analyte (LPS or reference molecules) in a single SERS measurement was estimated to be 8.75 pg. In order to obtain sufficient SERS spectra for MLAs, discrete SERS mappings were taken from 4-5 AgNR substrates with at least 300 μm spacing among the sampling spots to avoid mapping overlap. About 100 spectra were taken for each mapping and some outlier spectra with obvious inconsistency (such as multiple spike peaks presented in the spectra, featureless spectra, etc.) were removed from the spectra data set. The final number of SERS spectra taken for each endotoxin is between 338 to 440, and detail is listed in Table S2.
Data pre-processing.
Usually, SERS spectra contain unwanted spectral features such as spikes (noise) and baselines that need to be removed before further data analysis. The baseline of SERS spectra originates from different sources, which one could catalogue them as intrinsic and extrinsic origins. The intrinsic baseline is due to the fluorescence and Rayleigh scattering from the analyte molecules, especially biomolecules.40, 41 The extrinsic baselines include the scattering/absorption from the nanostructures in SERS substrate and the instrument response. The targeted analyte molecules or other background molecules could randomly adsorb into the hot spots where strong SERS signals are produced. Such a process not only make the entire spectral signal move up or down, but also introduce noise in the spectra. Since the intrinsic baseline is directly associated with the targeted analytes, in terms of spectral classification, it is important information that should not be removed; while the extrinsic baseline, the contributions from SERS substrates and instruments should be removed since they are irrelevant to the targeted analytes and cause problems in future data analysis. According to the mechanisms of extrinsic baselines, both should contribute to a baseline of a monotonic function. Therefore, the criteria for a good baseline correction method should be: 1. The removal of the baseline should, in most cases, decrease the variation in spectra from measurement to measurement for the same sample and SERS substrate; 2. By removing the baseline, one should remove information that is similar to all spectra; 3. After baseline removal, spectra from the same sample and SERS substrate should be highly correlated. A typical raw SERS spectrum is shown in Fig. S2, and in the wavenumber range of 300-400 cm−1 and 1800-2500 cm−1, there are no Raman peaks signifying the fingerprint features of the analytes. And all the experimental spectra share similar features in these two wavenumber regions, indicating that these are common features in all our SERS measurements and independent from the target analytes used, thus these extrinsic features need to be removed. Since the spectral feature at 300-400 cm−1 region shows a rapid decay while at 1800-2500 cm−1 exhibits a slow decrease, we chose to use a mixed Gaussian and Lorentzian function to fit the baseline in the wavelength range of 300-400 cm−1 and 1800-2500 cm−1 (other math function that can best fit these two spectral features shall also work well),
| (1) |
where A is the amplitude of the Gaussian function, is the center of the Gaussian peak, is the standard deviation of the Gaussian function, L is the area of the Lorentzian function, is the center of the Lorentzian peak, relates to the width of the Lorentzian peak, is the “ground” level of the SERS spectrum. The original SERS spectra were normalized at 300 cm−1 to 1 in order to better confine the parameter boundaries (detailed in Table S3) for baseline fitting. Fig. S3 shows an example of the data pre-processing. The dashed red curve in Fig. S3B shows the fitted baseline for the spectrum in Fig. S3A, and the corresponding baseline corrected spectrum (i.e., original spectrum subtracting the baseline) is shown in Fig. S3C. Then the mean value of each baseline corrected spectrum was calculated, and the final spectrum was normalized by the mean value of each spectrum (Fig. S3D). The SERS spectra of F. tularensis LVS after pre-processing are shown in Fig. S4B. Compared to other methods, such as WiRE (a commercially available and popular polynomial-based baseline correction method), we find that this simple baseline correction can significantly reduce the variations in SERS spectra, which are evidence by the high average spectrum-spectrum correlation coefficients (Table S2). We believe that such a data pre-processing is more suitable for MLAs to achieve better accuracy (see Section S4 in ESI†).
Machine learning model.
As shown in Table S2, there are a total of 5,624 SERS spectra obtained from 11 bacterial endotoxins, peptidoglycan (PGN), lipoteichoic acid (LTA) and the chitin. After baseline correction and normalization following above mentioned procedure (see Fig. S3), 3,936 and 1,688 SERS spectra were randomly chosen as the training spectrum set and testing spectrum set (a ratio of 7:3) and analyzed by different MLAs, including SVM, RF, KNN, PLS-DA, and LDA with a machine learning library scikit-learn in Python 3.8.3. Only the training spectrum set was used to train the model, while the testing set was used to obtain the prediction performance of the trained model. During the training process, a five-fold cross validation was employed to tune hyperparameters, such as C (regularization parameter) and γ (kernel coefficient) in SVM, and k (number of neighbors) in KNN algorithm. At the end of cross validation, the best hyperparameters were chosen and the unbiased model performance was obtained using seven measures: accuracy, Micro and Macro Precision, Micro and Macro Recall, and Micro and Macro F-score on validation sets. The models were further evaluated by the seven model performance measures on testing data for external validation. Feature importance was obtained by applying the models with best hyperparameters on the whole training set. The confusion matrix and receiver operating characteristic (ROC) curve were obtained by implementing the models on the testing spectrum set.
RamanNet model.
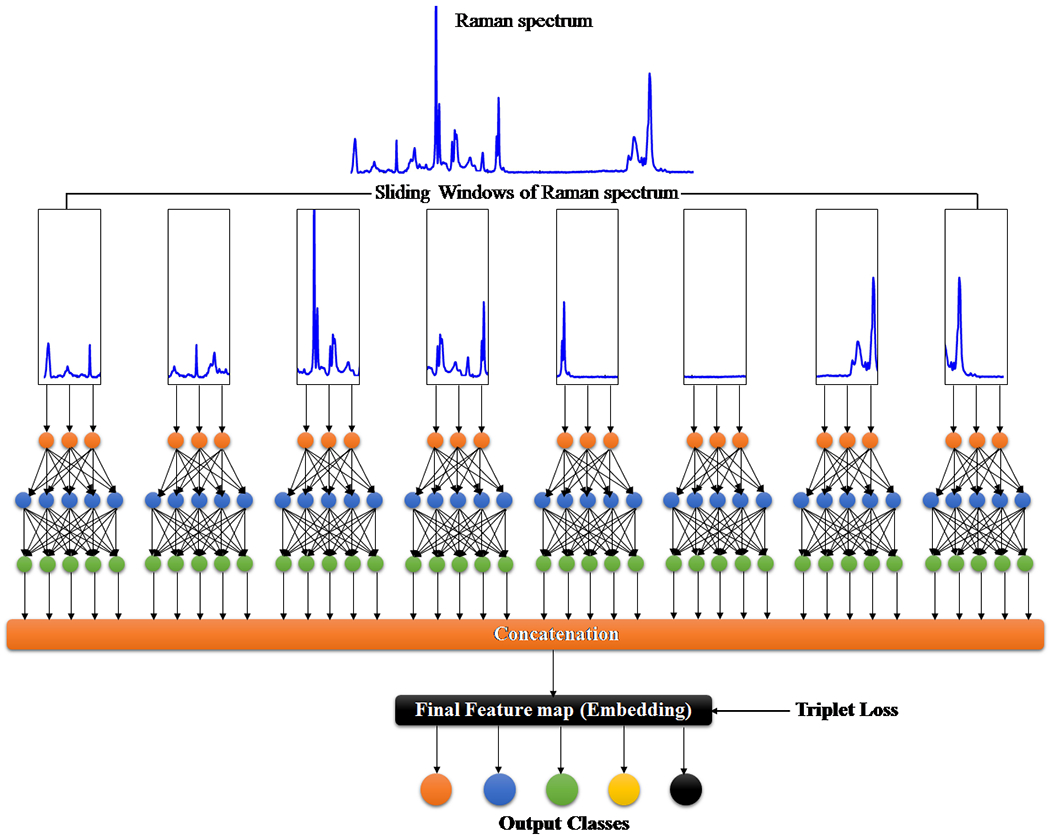
RamanNet is a novel neural network architecture designed focusing on the unique properties of Raman spectra.42 The state-of-the-art CNN models, despite being able to generalize better and extract complex and novel pattern from signal or image data, is not suitable for Raman spectra analysis. Since the horizontal axis in a Raman spectrum represents Raman shift, not time or any other independent variable, the equivariance to translation property in CNN proves to be troublesome, as it will treat pattern signatures at different Raman shift in the identical manner. On the contrary, for traditional MLAs, one faces the curse of dimensionality and at the same time disregard any correlation between intensities at neighboring Raman shifts, both of which could have been solved by sparse connectivity found in CNN.
RamanNet attempts to be at the middle ground between both the two approaches, by ensuring sparse connectivity and disabling temporal invariance. This is performed employing the traditional densely connected blocks in a novel manner. We consider overlapping windowed segments from the Raman spectrum and analyze them in shifted densely connected blocks as shown in Fig. 2. This effectively mimics a 1D convolutional operation, but with context localization or without translation. Therefore, we can extract features in the same fashion of a 1D CNN. Mathematically, a typical 1D CNN operation can be simplified as,
| (2) |
where x is the one-dimensional input (variable, like Δv in SERS spectra), y is the output (like the SERS spectrum ), k is a learned kernel, b is a bias term, and is a nonlinear operation. The same kernel k is applied everywhere thus the translational equivalence is achieved. ‘i’ and ‘h’ are loop variables for the convolution operation, where i denotes a particular point of the signal, x(i) means the signal at ith timestamp and h represents a particular point of the kernel, k(h) means the value at the hth index of the kernel.
Fig. 2.
The RamanNet architecture.
In RamanNet, the proposed modification is to use the shifted densely connected blocks,
| (3) |
where the dot product is mathematically equivalent to an 1D convolutional operation with proper relation between the weight matrix W and kernel k. In addition, since we are using sliding windows, the weight matrix and kernel depends on the location, i.e., value of i. To compute all the features from the entire Raman spectra, we have concatenated the features in a dense layer and the output from the dense layer is regularized with dropout and fed to an Embedding layer. Finally, the embeddings are used to classify by a SoftMax activation function. Furthermore, in order to ensure better class separability, triplet loss is used in the hidden layer of RamanNet.43
The RamanNet analyses were conducted in a server computer with Intel Xeon @2.2GHz CPU, 24 GB RAM, and NVIDIA TESLA P100 (16 GB) GPU. The RamanNet architecture was implemented using Tensorflow. In order to compare the performance of RamanNet model with the classical machine learning models in classification of bacterial endotoxins Raman spectra, a similar five-fold cross-validation scheme was used.
Results and discussion
Characteristics of LPS SERS spectra.
Fig. 3 shows the characteristic average SERS spectra of the 11 LPS samples and 3 reference samples. The detailed SERS peak assignments based on the molecular vibrational modes for these LPS samples are summarized in Table S6. Intact bacterial LPSs are amphiphilic macromolecules with a molecular mass of 10-20 kDa and having three structural components: (1) a hydrophobic lipid section, lipid A, which is responsible for the toxic properties of the molecule, (2) a hydrophilic core polysaccharide chain, and (3) a repeating hydrophilic O-antigenic oligosaccharide polymer that is specific to the bacterial serotype.44 Therefore, many LPSs share similar spectral features with similar vibrational modes. Table S7 rearranges the SERS peak assignments and shows the common peaks among different LPSs. The number of LPS samples with shared common peaks vary from 1 to 11. The most three common peaks are the peaks at Δv = 1614 cm−1 and Δv = 1003 cm−1 corresponding to both v (C-O) and v (C-C) modes, the peak at Δv = 1333 cm−1 resulting from the δ (C-H) mode. Other obvious common peaks are: the Δv = 735 cm−1 peak is corresponding to β (C-O-C) mode, the peaks at Δv = 794 cm−1 and 1592 cm−1 are due to v (C-O) modes, the peaks at Δv = 894 cm−1 and 917 cm−1 result from both the δ (C-C-H) and δ (C-O-H) modes. Also, there are some unique peaks only belonging to specific LPS, e.g., Δv = 531 cm−1, 568 cm−1, 577 cm−1, 648 cm−1, 759 cm−1, 775 cm−1, 1174 cm−1, 1304 cm−1, 1326 cm−1, 1578 cm−1, and 1642 cm−1, respectively. However, their relative peak intensities are very week. The similarity and difference in SERS peaks are due to the intrinsic molecular structure similarity and difference in these LPSs.
Fig. 3.

(A) Typical average SERS spectra of eleven bacterial endotoxin samples. The mean SERS spectra are shown by the solid line, and the standard deviations are marked by the shadow. (B) SERS spectra of S. aureus peptidoglycan (PGN) and B. subtilis lipoteichoic acid (LTA) as well as chitin are used as controls since their structure is very distinct from LPS structures.
Since the reference samples PGN and LTA are obtained from Gram-positive bacteria and chitin is not from bacterium, their molecular structures are very different from LPSs. Thus, it is expected that their SERS spectra should be significantly different from those of the LPSs. As shown in Fig. 3, generally the SERS spectra of the three reference samples have fewer characteristic peaks, and the overall spectral shapes are very similar. Their detailed SERS peak assignments are shown in Table S6. These three samples have only one common peak at Δv = 1614 cm−1, which is due to the v (C-O) and v (C-C) modes. The SERS spectra of PGN and LTA have a common peak at Δv = 1333 cm−1, corresponding to a δ (C-H) deformation mode, while the LTA and chitin have a common peak at Δv = 894 cm−1, resulting from the δ (C-C-H) and δ (C-O-H) modes. Chitin has a notable unique peak at Δv = 775 cm−1, which results from the v (C-O) modes.
SERS spectra classification using different MLAs.
Simple PCA showed little discrimination between different types of LPSs and control samples as shown in Fig. S6. For MLA or deep learning analysis, sufficient spectra are needed for training spectrum set. As shown in Table S2, the total SERS spectra collected from 11 bacterial LPS samples and 3 control samples on the AgNR substrates are 5,624. After the baseline correction and normalization depicted in Fig. S3, most SERS spectra obtained from the same sample have a correlation coefficient larger than 0.98. Only few, i.e., E. coli-O11:B4 (0.954), P. aeruginosa (0.942), and S. meliloti Rm1021 (0.900), have smaller correlation coefficient, but all larger than 0.9. Therefore, the pre-processed spectra are good for MLA or deep learning analysis.
Different machine learning models were applied for the classification of the SERS spectra of the LPSs. For the SVM classifier, different kernel functions, including linear, polynomial, radial basis function (RBF), and Sigmoid, were used to optimize the SVM, and their corresponding validation accuracies are shown in Table S4. The SVM classifiers with linear, polynomial, and RBF kernels show comparable accuracies of > 99%, while the Sigmoid kernel function gives the lowest accuracy of 93.1% ± 0.9%. The polynomial and Sigmoid kernels are nonlinear kernels, which are more complex and may increase the chance of overfitting the model and decrease accuracy on testing set. The comparable accuracies of linear and RBF kernels suggest that the dataset is linearly separable, thus the linear kernel was chosen for the SVM classifier. The hyperparameters for the SVM classifier were chosen as C = 1 (γ is a constant for linear kernel function) by cross validation. For KNN classifier, the number of neighbors k was chosen as 4. Table 1 shows the performance of five classic MLAs based on the 5-fold cross-validation. All models perform well, with accuracies, precisions, recalls and F1 score greater than 98% (the definitions of all the parameters can be found in Table S8). Among all five models, SVM performs the best, given almost 100% for almost all the parameters, including the accuracy. The small variability for all the performance measures demonstrates the good stability of the predictive model.
Table 1.
Comparison of the results of the different trained models.
| SVM | RF | KNN | LDA | PLS-DA | |
|---|---|---|---|---|---|
| Accuracy | 0.9998 ± 0.0005 | 0.995 ± 0.001 | 0.992 ± 0.003 | 0.998 ± 0.001 | 0.98 ± 0.02 |
| Micro Precision | 0.9998 ± 0.0005 | 0.995 ± 0.001 | 0.992 ± 0.003 | 0.998 ± 0.001 | 0.98 ± 0.02 |
| Macro Precision | 0.9998 ± 0.0004 | 0.995 ± 0.002 | 0.992 ± 0.002 | 0.998 ± 0.002 | 0.98 ± 0.01 |
| Micro Recall | 0.9998 ± 0.0005 | 0.995 ± 0.001 | 0.992 ± 0.003 | 0.998 ± 0.001 | 0.98 ± 0.02 |
| Macro Recall | 0.9997 ± 0.0006 | 0.995 ± 0.001 | 0.992 ± 0.003 | 0.998 ± 0.002 | 0.98± 0.01 |
| Micro F1-score | 0.9998 ± 0.0005 | 0.995 ± 0.001 | 0.992 ± 0.003 | 0.998 ± 0.001 | 0.98 ± 0.02 |
| Macro F1-score | 0.9998 ± 0.0005 | 0.995 ± 0.002 | 0.992 ± 0.003 | 0.998 ± 0.002 | 0.98 ± 0.02 |
To investigate the important structures/peaks on the SERS spectra that contribute most to a classifier, we applied the trained SVM model with the best hyperparameters to the whole training spectrum set and obtain the feature importance of Raman shift. As shown in Fig. 4, the peaks at Δv = 857 cm−1, 1333 cm−1 and 1593 cm−1 were found to be the most prominent features, which correspond to the δ (C-C-H) deformation mode and δ (C-O-H) deformation mode, δ (C-H) deformation mode as well as v (C-O) stretching mode, respectively. The Table S9 lists all these importance features, which including peak assignments and peak distributions.
Fig. 4.

Spectra feature importance extracted from the SVM model.
Applying the trained SVM classifiers on the testing spectrum set, the performance of the SVM on the testing spectrum set was obtained, and the corresponding confusion matrix is shown in Fig. 5. Among the 11 LPSs and 3 reference samples, 12 are classified with 100% accuracy, few spectra from E. coli-EH100 and E. coli-O128:B12 are misclassified. The accuracy for E. coli-EH100 is 98.4%, 1.6% spectra were recognized as S. typhimurium. The accuracy for E. coli-O128:B12 is 98.4%, 0.8% spectra were recognized as S. typhimurium, and 0.8% spectra were recognized as S. aureus. The corresponding ROC curve is shown in Fig. S8. For all 14 samples, the mean value of the areas under the ROC curves (AUC) is greater than 0.99, which suggests that the SVM model classifies different LPSs and reference samples with a very high specificity and sensitivity based on the SERS spectra.
Fig. 5.
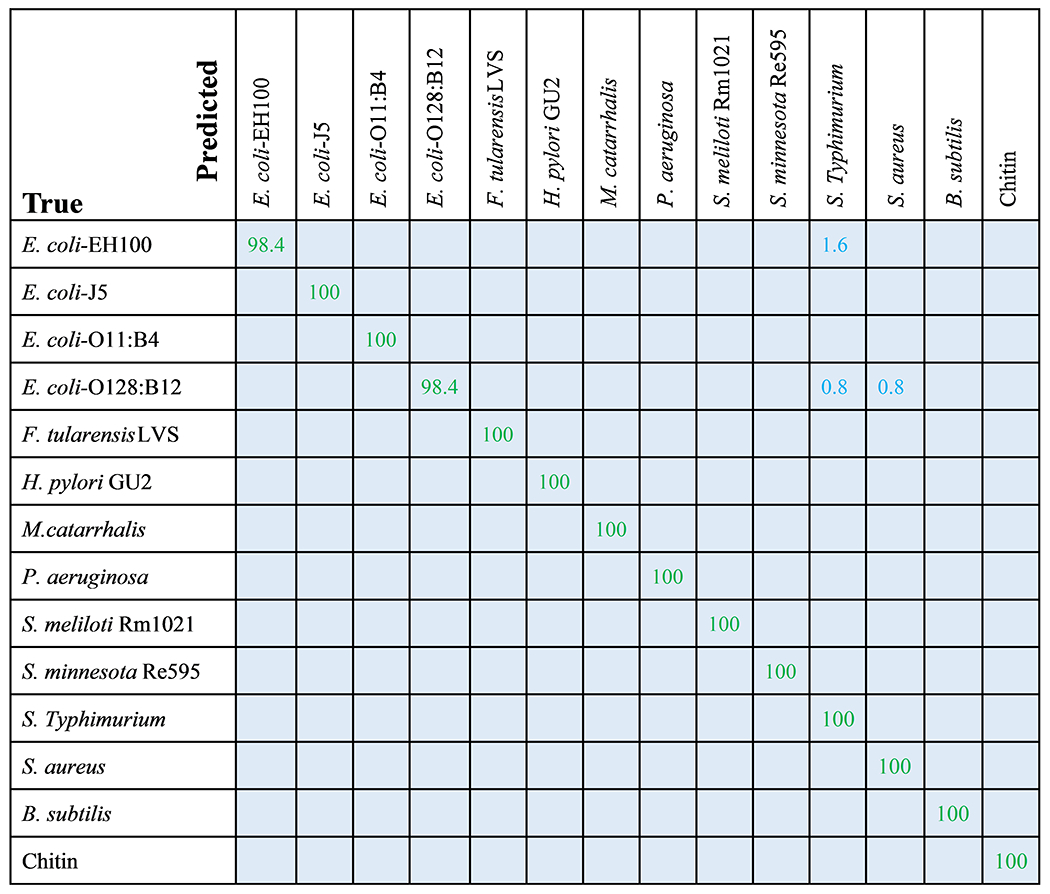
Confusion matrix of the SVM model for 11 LPS and 3 control samples. Entries in the matrix represents the percentage of test spectra that are predicted by the SVM model as class (first row) given a ground truth of class (first column); entries along the diagonal represent the accuracies for each class.
RamanNet Analysis.
Similar to the evaluation procedure followed for the classical MLAs, 5-fold cross-validation was performed with RamanNet. RamanNet manages to classify all the samples with perfect 100% accuracy in all the folds as shown in Fig. 6. Although this increase is apparently insignificant compared to the result reported in Fig. 5, it should be noted that this performance is achieved by a shallow 3 layers’ network with only 1M parameters. The summarized results from the 5-fold tests are presented in Fig. 6 as a confusion matrix.
Fig. 6.
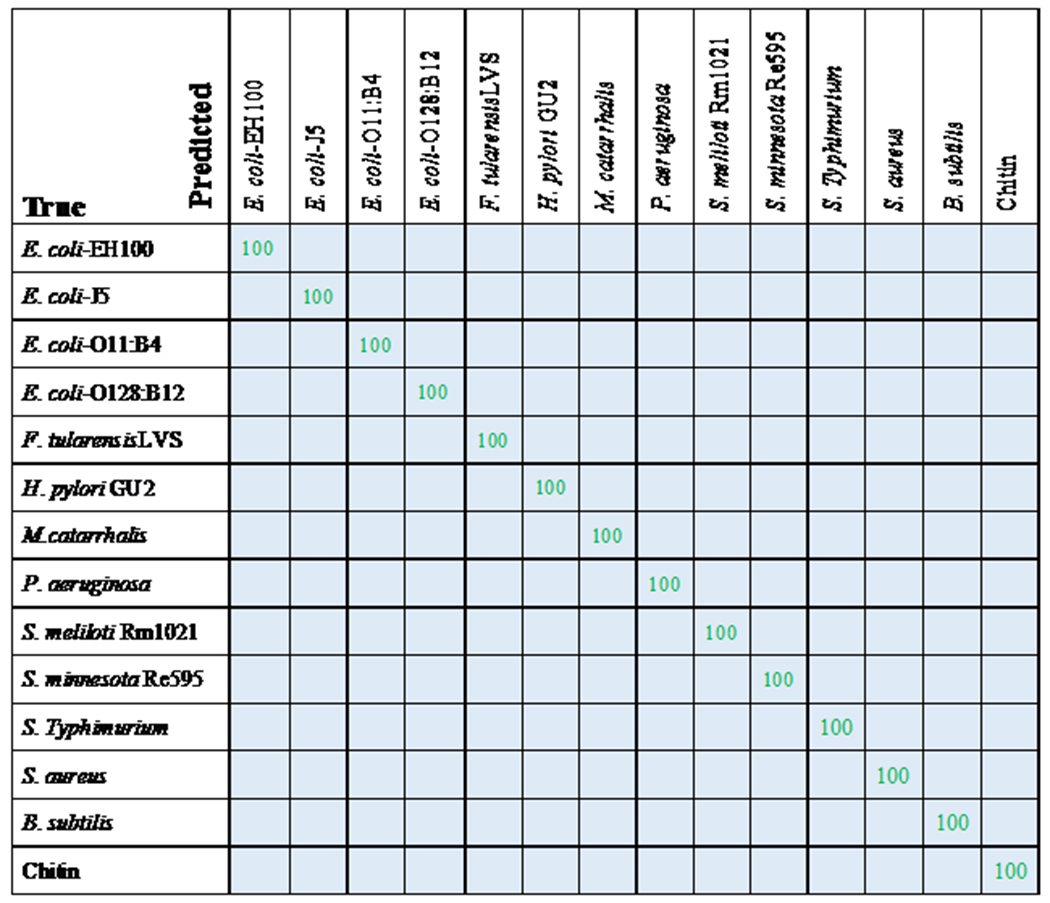
Confusion matrix of RamanNet model for 11 LPS and 3 control samples. Entries in the matrix represents the percentage of test spectra that are predicted by the RamanNet model as class (first row) given a ground truth of class (first column); entries along the diagonal represent the accuracies for each class.
Figure 7A shows the training and validation loss and accuracy plots, where it can be observed that the model was trained for 100 epochs, but the model quickly achieved convergence within 40 epochs. This makes the model not only accurate (100% multiclass accuracy) but also fast (2M FLOPs) in training. Moreover, the inference time is very small as the model is very shallow.
Fig. 7.

(A) Loss during training the RamanNet model. Although the model was trained for 100 epochs, it achieves convergence within 40 epochs. Dimensionality reduction using RamanNet. The 256-dimensional feature space is projected into a 2 dimensional-map using tSNE: (B) PCA and (C) RamanNet.
In addition to improved performance, another feature of RamanNet is the lack of reliance on dimensionality reduction algorithms. Whereas traditional methods have to rely on feature compression scheme like PCA, RamanNet is capable of inherently extracting a lower dimensional representation from the data. Furthermore, the use of triplet loss in the hidden layers of RamanNet provides a better class separability compared to PCA. For example, the compressed feature spaces obtained from PCA and RamanNet are presented. A 256-dimensional feature space using PCA and extract embedding of similar dimension from RamanNet were computed. Then the 256-dimensional feature space is projected into a 2 dimensional-map using t-Distributed Stochastic Neighbor Embedding (tSNE).45 As shown in Fig. 7B and 7C, though the tSNE plot derived from PCA shows separated clusters for individual LPSs and reference samples, the tSNE plot using the embedding learnt in RamanNet shows that the clusters are free from overlaps, and all the classes are distributed properly with minimizing intraclass distance and maximizing interclass distance. This ensures better distinction among the classes, which increases classification performance as shown in Fig. 6. In addition, as shown in RamanNet embedding space plotted in Fig. S5 for different data pre-processing, RamanNet model enables most clusters distribute properly without overlap and maximizing interclass distance for raw spectra (Fig. S5B), normalized raw spectra (Fig. S5D), and WiRE correction (Fig. S5F), only several spectra were misclassified. Therefore, we expect that combining our baseline correction method with RamanNet machine learning model could achieve a higher accuracy for more complex spectra sets measured from real patient samples.
Classification of LPS mixture.
Occasionally a patient may be infected by more than one type of bacteria, and multiple LPSs may co-exist in the clinic specimen. To detect and differentiate multiple analytes from a single specimen using SERS and machine learning is still a challenging topic and is beyond the scope of this paper. One of the challenges is how to obtain the training spectrum set. Several publications used data augmentation strategy to map out all the possible combinations of different mixed analytes to build the training spectrum set based on spectra linear combination,46, 47 i.e., for a given mixture, the SERS spectrum (Sm) of a mixture is a linear combination of the SERS spectra of the individual analyte 1 (S1) and analyte 2 (S2), Sm = aS1 + bS2, where a and b represent the relative contribution of each analyte in the mixture. According to Ref. [46, 47], such a strategy seems to work quite well. Here, as a proof of concept, four kinds of two-LPS mixtures, E. coli-O11:B4 and S. minnesota Re595 (ES), F. tularensis LVS and H. pylori GU2 (FH), E. coli-O11:B4 and H. pylori GU2 (EH), as well as S. minnesota Re595 and H. pylori GU2 (SH), with 50 μg/mL each for each analyte, were prepared for SERS measurement. Their corresponding biological significance is listed in Table S10. Fig. 8 shows the typical average SERS spectra of these four mixtures. Most important SERS peaks listed in Table S9 can be observed. Combining spectra from single LPSs and mixtures for machine learning analysis, Table S11 shows the predicted accuracies of six MLAs based on the 5-fold cross-validation. The PLS-DA model shows a low accuracy of 0.928, while other five models perform quite well, with accuracies greater than 99%. Still, RamanNet enables to classify all the samples with a perfect 100% accuracy as shown in an example confusion matrix (Fig. S9). The tSNE plot shows that all the clusters are free from overlaps and distributed properly with minimizing intraclass distance and maximizing interclass distance (Fig. S10). These results show that the SERS spectra of mixtures are very different from those of single LPS, and in principle, they should be able to be used for machine learning to identify mixed species and relative concentration.
Fig. 8.

Typical average SERS spectra of four bacterial endotoxin mixtures.
However, we find that it is not suitable to use the linear combinations of SERS spectra of single LPS to construct the training spectrum set for multiplex detection. Fig. S11 shows the experimentally obtained SERS spectra from LPS mixtures (red curves) and the best linear combinations (black curves) of spectra from two LPSs in the mixture through a least-squares fitting.48 There are significant differences between experimental and linearly combined spectra. For example, in S. minnesota Re595 and H. pylori GU2 (SH) mixture, the experiment result shows obvious SERS peaks at Δv = 558 cm−1 and 1387 cm−1, while SERS peaks at Δv = 898 cm−1, 1034 cm−1, and 1333 cm−1 are distinctive in the fitting result. The possible reasons are currently under investigation. In fact, for Ref. [46, 47], the linear combination hypothesis may not be reasonable from the SERS mechanism point of view. There are many underlying assumptions for this hypothesis: 1. The SERS spectrum of each analyte does not change; 2. There is no interaction between the two (or more) target analytes; 3. Each analyte has the same enhancement; and 4. The adsorption mechanism of each analyte to the SERS hot spots does not change. Unfortunately, our results show that some of above assumptions do not hold. Therefore, more investigations are needed to delineate SERS spectra from LPS mixtures for the practical application.
Conclusions
In summary, SERS spectra of eleven bacterial endotoxins at very low amount (8.75 pg) have been collected from AgNR substrates, and the characteristic SERS peaks have been identified. Different classical machine learning algorithms and a deep learning algorithm RamanNet have been applied to differentiate and classify various endotoxins. After implementing appropriate spectral pre-processing procedure and machine learning algorithms, it has been found that most conventional machine learning algorithms can obtain a differentiation accuracy of > 99%, while the RamanNet can achieve 100% accuracy. Such an approach has the potential for rapid detection of endotoxins and could aid in medical diagnosis such as sepsis and therapeutic decision. In addition, occasionally a patient may be infected by more than one type of bacteria, and our results indicate that the SERS spectra of endotoxin mixtures also can be classified with 100% accuracy using RamanNet model. However, a practical multiplex detection strategy to determine the possible species and relative compositions in a mixture based on SERS spectra is still under investigation. The challenges originate from the possible changes in the SERS spectra of individual analyte and the way to establish a reliable training spectrum set for MLAs.
Supplementary Material
Acknowledgements
YY, SMZ, and YZ are supported by Qatar National Research Fund (grant number: NPRP12S-0224-190144). Work at the Complex Carbohydrate Research Center was supported by the US Department of Energy (DOE), Office of Science, Basic Energy Sciences (BES), under Award DE-SC0015662, and by NIH grant R24GM137782-01 to Parastoo Azadi.
Footnotes
Electronic Supplementary Information (ESI) available: See https://www.rsc.org/suppdata/d2/nr/d2nr01277d/d2nr01277d1.pdf or DOI: 10.1039/D2NR01277D
Conflicts of interest
The authors declare that they have no known competing financial interests or personal relationships that could have appeared to influence the work reported in this paper.
References
- 1.Wu X, Chen J, Li X, Zhao Y and Zughaier SM, Nanomed. Nanotechnol. Biol. Med, 2014, 10, 1863–1870. [DOI] [PMC free article] [PubMed] [Google Scholar]
- 2.Gopal A, Yan L, Kashif S, Munshi T, Roy VAL, Voelcker NH and Chen X, Adv. Healthcare Mater, 2022, 11, 2101546. [DOI] [PubMed] [Google Scholar]
- 3.Park BS, Song DH, Kim HM, Choi B-S, Lee H and Lee J-O, Nature, 2009, 458, 1191–1195. [DOI] [PubMed] [Google Scholar]
- 4.Zughaier Susu M, Zimmer Shanta M, Datta A, Carlson Russell W and Stephens David S, Infect. Immun, 2005, 73, 2940–2950. [DOI] [PMC free article] [PubMed] [Google Scholar]
- 5.Brandtzaeg P, Ovstebø R and Kierulf P, Prog. Clin. Biol. Res, 1995, 392, 219–233. [PubMed] [Google Scholar]
- 6.Seth R, Ribeiro M, Romaschin A, Scott JA, Manno M, Scott JA, Liss GM and Tarlo SM, J. Allergy Clin. Immunol, 2011, 127, 272–275. [DOI] [PubMed] [Google Scholar]
- 7.Kim S-E, Su W, Cho M, Lee Y and Choe W-S, Anal. Biochem, 2012, 424, 12–20. [DOI] [PubMed] [Google Scholar]
- 8.Kneipp K, Wang Y, Kneipp H, Perelman LT, Itzkan I, Dasari RR and Feld MS, Phys. Rev. Lett, 1997, 78, 1667–1670. [Google Scholar]
- 9.Nie S and Emory SR, Science, 1997, 275, 1102–1106. [DOI] [PubMed] [Google Scholar]
- 10.Yang Y, Jiang X, Chao J, Song C, Liu B, Zhu D, Sun Y, Yang B, Zhang Q, Chen Y and Wang L, Sci. China Mater, 2017, 60, 1129–1144. [Google Scholar]
- 11.Kneipp J, Kneipp H, Wittig B and Kneipp K, Nanomed. Nanotechnol. Biol. Med, 2010, 6, 214–226. [DOI] [PubMed] [Google Scholar]
- 12.Mulvaney SP, Musick MD, Keating CD and Natan MJ, Langmuir, 2003, 19, 4784–4790. [Google Scholar]
- 13.Porter MD, Lipert RJ, Siperko LM, Wang G and Narayanan R, Chem. Soc. Rev, 2008, 37, 1001–1011. [DOI] [PubMed] [Google Scholar]
- 14.Wu X, Zhao Y and Zughaier SM, Biosensors, 2021, 11, 234. [DOI] [PMC free article] [PubMed] [Google Scholar]
- 15.Wu X, Chen J, Park B, Huang Y-W and Zhao Y, in Advances in Applied Nanotechnology for Agriculture, American Chemical Society, 2013, vol. 1143, ch. 5, pp. 85–108. [Google Scholar]
- 16.Adir O, Poley M, Chen G, Froim S, Krinsky N, Shklover J, Shainsky-Roitman J, Lammers T and Schroeder A, Adv. Mater, 2020, 32, 1901989. [DOI] [PMC free article] [PubMed] [Google Scholar]
- 17.Ralbovsky NM and Lednev IK, Chem. Soc. Rev, 2020, 49, 7428–7453. [DOI] [PubMed] [Google Scholar]
- 18.He H, Yan S, Lyu D, Xu M, Ye R, Zheng P, Lu X, Wang L and Ren B, Anal. Chem, 2021, 93, 3653–3665. [DOI] [PubMed] [Google Scholar]
- 19.Lussier F, Thibault V, Charron B, Wallace GQ and Masson J-F, TrAC, Trends Anal. Chem, 2020, 124, 115796. [Google Scholar]
- 20.Hung J, Goodman A, Ravel D, Lopes SCP, Rangel GW, Nery OA, Malleret B, Nosten F, Lacerda MVG, Ferreira MU, Rénia L, Duraisingh MT, Costa FTM, Marti M and Carpenter AE, BMC Bioinf, 2020, 21, 300. [DOI] [PMC free article] [PubMed] [Google Scholar]
- 21.O’Connor T, Anand A, Andemariam B and Javidi B, Biomed. Opt. Express, 2020, 11, 4491–4508. [DOI] [PMC free article] [PubMed] [Google Scholar]
- 22.Neaimi MA, Hamadi HA, Yeun CY and Zemerly MJ, 2020. 3rd International Conference on Signal Processing and Information Security (ICSPIS), 2020, 1–4. [Google Scholar]
- 23.Erzina M, Trelin A, Guselnikova O, Dvorankova B, Strnadova K, Perminova A, Ulbrich P, Mares D, Jerabek V, Elashnikov R, Svorcik V and Lyutakov O, Sens. Actuators, B, 2020, 308, 127660. [Google Scholar]
- 24.Ding J, Lin Q, Zhang J, Young GM, Jiang C, Zhong Y and Zhang J, Anal. Bioanal. Chem, 2021, 413, 3801–3811. [DOI] [PubMed] [Google Scholar]
- 25.Cheng N, Chen D, Lou B, Fu J and Wang H, Biosens. Bioelectron, 2021, 186, 113246. [DOI] [PubMed] [Google Scholar]
- 26.Liu YJ and Zhao YP, Phys. Rev. B, 2008, 78, 075436. [Google Scholar]
- 27.Driskell JD, Shanmukh S, Liu Y, Chaney SB, Tang XJ, Zhao YP and Dluhy RA, J. Phys. Chem. C, 2008, 112, 895–901. [Google Scholar]
- 28.Song C, Yang B, Zhu Y, Yang Y and Wang L, Biosens. Bioelectron, 2017, 87, 59–65. [DOI] [PubMed] [Google Scholar]
- 29.Zhang J, Yang Y, Jiang X, Dong C, Song C, Han C and Wang L, Biosens. Bioelectron, 2019, 141, 111402. [DOI] [PubMed] [Google Scholar]
- 30.Song C, Yang Y, Yang B, Sun Y, Zhao YP and Wang L-H, Nanoscale, 2016, 8, 17365–17373. [DOI] [PubMed] [Google Scholar]
- 31.Liu YJ, Chu HY and Zhao YP, J. Phys. Chem. C, 2010, 114, 8176–8183. [Google Scholar]
- 32.Liu YJ, Zhang ZY, Zhao Q, Dluhy RA and Zhao YP, J. Phys. Chem. C, 2009, 113, 9664–9669. [Google Scholar]
- 33.Westphal O, Methods Carbohydrate Chem, 1965, 5, 83. [Google Scholar]
- 34.Soni S, Ernst R, Muszynski A, Mohapatra N, Perry M, Vinogradov E, Carlson R and Gunn J, Front. Microbiol, 2010, 1, 129. [DOI] [PMC free article] [PubMed] [Google Scholar]
- 35.Gao S, Peng D, Zhang W, Muszyński A, Carlson RW and Gu X-X, FEBS J, 2008, 275, 5201–5214. [DOI] [PMC free article] [PubMed] [Google Scholar]
- 36.Davis Michael R, Muszyński A, Lollett Ivonne V, Pritchett Christopher L, Carlson Russell W and Goldberg Joanna B, J. Bacteriol, 2013, 195, 1504–1514. [DOI] [PMC free article] [PubMed] [Google Scholar]
- 37.Haag AF, Wehmeier S, Muszyński A, Kerscher B, Fletcher V, Berry SH, Hold GL, Carlson RW and Ferguson GP, J. Biol. Chem, 2011, 286, 17455–17466. [DOI] [PMC free article] [PubMed] [Google Scholar]
- 38.Jacobson Amy N, Choudhury Biswa P, Fischbach Michael A, Relman David A, Tang Y and Dorrestein P, mBio, 9, e02289–02217. [Google Scholar]
- 39.Steinfeld L, Vafaei A, Rösner J and Merzendorfer H, in Targeting Chitin-containing Organisms, eds. Yang Q and Fukamizo T, Springer Singapore, Singapore, 2019, pp. 19–59. [Google Scholar]
- 40.Li J, Choo-Smith L.-P. i., Tang Z and Sowa MG, J. Raman Spectrosc, 2011, 42, 580–585. [Google Scholar]
- 41.Li B, Sirimuthu NMS, Ray BH and Ryder AG, J. Raman Spectrosc, 2012, 43, 1074–1082. [Google Scholar]
- 42.Ibtehaz N, Chowdhury ME, Khandakar A, Zughaier SM, Kiranyaz S and Rahman MS, 2022, DOI: https://arxiv.org/abs/2201.09737
- 43.Ibtehaz N, Chowdhury MEH, Khandakar A, Kiranyaz S, Rahman MS, Tahir A, Qiblawey Y and Rahman T, IEEE Transactions on Emerging Topics in Computational Intelligence, 2021, DOI: 10.1109/TETCI.2021.3131374, 1–13. [DOI] [Google Scholar]
- 44.Rietschel ET, Kirikae T, Schade FU, Mamat U, Schmidt G, Loppnow H, Ulmer AJ, Zähringer U, Seydel U, Di Padova F, Schreier M and Brade H, FASEB J, 1994, 8, 217–225. [DOI] [PubMed] [Google Scholar]
- 45.Hinton G and Roweis S, presented in part at the Proceedings of the 15th International Conference on Neural Information Processing Systems, 2002, 857–864. [Google Scholar]
- 46.Li J and Vo-Dinh T, Proceedings of SPIE, Plasmonics in Biology and Medicine XIX, 2022, 1197805–1 [Google Scholar]
- 47.Hamed Mozaffari M, Tay Li-Lin, 2021, 10.48550/arXiv.2106.05316. [DOI] [Google Scholar]
- 48.Abell JL, Garren JM, Driskell JD, Tripp RA and Zhao Y, J. Am. Chem. Soc, 2012, 134, 12889–12892. [DOI] [PubMed] [Google Scholar]
Associated Data
This section collects any data citations, data availability statements, or supplementary materials included in this article.