

Abstract
Objectives
The success of type 2 thyroplasty (TP2) for adductor spasmodic dysphonia (AdSD) depends on the selection of optimally sized titanium bridges, which requires accurate assessment of intraoperative vocal changes. While this procedure has traditionally been performed according to the laryngologist's experience, the most appropriate method for voice monitoring and selection of titanium bridge size remains to be determined. This study aimed to investigate evaluation parameters useful for voice monitoring, as these may allow less experienced surgeons to perform TP2 properly.
Methods
In this prospective study, voice monitoring was performed in 18 patients with AdSD patients undergoing TP2. Evaluations were performed preoperatively, intraoperatively, 13 weeks postoperatively, and 52 weeks postoperatively using GRBAS (grade, roughness, breathiness, asthenia, and strain), as well as perceptual judgment and acoustic analyses.
Results
Preoperative and intraoperative assessments of the G, R, B, and S parameters, perceptual judgment, and harmonic‐to‐noise ratio (HNR) were in moderate or better agreement. Intraoperative and 13‐ or 52‐week postoperative measurements of the R, B, and G parameters and strangulation, tremor, and HNR were also in high agreement. When two different sizes of titanium bridges were compared (unselected vs. selected), ratings for G, R, S, strangulation, tremor, jitter, shimmer, HNR, standard deviation of F0, and degree of voice breaks were better for the selected width than the unselected width.
Conclusion
The candidate items for intraoperative voice monitoring during TP2 for AdSD are G, R, strangulation, tremor, and HNR. The use of these items may help to ensure successful TP2 and contribute to the advancement of laryngeal framework surgery.
Level of evidence
Level 4.
Keywords: acoustic analysis, GRBAS scale, perceptual judgment, type 2 thyroplasty, voice monitoring
Concept of intraoperative voice monitoring of type 2 thyroplasty for adductor spasmodic dysphonia.
1. INTRODUCTION
Spasmodic dysphonia (SD) is a focal, adult‐onset dystonia affecting laryngeal muscles. 1 , 2 SD causes vocal impairment due to involuntary and intermittent spasms of the intralaryngeal muscles during phonation. 3 SD is classified into adductor, abductor, and mixed types. Among these, adductor SD (AdSD) accounts for 90%–95% of SD cases. 4
Type 2 thyroplasty (TP2) using titanium bridges has been associated with long‐term symptomatic improvement in AdSD patients. 5 , 6 , 7 After confirming the appropriateness of the bridge openings using a mosquito pean or similar device, one bridge is inserted along the detached area at the inferior margin of the thyroid cartilage, while the other is inserted in the area superior to the anterior commissure. 8 , 9 Procedure success depends on the selection of optimally sized titanium brides, which requires accurate assessment of intraoperative vocal changes. 8 The sizes of the upper and lower components should be selected such that strangulated vocal symptoms disappear without inducing hoarseness, although the final decision should be agreed upon by the patient and surgeon.
Despite the importance of intraoperative voice monitoring for surgical success, there are no objective indices that can be used to determine the appropriate size of the titanium bridge, which has largely been dependent on each surgeon's experience. 9 The present study represents the first attempt to investigate aspects of voice monitoring that can enable less experienced surgeons to perform TP2 properly. Specifically, we aimed to identify reliable, responsive indicators related to intraoperative voice monitoring meeting the following three requirements:
Within each patient, results of intraoperative voice monitoring should be the same regardless of differences in the measurement environment (e.g., presence or absence of noise).
Intraoperative findings can be used to predict long‐term postoperative outcomes.
Intraoperative findings enable the selection of an appropriately sized titanium bridge.
2. MATERIALS AND METHODS
This exploratory study was conducted in conjunction with an investigator‐initiated clinical trial of titanium bridge, the protocol of which was approved by the Pharmaceuticals and Medical Devices Agency before study commencement. The full protocol of the current study was approved by the institutional review boards at each participating center, and all participants provided written informed consent before recruitment.
Between July 2015 and March 2017, 18 eligible patients treated at 4 Japan‐based centers (Kumamoto University, Hokkaido University, Yokohama City University, and Kyoto University) were enrolled. Eligibility criteria included age 18–80 years, AdSD diagnosis by a certified otolaryngologist, history of AdSD‐related vocal symptoms for ≥1 year, and scores of more than 20 on the Voice Handicap Index‐10. 10 Vocal symptoms in AdSD patients undergoing TP2 with titanium bridges were evaluated using GRBAS (grade, roughness, breathiness, asthenia, and strain) as well as perceptual judgment and acoustic analyses.
2.1. Intervention
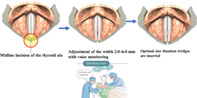
Under local anesthesia, the thyroid cartilage was then incised at the midline, leaving the underlying soft tissue intact. The edges of the incised thyroid cartilage were pulled apart by 2–6 mm to allow for voice monitoring (Figure 1). To maintain separation, two titanium bridges (2.0, 3.0, 4.0, 5.0, and 6.0 mm in width) were inserted above and below the anterior commissure. 8 , 9
FIGURE 1.

Concept of intraoperative voice monitoring
2.2. Evaluation period and comparisons
To evaluate whether intraoperative voice monitoring is possible regardless of differences in the measurement environment, we compared preoperative vocal parameters measured in a soundproof room with intraoperative vocal parameters measured before the opening of the thyroid cartilage in the operating room (Figure 2). To evaluate whether the results of intraoperative voice monitoring can be used to predict long‐term postoperative outcomes, we compared assessment results obtained at 13 and 52 weeks postoperatively with intraoperative results for the selected bridge. To confirm that opening the thyroid cartilage improves symptoms, voice data obtained from before opening the thyroid cartilage were compared with that obtained at the selected width. To evaluate whether the results of intraoperative voice monitoring can be used to determine the optimal size of titanium bridge, voice data obtained at the time of cartilage opening were compared with those obtained for an unselected bridge width, and the intraoperative width was compared with the selected width (Table 1).
FIGURE 2.

Evaluation period and comparisons. ① Agreement between preoperative and intraoperative evaluations. ② Comparison of measurements obtained at the selected width and 13 weeks postoperatively. ③ Comparison of measurements obtained at the selected width and 52 weeks postoperatively. ④ Comparison of measurements obtained before and after opening the glottis. ⑤ Comparison of intraoperative measurements at the unselected width versus selected width. The selected width is the final width decided by the surgeon and patient, while the unselected width is the width used for comparison before the final selection is made
TABLE 1.
Patient characteristics
| Pt | Age (year) | Sex | Disease period a (M) | Size of titanium bridges | GRBAS scale | Perceptual judgment | Acoustic analysis | |||||||||||||
|---|---|---|---|---|---|---|---|---|---|---|---|---|---|---|---|---|---|---|---|---|
| Selected width (mm) | Unselected width (mm) | Grade | Rough | Breathy | Asthenic | Strained | Strangulation | Tremor | Interruption | Jitter (%) | Shimmer (%) | HNR (dB) | SDF0 (Hz) | DVB (%) | ||||||
| Cranial | Caudal | Cranial | Caudal | |||||||||||||||||
| 1 | 21 | F | 92 | 2 | 3 | 3 | 2 | 1 | 1 | 1 | 0 | 1 | 2 | 0 | 0 | 1.640 | 5.917 | 7.870 | 4.875 | 0.000 |
| 2 | 23 | F | 37 | 3 | 2 | 2 | 2 | 1 | 1 | 0 | 0 | 1 | 1 | 0 | 0 | 0.325 | 4.072 | 8.894 | 1.159 | 0.000 |
| 3 | 72 | F | 140 | 3 | 3 | 3 | 2 | 3 | 1 | 2 | 0 | 3 | 2 | 2 | 2 | 6.622 | 21.432 | 0.496 | 34.749 | 63.788 |
| 4 | 33 | F | 285 | 4 | 4 | 3 | 4 | 1 | 0 | 1 | 0 | 1 | 1 | 0 | 0 | 1.058 | 4.416 | 8.601 | 5.763 | 0.000 |
| 5 | 33 | F | 33 | 2 | 3 | 3 | 3 | 1 | 0 | 0 | 0 | 1 | 1 | 0 | 0 | 0.787 | 4.265 | 8.996 | 2.492 | 0.000 |
| 6 | 68 | F | 276 | 4 | 3 | 3 | 3 | 2 | 1 | 1 | 1 | 0 | 2 | 1 | 0 | 3.157 | 8.946 | 7.011 | 6.317 | 0.000 |
| 7 | 31 | M | 96 | 4 | 4 | 2 | 2 | 1 | 1 | 0 | 0 | 1 | 1 | 2 | 0 | 1.962 | 8.071 | 4.248 | 12.322 | 0.521 |
| 8 | 41 | F | 158 | 2 | 3 | 2 | 2 | 2 | 1 | 1 | 0 | 2 | 2 | 2 | 0 | 3.420 | 9.087 | 5.670 | 19.645 | 0.148 |
| 9 | 21 | F | 38 | 3 | 4 | 4 | 4 | 1 | 0 | 1 | 0 | 1 | 0 | 0 | 0 | 0.497 | 2.700 | 9.393 | 1.855 | 0.000 |
| 10 | 23 | M | 48 | 6 | 6 | Unassessed | Unassessed | 2 | 2 | 1 | 0 | 1 | 1 | 1 | 0 | 2.488 | 7.072 | 6.968 | 4.097 | 0.000 |
| 11 | 79 | F | 73 | 2 | 3 | Unassessed | Unassessed | 3 | 1 | 0 | 0 | 3 | 2 | 1 | 2 | 3.804 | 8.738 | 5.301 | 44.066 | 11.195 |
| 12 | 33 | F | 106 | 4 | 3 | 4 | 4 | 2 | 1 | 1 | 0 | 1 | 2 | 2 | 0 | 3.034 | 8.901 | 6.615 | 41.169 | 2.185 |
| 13 | 53 | F | 335 | 3 | 4 | 3 | 3 | 2 | 1 | 1 | 0 | 1 | 1 | 1 | 0 | 1.170 | 5.877 | 7.399 | 5.964 | 0.000 |
| 14 | 52 | F | 119 | 6 | 5 | 5 | 5 | 3 | 2 | 1 | 0 | 3 | 2 | 1 | 2 | 8.744 | 17.475 | 1.870 | 24.249 | 75.213 |
| 15 | 41 | M | 45 | 4 | 4 | 4 | 3 | 2 | 2 | 1 | 0 | 2 | 2 | 1 | 0 | 3.988 | 10.703 | 3.840 | 50.006 | 0.602 |
| 16 | 21 | F | 117 | 3 | 3 | 3 | 2 | 1 | 1 | 0 | 0 | 1 | 2 | 1 | 0 | 1.042 | 3.418 | 8.181 | 4.917 | 0.000 |
| 17 | 44 | F | 82 | 2 | 2 | 3 | 3 | 2 | 1 | 0 | 0 | 2 | 2 | 2 | 0 | 1.009 | 3.003 | 7.055 | 4.349 | 4.404 |
| 18 | 31 | F | 131 | 3 | 2 | 2 | 2 | 1 | 0 | 0 | 0 | 1 | 1 | 0 | 0 | 0.169 | 1.312 | 9.625 | 2.387 | 0.000 |
Note: The duration of disease distress is based on the patient's report and may therefore not indicate the onset of disease.
Abbreviations: DVB, degree of voice breaks; F, female; HNR, harmonic‐to‐noise ratio; M, male; SNF0, standard deviation of F0.
Period from symptom onset to surgery.
2.3. Voice recording and evaluation methods
Preoperatively and at 13 and 52 weeks postoperatively, sustained vowels (/a/ or /e/) and phrases that were difficult for the patient to articulate were recorded in a soundproof room. 11 , 12 Intraoperatively, the same parameters were recorded using a unidirectional microphone placed 20 cm from the patient's mouth. Intraoperative voice recording was performed thrice: once before opening the thyroid cartilage and twice when opening the thyroid cartilage (selected and unselected width).
Voice recordings were evaluated by a Central Evaluation Committee (CEC), which included three certified otolaryngologists from the University of Tokyo. All data were evaluated in a double‐anonymized fashion. The timing of each evaluation is shown in Figure 2.
2.4. GRBAS scale
GRBAS is widely utilized for auditory/perceptual assessments of voice quality in a clinical setting. 13 , 14 In this scale, G, R, B, A, and S refer to the severity of hoarseness, roughness, breathiness, asthenia, and strain, respectively. Each element is scored as follows: 0, normal; 1, slight; 2, medium; or 3, high.
2.5. Perceptual judgment of the three characteristics
Perceptual judgment was performed based on three characteristics of each sample: strangulation (tightness of voice production), interruption (abrupt initiation and arrest of voice), and tremor (rapid fluctuations in pitch or loudness). 6 These three parameters were rated on a three‐point scale (absent [0] < nearly absent [1] < present [2]).
Since it is recommended that the degree of self‐awareness be represented as a rank variable (perceptual judgment), discrepancies in GRBAS ratings among the committee members were resolved by selecting the higher value, based on a majority vote. When discrepancies were observed in two or more evaluations, the results were re‐evaluated by all three evaluators. However, even when differences were observed between two or more evaluations, results were adopted when numerical values were agreed between two examiners.
2.6. Acoustic analysis
Acoustic signals were digitally processed by the CEC using the CSL3700 software program and the Multi‐Dimensional Voice Program 5105 (Kay‐Pentax).
For each sample, data were analyzed for a period of 5 s after the midpoint of the sustained vowel. The following parameters were measured: (1) shimmer (%), defined as cycle‐to‐cycle variation in signal amplitude; (2) jitter (%), defined as cycle‐to‐cycle variation in frequency; (3) harmonic‐to‐noise ratio (HNR) (dB), defined as the ratio of acoustic energy in the harmonic versus the noise components contained in the acoustic spectrum; (4) standard deviation of F0 (SDF0) (Hz), defined as the square root of the variance around the mean fundamental frequency; and (5) the degree of voice breaks (DVB) (%), defined as the total duration of the breaks between the voiced parts of the signal divided by the total signal duration.
Jitter, shimmer, and HNR were measured to assess hoarseness, while SDF0 and DVB were measured to assess the degree of voice tremor and interruption.
2.7. Statistical analysis
Observed agreement was calculated to determine the level of agreement for all qualitative (ordinal variable) variables for GRBAS and perceptual judgment. Under such conditions, we suggest that observed agreement values <0.4 are indicative of poor reliability, values between 0.4 and 0.6 indicate moderate reliability, values between 0.6 and 0.8 indicate good reliability, and values >0.8 indicate excellent reliability.
For the selected width versus unselected width, indicators were assessed to determine which width was more appropriate for measurement. For qualitative (ordinal) variables, the number of cases with favorable evaluation results was compared among each measurement point (hereafter referred to as “the number of superior cases”). Evaluations that were considered good are indicated in yellow in Tables 2 and 3.
TABLE 2.
GRBAS scale
| Before opening glottis | 13 weeks Post‐op | 52 weeks Post‐op | Unselected width | |||||||||||||||||||||||||||||||||
|---|---|---|---|---|---|---|---|---|---|---|---|---|---|---|---|---|---|---|---|---|---|---|---|---|---|---|---|---|---|---|---|---|---|---|---|---|
| 0 | 1 | 2 | 3 | Total | Observed agreement | 0 | 1 | 2 | 3 | Total | Observed agreement | 0 | 1 | 2 | 3 | Total | Observed agreement | 0 | 1 | 2 | 3 | Total | No. of superior cases with selected width | No. of superior cases with unselected width | ||||||||||||
| Grade | Pre‐op. | 0 | 0 | 0 | 0 | 0 | 0 | 0.556 | Grade | Selected width | 0 | 0 | 3 | 0 | 0 | 3 | 0.556 | Grade | Selected width | 0 | 0 | 2 | 1 | 0 | 3 | 0.611 | Grade | Selected width | 0 | 0 | 3 | 0 | 0 | 3 | 4 | 2 |
| 1 | 0 | 3 | 5 | 0 | 8 | 1 | 2 | 9 | 1 | 0 | 12 | 1 | 0 | 10 | 2 | 0 | 12 | 1 | 1 | 10 | 0 | 1 | 12 | |||||||||||||
| 2 | 0 | 1 | 5 | 1 | 7 | 2 | 0 | 1 | 1 | 1 | 3 | 2 | 0 | 1 | 1 | 1 | 3 | 2 | 0 | 1 | 2 | 0 | 3 | |||||||||||||
| 3 | 0 | 0 | 1 | 2 | 3 | 3 | 0 | 0 | 0 | 0 | 0 | 3 | 0 | 0 | 0 | 0 | 0 | 3 | 0 | 0 | 0 | 0 | 0 | |||||||||||||
| Total | 0 | 4 | 11 | 3 | 18 | Total | 2 | 13 | 2 | 1 | 18 | Total | 0 | 13 | 4 | 1 | 18 | Total | 1 | 14 | 2 | 1 | 18 | |||||||||||||
| Rough | Pre‐op. | 0 | 2 | 2 | 0 | 0 | 4 | 0.667 | Rough | Selected width | 0 | 8 | 0 | 0 | 0 | 8 | 0.833 | Rough | Selected width | 0 | 5 | 3 | 0 | 0 | 8 | 0.667 | Rough | Selected width | 0 | 6 | 2 | 0 | 0 | 8 | 3 | 2 |
| 1 | 2 | 8 | 1 | 0 | 11 | 1 | 2 | 7 | 1 | 0 | 10 | 1 | 2 | 7 | 1 | 0 | 10 | 1 | 2 | 7 | 1 | 0 | 10 | |||||||||||||
| 2 | 0 | 1 | 2 | 0 | 3 | 2 | 0 | 0 | 0 | 0 | 0 | 2 | 0 | 0 | 0 | 0 | 0 | 2 | 0 | 0 | 0 | 0 | 0 | |||||||||||||
| 3 | 0 | 0 | 0 | 0 | 0 | 3 | 0 | 0 | 0 | 0 | 0 | 3 | 0 | 0 | 0 | 0 | 0 | 3 | 0 | 0 | 0 | 0 | 0 | |||||||||||||
| Total | 1 | 11 | 3 | 0 | 18 | Total | 10 | 7 | 1 | 0 | 18 | Total | 7 | 10 | 1 | 0 | 18 | Total | 8 | 9 | 1 | 0 | 18 | |||||||||||||
| Breathy | Pre‐op. | 0 | 6 | 1 | 0 | 0 | 7 | 0.500 | Breathy | Selected width | 0 | 7 | 3 | 0 | 0 | 10 | 0.667 | Breathy | Selected width | 0 | 7 | 2 | 1 | 0 | 10 | 0.556 | Breathy | Selected width | 0 | 9 | 1 | 0 | 0 | 10 | 1 | 2 |
| 1 | 4 | 3 | 3 | 0 | 10 | 1 | 2 | 4 | 1 | 0 | 7 | 1 | 3 | 2 | 2 | 0 | 7 | 1 | 1 | 6 | 0 | 0 | 7 | |||||||||||||
| 2 | 0 | 1 | 0 | 0 | 1 | 2 | 0 | 0 | 1 | 0 | 1 | 2 | 0 | 0 | 1 | 0 | 1 | 2 | 0 | 1 | 0 | 0 | 1 | |||||||||||||
| 3 | 0 | 0 | 0 | 0 | 0 | 3 | 0 | 0 | 0 | 0 | 0 | 3 | 0 | 0 | 0 | 0 | 0 | 3 | 0 | 0 | 0 | 0 | 0 | |||||||||||||
| Total | 10 | 5 | 3 | 0 | 18 | Total | 9 | 7 | 2 | 0 | 18 | Total | 10 | 4 | 4 | 0 | 18 | Total | 10 | 8 | 0 | 0 | 18 | |||||||||||||
| Asthenic | Pre‐op. | 0 | 17 | 0 | 0 | 0 | 17 | 0.944 | Asthenic | Selected width | 0 | 16 | 1 | 0 | 0 | 17 | 0.944 | Asthenic | Selected width | 0 | 16 | 1 | 0 | 0 | 17 | 0.889 | Asthenic | Selected width | 0 | 17 | 0 | 0 | 0 | 17 | 0 | 1 |
| 1 | 1 | 0 | 0 | 0 | 1 | 1 | 0 | 1 | 0 | 0 | 1 | 1 | 1 | 0 | 0 | 0 | 1 | 1 | 1 | 0 | 0 | 0 | 1 | |||||||||||||
| 2 | 0 | 0 | 0 | 0 | 0 | 2 | 0 | 0 | 0 | 0 | 0 | 2 | 0 | 0 | 0 | 0 | 0 | 2 | 0 | 0 | 0 | 0 | 0 | |||||||||||||
| 3 | 0 | 0 | 0 | 0 | 0 | 3 | 0 | 0 | 0 | 0 | 0 | 3 | 0 | 0 | 0 | 0 | 0 | 3 | 0 | 0 | 0 | 0 | 0 | |||||||||||||
| Total | 18 | 0 | 0 | 0 | 18 | Total | 16 | 2 | 0 | 0 | 18 | Total | 17 | 1 | 0 | 0 | 18 | Total | 18 | 0 | 0 | 0 | 18 | |||||||||||||
| Strained | Pre‐op. | 0 | 0 | 1 | 0 | 0 | 1 | 0.556 | Strained | Selected width | 0 | 2 | 5 | 0 | 0 | 7 | 0.389 | Strained | Selected width | 0 | 3 | 3 | 1 | 0 | 7 | 0.556 | Strained | Selected width | 0 | 3 | 4 | 0 | 0 | 7 | 5 | 4 |
| 1 | 0 | 6 | 5 | 0 | 11 | 1 | 4 | 5 | 0 | 0 | 9 | 1 | 2 | 7 | 0 | 0 | 9 | 1 | 3 | 5 | 0 | 1 | 9 | |||||||||||||
| 2 | 0 | 0 | 2 | 1 | 3 | 2 | 0 | 1 | 0 | 1 | 2 | 2 | 0 | 1 | 0 | 1 | 2 | 2 | 0 | 1 | 1 | 0 | 2 | |||||||||||||
| 3 | 0 | 0 | 1 | 2 | 3 | 3 | 0 | 0 | 0 | 0 | 0 | 3 | 0 | 0 | 0 | 0 | 0 | 3 | 0 | 0 | 0 | 0 | 0 | |||||||||||||
| Total | 0 | 7 | 8 | 3 | 18 | Total | 6 | 11 | 0 | 1 | 18 | Total | 5 | 11 | 1 | 1 | 18 | Total | 6 | 10 | 1 | 1 | 18 | |||||||||||||
Note: Yellow = superior value; blue = inferior value; gray = matching value.
TABLE 3.
Perceptual judgment
| Before opening glottis | 13 weeks Post‐op | 52 weeks Post‐op | Unselected width | |||||||||||||||||||||||||||||
|---|---|---|---|---|---|---|---|---|---|---|---|---|---|---|---|---|---|---|---|---|---|---|---|---|---|---|---|---|---|---|---|---|
| 0 | 1 | 2 | Total | Observed agreement | 0 | 1 | 2 | Total | Observed agreement | 0 | 1 | 2 | Total | Observed agreement | 0 | 1 | 2 | Total | No. of superior cases with selected width | No. of superior cases with unselected width | ||||||||||||
| Strangulation | Pre‐op. | 0 | 0 | 1 | 0 | 1 | 0.722 | Strangulation | Selected width | 0 | 6 | 1 | 0 | 7 | 0.778 | Strangulation | Selected width | 0 | 5 | 2 | 0 | 7 | 0.722 | Strangulation | Selected width | 0 | 4 | 3 | 0 | 7 | 5 | 1 |
| 1 | 0 | 4 | 3 | 7 | 1 | 2 | 7 | 0 | 9 | 1 | 2 | 7 | 0 | 9 | 1 | 0 | 7 | 2 | 9 | |||||||||||||
| 2 | 0 | 1 | 9 | 10 | 2 | 0 | 1 | 1 | 2 | 2 | 0 | 1 | 1 | 2 | 2 | 0 | 1 | 1 | 2 | |||||||||||||
| Total | 0 | 6 | 12 | 18 | Total | 8 | 9 | 1 | 18 | Total | 7 | 10 | 1 | 18 | Total | 4 | 11 | 3 | 18 | |||||||||||||
| Tremor | Pre‐op. | 0 | 3 | 1 | 2 | 6 | 0.611 | Tremor | Selected width | 0 | 9 | 0 | 1 | 10 | 0.611 | Tremor | Selected width | 0 | 7 | 2 | 1 | 10 | 0.556 | Tremor | Selected width | 0 | 8 | 2 | 0 | 10 | 5 | 2 |
| 1 | 1 | 5 | 1 | 7 | 1 | 4 | 1 | 2 | 7 | 1 | 4 | 2 | 1 | 7 | 1 | 2 | 2 | 3 | 7 | |||||||||||||
| 2 | 0 | 2 | 3 | 5 | 2 | 0 | 0 | 1 | 1 | 2 | 0 | 0 | 1 | 1 | 2 | 0 | 0 | 1 | 1 | |||||||||||||
| Total | 4 | 8 | 6 | 18 | Total | 13 | 1 | 4 | 18 | Total | 11 | 4 | 3 | 18 | Total | 10 | 4 | 4 | 18 | |||||||||||||
| Interruption | Pre‐op. | 0 | 12 | 3 | 0 | 15 | 0.667 | Interruption | Selected width | 0 | 17 | 1 | 0 | 18 | 0.944 | Interruption | Selected width | 0 | 17 | 0 | 1 | 18 | 0.944 | Interruption | Selected width | 0 | 17 | 1 | 0 | 18 | 1 | 0 |
| 1 | 0 | 0 | 0 | 0 | 1 | 0 | 0 | 0 | 0 | 1 | 0 | 0 | 0 | 0 | 1 | 0 | 0 | 0 | 0 | |||||||||||||
| 2 | 1 | 2 | 0 | 3 | 2 | 0 | 0 | 0 | 0 | 2 | 0 | 0 | 0 | 0 | 2 | 0 | 0 | 0 | 0 | |||||||||||||
| Total | 13 | 5 | 0 | 18 | Total | 17 | 1 | 0 | 18 | Total | 17 | 0 | 1 | 18 | Total | 17 | 1 | 0 | 18 | |||||||||||||
| Note: Yellow = superior value; blue = inferior value; gray = matching value. | ||||||||||||||||||||||||||||||||
For acoustic analysis, relationships between two‐time points were evaluated by standard major axis (SMA) regression analysis. We defined a favorable slope regarding agreement (hereafter referred to as “slope close to 1.0”) when the slope of the SMA regression analysis based on the assessments between the two‐time points was within the range of 0.77–1.3. Pearson's correlation coefficients were used for correlation coefficients. Generally, a value for Pearson's correlation coefficients of >0.7 is considered a strong correlation. Value between 0.4 and 0.7 indicates moderate correlation and that <0.4 indicates weak or no correlation.
3. RESULTS
Of the 21 patients who participated in the clinical trial for titanium bridges, 18 patients (3 males and 15 females; mean age: 40 [21–79] years) agreed to participate in this exploratory study. The characteristics of these participants are shown in Table 1. In two patients, intraoperative audio recordings were not obtained for the unselected bridge width.
3.1. GRBAS scale
For the A parameter, the observed agreement between preoperative ratings and those obtained before cartilage opening glottis was 0.944, indicative of excellent agreement (Table 2). However, this was due to the fact that 17 of 18 cases were rated 0. The observed agreement for the R parameter was 0.667, indicative of good agreements. The observed agreement for the G, B, and S parameters was 0.556, 0.500, and 0.556, respectively, indicative of moderate agreement.
For the selected bridge width, the observed agreement between intraoperative ratings and those obtained 13 weeks postoperatively was 0.833 and 0.944 for the R and A parameters, respectively, indicative of excellent agreement. Zero evaluation of the A parameter was made in 17 of 18 cases. The observed agreement for the B parameter was 0.667, indicative of good agreement. The observed agreement for the G parameter was 0.556, indicative of moderate agreement.
Further analysis indicated that observed agreement between intraoperative ratings and those obtained 52 weeks postoperative was 0.889 for the A parameter, indicative of excellent agreement. Additionally, zero evaluation of the A parameter was made in 17 of 18 cases. The observed agreement for the G and R parameters was 0.611 and 0.667, respectively, indicative of good agreements. The observed agreement for the B and S parameters was 0.556 and 0.556, respectively, indicative of moderate agreements.
Based on the number of superior cases, intraoperative measurements for selected width were regarded as better than measurements for unselected width for the G, R, and S parameters.
3.2. Perceptual judgment
The observed agreement of the strangulation, tremor, and interruption parameters for between preoperative ratings and those obtained before cartilage opening glottis was 0.722, 0.611, and 0.667, respectively, indicative of good agreement (Table 3).
For the selected width, the observed agreement for interruption between intraoperative measurements and those obtained 13 weeks postoperatively was 0.944, indicative of excellent agreement. For strangulation and tremor, the observed agreement was 0.778 and 0.611, respectively, indicative of good agreement. When the intraoperative measurement was compared with measurement at 52 weeks postoperatively, the observed agreement of interruption was 0.944, indicative of excellent agreement. Additionally, zero evaluation of the interruption parameter was made in 17 of 18 cases. The observed agreement for strangulation and tremor was 0.722 and 0.556, respectively, indicative of good agreement.
When the number of superior cases was used to determine the most appropriate time point, measurement at the selected width was considered better for all parameters than measurement at the unselected width.
3.3. Acoustic analysis
SMA regression analysis between time points for preoperative and intraoperative measurements was obtained before opening the glottis (Figure S1, Table 4). Pearson's correlation coefficients for HNR, jitter, shimmer, and DVB were 0.802, 0.703, 0.606, and 0.563, indicative of strong, strong, moderate, and moderate correlation, respectively. For the HNR and SDF0, the slopes of SMA regression analyses between preoperative ratings and those obtained before cartilage opening glottis were 0.924 and 1.094, respectively, within the range of 0.77–1.3, indicative of a slope close to 1.0.
TABLE 4.
Acoustic analysis
| Pre‐op. vs. before opening glottis | Selected width vs. 13 weeks post‐op | Selected width vs. 52 weeks post‐op | Selected width vs. unselected width | |||||||||||
|---|---|---|---|---|---|---|---|---|---|---|---|---|---|---|
| Mean (SD) at pre‐op | Mean (SD) before opening glottis | Slope of SMA regression | Pearson correlation coefficient | Mean (SD) with selected width | Mean (SD) at 13 weeks post‐op | Slope of SMA regression | Pearson correlation coefficient | Mean (SD) with selected width | Mean (SD) at 52 weeks post‐op | Slope of SMA regression | Pearson correlation coefficient | Mean (SD) with selected width | Mean (SD) with unselected width | |
| Jitter (%) | 2.4953(2.2725) | 2.0004(1.4148) | 0.623 | 0.703 | 1.4707(1.5932) | 2.1805(2.4148) | 1.516 | 0.771 | 1.4707(1.5932) | 2.2296(2.6923) | 1.690 | 0.825 | 1.4707(1.5932) | 1.5853(1.7847) |
| Shimmer (%) | 7.5225(5.1309) | 7.0266(3.3212) | 0.647 | 0.606 | 4.4663(2.4567) | 6.5591(5.2360) | 2.131 | 0.694 | 4.4663(2.4567) | 7.2369(7.5769) | 3.084 | 0.701 | 4.4663(2.4567) | 6.0844(5.8709) |
| HNR (dB) | 6.5574(2.5727) | 6.2595(2.3773) | 0.924 | 0.802 | 7.9865(2.0053) | 7.6836(2.5328) | 1.263 | 0.753 | 7.9865(2.0053) | 7.4103(2.4976) | 1.245 | 0.673 | 7.9865(2.0053) | 7.5661(2.6683) |
| SDF0 (Hz) | 15.0212(16.4820) | 18.4372(18.0268) | 1.094 | 0.395 | 7.587(10.5492) | 14.8216(24.7129) | 2.343 | 0.642 | 7.587(10.5492) | 11.1660(23.4800) | 2.194 | 0.969 | 7.5870(10.5492) | 14.3465(20.1973) |
| DVB (%) | 8.7809(22.3451) | 3.9824(8.0488) | 0.360 | 0.563 | 1.4064(5.3782) | 1.5669(6.0684) | 1.128 | 1.000 | 1.4064(5.3782) | 3.4523(12.8820) | 2.395 | 0.999 | 1.4064(5.3782) | 2.6347(9.9673) |
Abbreviations: DVB, degree of voice breaks; HNR, harmonic‐to‐noise ratio; SD, standard deviation; SMA, standard major axis; SNF0, standard deviation of F0.
When measurement at the selected width was compared with measurement 13 weeks postoperatively (Figure S2), the Pearson's correlation coefficients for DVB, jitter, and HNR were 1.000, 0.771, and 0.753, respectively, indicative of a strong relationship. Moreover, Pearson's correlation coefficients for shimmer and SDF0 were 0.694 and 0.642, respectively, indicative of a moderate relationship. For the HNR and DVB, the slopes of SMA regression were 1.263 and 1.128, respectively, within the range of 0.77–1.3, indicative of a slope close to 1.0.
When measurements at the selected width were compared with measurements at 52 weeks postoperatively (Figure S3), Pearson's correlation coefficients for DVB, SDF0, jitter, and shimmer were 0.999, 0.969, 0.825, and 0.701, respectively, indicative of a strong relationship. Moreover, Pearson's correlation coefficient for HNR was 0.673, indicative of a moderate relationship. For the HNR, the slope of SMA regression was 1.245 within the range of 0.77–1.3, indicative of a slope close to 1.0.
When intraoperative measurements were compared for the selected width and unselected width, for HNR the means of the selected width were larger than the means of the unselected width. Conversely, for jitter, shimmer, SDF0, and DVB, the mean of the selected width was smaller than the mean of the unselected width. Therefore, we considered measurement at the selected width better for all parameters than measurement at the unselected width.
4. DISCUSSION
During laryngeal framework surgery to improve vocal quality, the patient's voice is monitored when altering the position of the cartilage and shape of the vocal folds. 15 Vocal adjustments are determined based on the surgeon's experience and patient compliance, and they are currently limited by the degree of knowledge among surgeons and inadequate evaluative procedures. In patients undergoing TP2 for AdSD, it is especially important to select an optimally sized titanium bridge to improve long‐term vocal outcomes. 8 Currently surgeons make decisions regarding bridge size based on vocal assessments in which the patient produces vowels or phrases with which they have struggled under intraoperative noise. However, the effectiveness of this method remains to be verified.
Therefore, we aimed to determine (1) whether intraoperative voice monitoring results for the same patient were the same regardless of the measurement environment and (2) whether intraoperative findings can be used to predict long‐term postoperative findings. Therefore, we conducted a prospective multicenter study to examine the validity of surgeon's judgments and evaluation items for determining the correct bridge size.
Several studies have examined the reliability and validity of GRBAS. 14 , 16 , 17 , 18 In research on the interrater agreement, the best agreement between observers was obtained for the G parameter and worst for the S parameter. 17 Since the main symptoms of AdSD include vocal strangulation, interruption, and tremor, we believe that assessment using GRBAS alone is insufficient. Therefore, we also performed perceptual judgment and acoustic analysis for objective assessment. 6
4.1. Reliability of intraoperative voice monitoring
Between preoperative ratings and those obtained before cartilage opening glottis, the G, R, B, and S parameters of GRBAS and the results of perceptual judgment exhibited a relatively high agreement for each element. In the acoustic analysis, we observed a strong correlation for HNR and jitter. Pearson's correlation coefficients for shimmer and DVB measurements indicated a moderate correlation. The regression sloop of HNR was close to 1.0 at 0.924, indicating that monitoring is suitable. Thus, evaluations performed in the operating room can be considered equally valid when compared with those obtained in a soundproof room in the outpatient clinic.
4.2. Intraoperative monitoring evaluation can predict long‐term postoperative assessment
When intraoperative measurement at the selected width was compared with measurement at 13 and 52 weeks postoperatively, moderate or better agreement was observed for the G, R, B, and A parameters in GRBAS. In the perceptual judgment, reliability was excellent or good for strangulation tremor and interruption. In the acoustic analysis, all parameters were correlated with selected width and at 13 and 52 weeks postoperatively. These results demonstrate the effectiveness of TP2 using intraoperative voice monitoring for improving vocal symptoms and preventing hoarseness.
Based on the present study, the intraoperative findings of G, R, B, and A of GRBAS, strangulation, tremor, and interruption of the perceptual judgment, and the HNR of acoustic analysis may be used to predict long‐term postoperative outcomes.
4.3. Evaluation of intraoperative monitoring allows for the correct selection of titanium bridge
Based on the number of superior cases, selected width was regarded as better than measurements for unselected width for G, R, and S. The lower scores for B may have been caused by vocal weakening to attenuate strangulation with the selected width. However, in the acoustic analysis, intraoperative ratings were better for all items. Furthermore, in the perceptual judgment, ratings for all three items suggested the selection of an optimally sized titanium bridge. This study suggests that the intraoperative findings of G, R, and S of GRBAS, strangulation, tremor, and interruption of the perceptual judgment, and jitter, shimmer, HNR, SDF0, and DVB of acoustic analysis may enable the selection of an appropriately sized titanium bridge.
Based on the requirements outlined in the Introduction, the candidate items for intraoperative voice monitoring in TP2 included the R parameter of GRBAS, strangulation results in the perceptual judgment, and HNR result in the acoustic analysis. In this study, the surgeon's assessment was evaluated by a third party based on consensus, which demonstrated that measurements obtained by a skilled surgeon in the operating room are valid. This result highlights the importance of proficiency in auditory evaluation among surgeons.
Although the current study identified items useful for intraoperative voice monitoring, further validation studies are required. The use of these items may help ensure successful TP2 outcomes under local anesthesia, act as a reference for less experienced surgeons, and contribute to the advancement of laryngeal framework surgery.
The small sample size may be one of the limitations of this study, and the scope of future research should include larger prospective studies to generalize the findings. The use of acoustic analysis for intraoperative voice monitoring is good for assessing hoarseness. However, this may be another limitation of the study for tremor and interruption, as acoustic analysis is limited in its assessment of SD and dysphonia in general. 19
5. CONCLUSION
Herein, we evaluated the validity of intraoperative voice monitoring results for patients undergoing TP2 under local anesthesia. Our analysis revealed no significant differences in evaluation results between the operating and soundproof rooms of the outpatient clinic, that the surgeon's evaluation was valid, and that the intraoperative evaluation was in agreement with the results at 13 and 52 weeks postoperatively. Based on the current findings the candidate items for intraoperative voice monitoring during TP2 include the G and R parameters of GRBAS, strangulation and tremor during perceptual judgment, and HNR during acoustic analysis.
FUNDING INFORMATION
This study was supported by the Practical Research Project for Rare/Intractable Diseases (16ek0109006), the Japan Agency for Medical Research and Development (AMED).
CONFLICT OF INTEREST
The authors have no conflicts of interest directly relevant to the content of this article.
Supporting information
Figure S1 Scatter diagram between preoperative and intraoperative evaluations
r p : Pearson's correlation coefficient
β 1: Slope of SMA regression (Y = β 0 + β 1 * X)
DVB, degree of voice breaks; HNR, harmonic‐to‐noise ratio; SNF0, standard deviation of F0
Figure S2 Scatter diagram at the selected width and 13 weeks postoperatively
r p : Pearson's correlation coefficient
β 1: Slope of SMA regression (Y = β 0 + β 1 * X)
DVB, degree of voice breaks; HNR, harmonic‐to‐noise ratio; SNF0, standard deviation of F0
Figure S3 Scatter diagram at the selected width and 52 weeks postoperatively
r p : Pearson's correlation coefficient
β 1: Slope of SMA regression (Y = β 0 + β 1 * X)
DVB, degree of voice breaks; HNR, harmonic‐to‐noise ratio; SNF0, standard deviation of F0
ACKNOWLEDGMENTS
We would like to thank members of the titanium bridge clinical trial group (Eiji Yumoto, MD, PhD; Yutaka Toya, MD, PhD; Narihiro Kodama, PhD; Daisuke Sano, MD, PhD; Yoshihiro Chiba, MD; Yukiko Ikui, PhD; Akihiro Honma, MD, PhD; Hiromitsu Hatakeyama, MD, PhD; Saori Yanagida, PhD; Yo Kishimoto MD, PhD; Takao Goto, MD, PhD; Taku Sato, MD; Tsutomu Nishimura, PhD; and Masanori Fukushima, MD, PhD) for their valuable advice and support throughout the duration of the project.
Sanuki T, Oridate N, Tateya I, Nito T, Mizoguchi K, Tanabe K. Validity of intraoperative voice monitoring undergoing type 2 thyroplasty with titanium bridges for adductor spasmodic dysphonia. Laryngoscope Investigative Otolaryngology. 2022;7(5):1481‐1490. doi: 10.1002/lio2.898
Presented at the American Laryngological Association's 2022 Spring Meeting at COSM, which was held in Dallas, Texas, from April 28 to 30, 2022.
Funding information Japan Agency for Medical Research and Development, Grant/Award Number: the Practical Research Project for Rare/Intractabl
REFERENCES
- 1. Ludlow CL. Spasmodic dysphonia: a laryngeal control disorder specific to speech. J Neurosci. 2011;31(3):793‐797. [DOI] [PMC free article] [PubMed] [Google Scholar]
- 2. Umeno H, Hyodo M, Haji T, et al. A summary of the clinical practice guideline for the diagnosis and management of voice disorders, 2018 in Japan. Auris Nasus Larynx. 2020;47(1):7‐17. [DOI] [PubMed] [Google Scholar]
- 3. Tanner K, Roy N, Merrill RM, Sauder C, Houtz DR, Smith ME. Spasmodic dysphonia: onset, course, socioemotional effects, and treatment response. Ann Otol Rhinol Laryngol. 2011;120(7):465‐473. [DOI] [PubMed] [Google Scholar]
- 4. Hyodo M, Hisa Y, Nishizawa N, et al. The prevalence and clinical features of spasmodic dysphonia: a review of epidemiological surveys conducted in Japan. Auris Nasus Larynx. 2021;48(2):179‐184. [DOI] [PubMed] [Google Scholar]
- 5. Isshiki N, Haji T, Yamamoto Y, Mahieu HF. Thyroplasty for adductor spasmodic dysphonia: further experiences. Laryngoscope. 2001;111(4 Pt 1):615‐621. [DOI] [PubMed] [Google Scholar]
- 6. Sanuki T, Isshiki N. Overall evaluation of effectiveness of type II thyroplasty for adductor spasmodic dysphonia. Laryngoscope. 2007;117(12):2255‐2259. [DOI] [PubMed] [Google Scholar]
- 7. Sanuki T, Yumoto E. Long‐term evaluation of type 2 thyroplasty with titanium bridges for adductor spasmodic dysphonia. Otolaryngol Head Neck Surg. 2017;157(1):80‐84. [DOI] [PubMed] [Google Scholar]
- 8. Isshiki N, Sanuki T. Surgical tips for type II thyroplasty for adductor spasmodic dysphonia: modified technique after reviewing unsatisfactory cases. Acta Otolaryngol. 2010;130(2):275‐280. [DOI] [PubMed] [Google Scholar]
- 9. Sanuki T, Yumoto E, Toya Y, Kumai Y. Voice tuning with new instruments for type II thyroplasty in the treatment of adductor spasmodic dysphonia. Auris Nasus Larynx. 2016;43(5):537‐540. [DOI] [PubMed] [Google Scholar]
- 10. Rosen CA, Lee AS, Osborne J, Zullo T, Murry T. Development and validation of the voice handicap index‐10. Laryngoscope. 2004;114(9):1549‐1556. [DOI] [PubMed] [Google Scholar]
- 11. Sanuki T, Yumoto E, Minoda R, Kodama N. Effects of type II thyroplasty on adductor spasmodic dysphonia. Otolaryngol Head Neck Surg. 2010;142(4):540‐546. [DOI] [PubMed] [Google Scholar]
- 12. Sanuki T, Yumoto E, Kodama N, Minoda R, Kumai Y. Long‐term voice handicap index after type II thyroplasty using titanium bridges for adductor spasmodic dysphonia. Auris Nasus Larynx. 2014;41(3):285‐289. [DOI] [PubMed] [Google Scholar]
- 13. Omori K. Diagnosis of voice disorders. JMAJ. 2011;54(4):248‐253. [Google Scholar]
- 14. Yamaguchi H, Shrivastav R, Andrews ML, Niimi S. A comparison of voice quality ratings made by Japanese and American listeners using the GRBAS scale. Folia Phoniatr Logop. 2003;55:147‐157. [DOI] [PubMed] [Google Scholar]
- 15. Isshiki N. Progress in laryngeal framework surgery. Acta Otolaryngol. 2000;120(2):120‐127. [DOI] [PubMed] [Google Scholar]
- 16. Webb AL, Carding PN, Deary IJ, MacKenzie K, Steen N, Wilson JA. The reliability of three perceptual evaluation scales for dysphonia. Eur Arch Otorhinolaryngol. 2004;261(8):429‐434. [DOI] [PubMed] [Google Scholar]
- 17. De Bodt MS, Wuyts FL, Van de Heyning PH, Croux C. Test‐retest study of the GRBAS scale: influence of experience and professional background on perceptual rating of voice quality. J Voice. 1997;11(1):74‐80. [DOI] [PubMed] [Google Scholar]
- 18. Dos Santos PCM, Vieira MN, Sansao JPH, Gama ACC. Effect of auditory‐perceptual training with natural voice anchors on vocal quality evaluation. J Voice. 2019;33(2):220‐225. [DOI] [PubMed] [Google Scholar]
- 19. Yanagida S, Nishizawa N, Hashimoto R, et al. Reliability and validity of speech evaluation in adductor spasmodic dysphonia. J Voice. 2018;32(5):585‐591. [DOI] [PubMed] [Google Scholar]
Associated Data
This section collects any data citations, data availability statements, or supplementary materials included in this article.
Supplementary Materials
Figure S1 Scatter diagram between preoperative and intraoperative evaluations
r p : Pearson's correlation coefficient
β 1: Slope of SMA regression (Y = β 0 + β 1 * X)
DVB, degree of voice breaks; HNR, harmonic‐to‐noise ratio; SNF0, standard deviation of F0
Figure S2 Scatter diagram at the selected width and 13 weeks postoperatively
r p : Pearson's correlation coefficient
β 1: Slope of SMA regression (Y = β 0 + β 1 * X)
DVB, degree of voice breaks; HNR, harmonic‐to‐noise ratio; SNF0, standard deviation of F0
Figure S3 Scatter diagram at the selected width and 52 weeks postoperatively
r p : Pearson's correlation coefficient
β 1: Slope of SMA regression (Y = β 0 + β 1 * X)
DVB, degree of voice breaks; HNR, harmonic‐to‐noise ratio; SNF0, standard deviation of F0