

Abstract
Objective
Improve the quality and diversity of candidates invited for the Otolaryngology‐Head and Neck Surgery residency match by reducing geographical and inter‐rater bias with a novel geographic distribution algorithm.
Methods
Interview applicants were divided into geographic regions and assigned to reviewers. Each reviewer selected by force‐ranking a pre‐determined number of applicants to invite for interviews based on the percentage of applications received for each region. Our novel geographic distribution algorithm was then applied to maintain the geographic representation and underrepresented minority status of invited applicants to match the applicant pool.
Results
Analysis of previous interview selection methods demonstrated a statistically significant overrepresentation of local applicants invited for interviews. In 2022, 324 domestic applications were received for the otolaryngology match, which were divided into six geographic regions. There was no significant difference in USMLE scores between regions. The implementation of our distribution algorithm during applicant selection eliminated local overrepresentation in the invited pool of applicants and maintained the representation of underrepresented minority applicants. Following the match, reviewers indicated that implementation of the geographic distribution algorithm was simple and improved the quality and diversity of the group of interviewed applicants.
Conclusion
Traditional methods of scoring and inviting otolaryngology residency applicants can be confounded by regional and inter‐rater biases. Employing a geographic distribution algorithm improves the quality and diversity of invited applicants, eliminates bias, and maintains the representation of underrepresented minority applicants.
Keywords: bias, geographic, otolaryngology‐head and neck surgery match, underrepresented in medicine, USMLE, residency, NRMP

1. INTRODUCTION
The Otolaryngology‐Head and Neck Surgery (OHNS) match remains an extremely competitive process and attracts a large pool of highly qualified applicants from all regions in the country. 1 , 2 , 3 The competitiveness of the process necessitates that OHNS applicants apply to more programs than would be possible to attend for an interview, resulting in each program receiving 100 of applications. Program directors are then faced with a dilemma: how to select the best candidates for an interview whereas ensuring the maximum number of invitees will attend. 4 Although applicant characteristics that predict success as a resident have been studied, 5 determining the level of interest of an applicant for a particular program prior to an interview is often not possible. 6 Confounding the process is the oft‐used strategy of delegating the ranking of potential candidates to a group of reviewers, due to a large number of applicants, introducing the potential of inter‐rater bias when evaluating applications.
The geographic location of both the applicant and the OHNS program has been shown to influence applicants' decision‐making. 7 , 8 Most OHNS applicants relocate to a different geographic area to attend residency although 20% of applicants matched to their home programs between 2016 and 2020. 8 Although these studies examined the effects of geography on the applicant, little is known about how geography influences a programs decision to extend an interview. Anecdotally, the authors of this article observed that, historically, a large proportion of our interviewed applicants were from the local region, but whether this was a function of their representation in the applicant pool or a geographical selection bias on the part of our program was unclear.
It is our contention that programs should not try to “guess” whether a candidate is interested in a given program based on location, and that preferentially selecting local applicants for interviews is detrimental to program quality and diversity. In addition, selecting applications based on a perceived “fit” with a particular program might also reduce the likelihood of interviewing underrepresented in medicine (URM) candidates, which has been a recent priority of our specialty. 9 This study sought to determine whether local candidates were being preferentially selected for interviews, and, if so, to implement a strategy to mitigate this bias.
Although exact protocols for selecting interview candidates vary among programs, a common approach uses the Combined Raw Score (CRS), which has been historically applied by our institution and involves multiple reviewers scoring all applications based on a predetermined set of criteria: USMLE scores, letters of recommendation (LOR), research, personal statement, and leadership/volunteer/extracurricular/community service. These scores are pooled, and the highest‐scoring applicants are offered interviews, with declinations or cancelations resulting in the next highest‐scoring candidate being contacted. To test the hypothesis that this approach was introducing inter‐rater and geographical bias in candidate selection, a geographic distribution algorithm (GDA) approach was employed in 2022, with the results compared to the CRS method employed the previous match year. Here we present data demonstrating that the CRS approach introduced significant geographical and inter‐rater bias that was eliminated with the GDA.
2. METHODS
2.1. IRB approval
This study was approved by the University of Arkansas for Medical Sciences (UAMS) IRB (#274478).
2.2. PEC committee
The 14 members of the PEC committee were selected by the program director and department chair from interested faculty and residents. The committee represented a diverse cross‐section of the department, with roughly a 50/50 split between men and women, one URM faculty member, an even representation of assistant, associate, and full professors, and a broad background of previous training geographies.
2.3. CRS methodology for previous years
An initial review of data available from the last 10 years (2011–2021) demonstrated that over 50% of matched applicants had completed medical school training in the south, during which time the CRS method was used. In 2021, a total of 336 domestic applications were received by our program for the OHNS. Applicants were listed alphabetically and equally divided among the 14 reviewers on our Program Evaluation Committee (PEC). Each applicant was evaluated by two reviewers, and applications were scored numerically based on six categories (USMLE scores, LOR, research, personal statement, and leadership/volunteer/extracurricular/community service, and “bonus”; Figure S1), with a potential total score of 50 points. Applicants were then sorted by score, and the top 50 were offered interviews. Students from our home institution and visiting students (n = 13) were evaluated separately and all were offered interviews. Cancelations or declinations triggered an invitation to the next highest‐scoring candidate.
2.4. GDA methodology for current year (2022)
2.4.1. Assignment and scoring of applicants
A total of 324 domestic applications were received for the OHNS match in 2022. Applications were divided into the following six regions: (1) West Coast (CA, OR, WA, AK, HI); (2) West (MT, ID, WY, UT, CO, AZ, NM, NV); (3) Midwest (ND, SD, NE, MN, IA, WI, IL, KS, MI, WI, IN, OH), (4) South (OK, TX, AR, LA, MO, MS, AL, TN, KY); (5) Southeast (FL, GA, SC, NC, VA, WV); and Northeast (6) (NY, NJ, MD, DE, CT, PA, MA, RI, NH, VT, ME, DC). Each of the 14 PEC members reviewed applications from one region only. Regions 1 and 2 were assigned 1 PEC reviewer each (n = 17 applicants for each region); region 5 was assigned 2 PEC reviewers (n = 51 applicants); regions 3 and 6 were assigned 3 PEC reviewers (n = 82 and 60 applicants, respectively); and region 4 was assigned 4 PEC reviewers (n = 97 applicants).
Each reviewer was provided with the same scoring sheet used in previous years (Figure S1) and was instructed to select a specific number of applicants for interviews as well as a ranked list of 5–10 alternates. The pre‐determined number of interviewees to be designated by each PEC member was based on their specific geographic region's representation within the overall applicant pool. Although the reviewers used the CRS scoring sheet as a guide to order applicants, they were not required to use the raw score generated from their scoring sheet to determine their interviewee selections or the order of their alternates. Scores were still collected for each candidate to compare the CRS and GDA methods as well as to order the alternative list. Reviewers were blinded to candidate photos, candidate signaling, and URM statuses. Visiting and home program students were evaluated concurrently with all other applications. Once PEC members submitted their lists, they were notified of any candidates that had “signaled” interest and given the opportunity to adjust their rankings. In 2021, only one applicant who had signaled had their overall rank changed to the first alternate, but ultimately was not interviewed due to no cancelations in the region of the applicant.
2.4.2. Generation of invitation/alternate list
All PEC members provided their lists of interviewees and alternates to the corresponding author, who then compiled a master invitation/alternate list. In regions where more than one PEC member created an alternate list (regions 3–6), these lists were combined and ordered according to rank position followed by total raw score. URM status was noted for each applicant, and the percent of URM invitations was compared to the total percent of URM candidates in the applicant pool. For the purposes of this study, URM was defined as anyone identifying as African American, Hispanic/Latino, Native American, or Pacific Islander.
2.4.3. Algorithm for interview scheduling/cancelations
Applicants selected by PEC members for interviews were notified according to the schedule provided by the National Resident Matching Program (NRMP). A regional cancelation or declination resulted in the highest‐selected alternate within the regional alternate list being invited, unless the cancelation came from a URM applicant. In the case of a URM cancelation, the highest URM alternate from that region would be selected for invitation. In the case where no additional URM candidates remained on the regional alternate list, the highest‐scoring overall URM candidate would be selected. If no URM candidates remained in the alternate pool, the next highest alternate in the regional list would be selected. In the case where no alternate candidates remained on a given regional list, the highest‐scoring overall alternate candidate would be invited. For match year 2022, a total of 13 invited candidates either declined or canceled, and ten were replaced with alternates.
2.5. Statistical analysis
All data representing USMLE scores or total points awarded on the applicant scoring sheet are presented as means with standard deviations (error bars). Analysis comparing overall percentages of applicants and invitees from specific regions are reported in percentages, and statistical significance was determined using a z test of proportions with F scores and 95% confidence intervals reported. Statistical significance of the difference in USMLE scores or points awarded on the applicant scoring sheet across multiple groups was determined with single factor ANOVA tests and Tukey's HSD test. Statistical analysis was performed on Microsoft Excel Data Analysis ToolPak and Real Statistics Resource Pack. P values of <.05 were considered statistically significant.
3. RESULTS
In 2021 we received 336 domestic applications: 27 (8.0%) applications from the West Coast, 14 (4.2%) from the West, 72 (21.4%) from the Midwest, 99 (29.5%) from the South, 53 (15.8%) from the Southeast, and 71 (21.1%) from the Northeast (Figure 1A,B, see methods section for definitions of regions). There was no statistically significant difference in USMLE Step I scores among regions (F(5308) = [1.02], p = .41; Figure 1C). Invitations to interview were extended to 63 applicants: 4 (6.4%) from the West Coast, 1 (1.6%) from the West, 10 (15.9%) from the Midwest, 33 (52.4%) from the South, 9 (14.3%) from the Southeast, and 6 (2.8%) from the Northeast (Figure 1D). URM applicants represented 12.2% (n = 41) of the applicant pool and 6.3% (n = 4) of the invitation pool. A z test of proportions demonstrated that applicants from the southern region were significantly overrepresented in the invitation pool (z = −3.55, 95% CI (−0.362 to −0.097), p < .001) whereas applicants in the northeastern region were significantly underrepresented (z = 2.14, 95% CI (0.031–0.201), p = .03; Figure 1E). Although the proportion of URM applications in the overall pool (12.2%) was nearly twice that of the invitation pool (6.8%), this difference did not achieve statistical significance (z = 1.348, 95% CI (−0.011 to 0.128), p = .18). In 2021, all three matched candidates were from the local region (South).
FIGURE 1.

2021 OHNS application and invitation demographics. (A) Applicants were divided into the indicated six regions (1: West Coast, 2: West, 3: Midwest, 4: South, 5: Southeast, 6: Northeast). The number of total 2021 applications (B), average USMLE Step I scores (C), and number of total invitations (D) are displayed by region. (E) The percentage of total 2021 applications per region in the overall application pool (hatched bars) was compared to the percentage of invitations per region in the overall invitation pool (solid bars). A z test of proportions was used to determine statistical significance
The 324 domestic applicants for the 2022 match were categorized by geographic region and URM status (Figure 2A,B). Regional USMLE scores (Figure 2C) were similar to previous years and again not significantly different among regions (F(5,317) = [1.77], p = .19). There was a statistically significant difference in USMLE scores between at least two groups when URM, non‐URM, institutional, and visiting student populations were compared (F(3,317) = [1.77], p = .04) (Figure 2D). Tukey's HSD test for multiple comparisons demonstrated a significant difference between URM (mean = 235.7, n = 37) and non‐URM USMLE scores (mean 246.8, n = 288; (95% CI 1.28–20.91), p = 0.02). PEC reviewers selected 51 initial applicants to interview. A total of 13 applicants either declined or canceled and were replaced by following our established algorithm (Figure 3).
FIGURE 2.
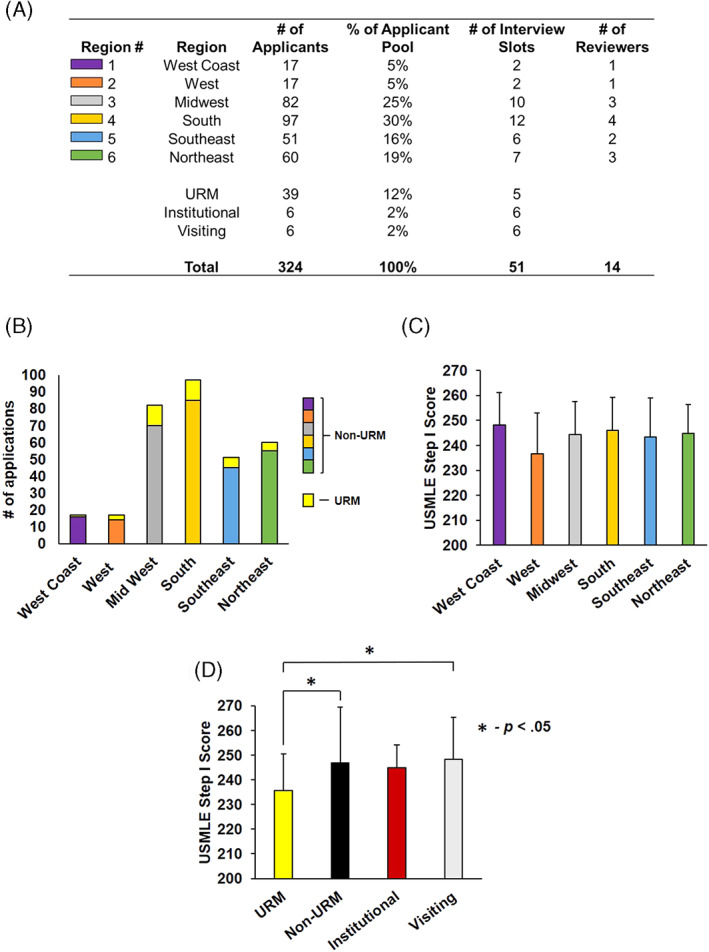
2022 OHNS application and invitation demographics. (A–C) The total number of applicants per region, their percentage of the applicant pool, the determined number of interview spots for each region, the number of PEC reviewers assigned to each region, and average USMLE Step I scores per region are displayed. (D) Subgroup analysis of USMLE scores within URM, non‐URM, institutional, and visiting students were compared with AVOVA (F(3,317) = [1.77], p = .04). Tukey's HSD test demonstrated a significant difference between URM and non‐URM groups (95% CI 1.28–20.91), p = .02)
FIGURE 3.

Algorithm for inviting alternate candidates due to declinations/cancelations. URM, underrepresented in medicine candidate
The analysis of the average raw scoring of each PEC member by application category is shown in Table 1, indicating that inter‐rater bias did skew the ranking of applicants. Although there was no significant difference in points awarded for USMLE scores, there were statistically significant differences within every other subjective category. To illustrate this effect, PEC members were ordered from highest to smallest average overall points awarded, and ANOVA analysis was performed to determine statistically significant differences between reviewers (F(13,312) = [9.13], p > .001; Figure 4A). The effect of this inter‐rater bias on interviewee selection is that, when a CRS method is employed, certain PEC reviewers have a significant overrepresentation of invited candidates whereas other reviewers' applicants are completely omitted (Figure 4B). The left portion of this figure (GDA Method) demonstrates how many of each reviewer's applicants were interviewed for the 2022 match whereas the right portion (“CRS” method) demonstrates how the traditional scoring method would have awarded the majority of interviews to 2 PEC reviewers' applications, with four reviewers having 0 applicants invited.
TABLE 1.
2022 Scoring patterns of applicants per PEC reviewer
| Reviewer | #Reviewed | #Invited | #Primary interview (%) | #Waitlist interview | USMLE (0–10) | LOR (0–10) | Research (0–10) | PS (0–5) | L/V/EC/CS (0–10) | Bonus (0–5) | Total Score (0–50) |
|---|---|---|---|---|---|---|---|---|---|---|---|
| R1 | 18 | 3 | 3 (100%) | 0 | 6.9 | 7.3 | 6.5 | 3.2 | 6.3 | 3.0 | 31.4 |
| R2 | 17 | 2 | 2 (100%) | 0 | 4.6 | 7.3 | 5.8 | 3.6 | 5.9 | 1.4 | 28.6 |
| R3 | 28 | 3 | 2 (66%) | 1 | 5.8 | 9.1 | 7.3 | 4.5 | 8.7 | 3.5 | 38.8 |
| R4 | 28 | 5 | 4 (80%) | 1 | 6.1 | 8.4 | 6.5 | 4.9 | 6.5 | 0.0 | 32.3 |
| R5 | 26 | 3 | 3 (100%) | 1 | 6.5 | 6.6 | 6.1 | 2.9 | 6.2 | 1.2 | 28.5 |
| R6 | 24 | 5 | 2 (40%) | 1 | 6.4 | 7.6 | 7.2 | 4.2 | 7.2 | 2.7 | 34.0 |
| R7 | 22 | 6 | 4 (66%) | 1 | 6.6 | 6.8 | 6.7 | 4.6 | 7.1 | 5.0 | 31.9 |
| R8 | 23 | 6 | 4 (66%) | 1 | 5.6 | 7.6 | 6.7 | 4.0 | 4.1 | 1.7 | 28.4 |
| R9 | 26 | 5 | 4 (80%) | 1 | 7.0 | 7.8 | 9.3 | 4.2 | 8.8 | 2.7 | 39.7 |
| R10 | 25 | 3 | 2 (66%) | 1 | 6.5 | 7.6 | 7.1 | 3.0 | 4.9 | 0.7 | 29.8 |
| R11 | 25 | 3 | 2 (66%) | 1 | 5.9 | 6.7 | 5.5 | 3.6 | 6.4 | 2.0 | 28.2 |
| R12 | 21 | 2 | 1 (50%) | 0 | 5.4 | 7.1 | 7.2 | 3.5 | 6.3 | 0.7 | 30.2 |
| R13 | 21 | 2 | 2 (100%) | 0 | 7.1 | 7.6 | 7.6 | 3.9 | 6.6 | 2.0 | 32.8 |
| R14 | 20 | 3 | 3 (100%) | 1 | 5.5 | 8.2 | 7.6 | 4.3 | 7.9 | 0.0 | 33.5 |
| Total | 324 | 51 | 38 | 10 | |||||||
| Average (SD) | 6.1 (0.70) | 7.6 (0.68) | 6.9 (0.94) | 3.9 (0.61) | 6.6 (1.28) | 1.9 (1.40) | 32.0 (3.64) | ||||
| ANOVA P value | .08 | <.001 | <.001 | <.001 | <.001 | <.001 | <.001 | ||||
Abbreviations: Bonus, miscellaneous points; L/V/EC/CS, leadership; volunteer work; extracurricular activities; and community service; LOR, letters of recommendation; PS, personal statement; Research, research experience; USMLE, USMLE Step I score.
FIGURE 4.

Comparison of CRS to GDA invitation method for 2022 OHNS interview invitations. (A) PEC application reviewers (“R#”) are listed on the X axis and ordered by their average total points awarded when reviewing candidates using the CRS method. Single‐factor ANOVA analysis was used to compare the means among all groups (F(13,312) = [9.13], p < .001). (B) The number of invitations awarded per reviewer using the GDA versus CRS methods. (C) The percentage of total 2022 applications per region in the overall application pool (hatched bars), the percentage of invitations using the GDA per region in the overall invitation pool (solid colored bars), and the percentage of invitations that would have been awarded per region using the CRS method (black bars) were compared. A z test of proportions was performed to determine statistical significance
When we compared the percentage of regional applications/total applications to the percentage of regional invitations/total invitations using the GDA method, we found no significant difference in proportions (Figure 4C). Had the CRS methodology been applied, a significant overrepresentation of applicants from the South would have again been interviewed (z = −3.05, 95% CI (−0.37 to −0.07), p = .002) whereas the Southeast would have been significantly underrepresented (z = 2.55, 95% CI (0.08–0.19), p = .01). These analyses demonstrate that application of the GDA method eliminated both inter‐rater and geographical biases when inviting applicants for interviews.
To assess whether PEC members believed that the GDA was an improvement over the CRS method, a 10‐question survey was designed and completed by all 14 PEC members (Figure S2). Results of this survey showed that 92% of respondents believed the GDA was both simpler and easier to implement than the CRS. Prior to introducing the GDA, 79% of PEC members believed that local candidates were more likely to accept interview offers than those from distant regions whereas only 40% had this concern after using the GDA. Eighty percent of PEC members believed that the strength of the interviewed candidates improved and 93% believed that the overall diversity of the interviewed candidates improved after using the GDA. When asked whether using the GDA would lead to matching applicants that would not “fit in” or ranking applicants uninterested in our program, 75% disagreed and 69% strongly disagreed.
In 2022, our program matched three applicants from three different regions (South, Southeast, and Northeast). Although a significant number of URM candidates were interviewed and scored favorably (one URM candidate in the top 2 ranks), we did not match a URM applicant in 2022.
4. DISCUSSION
Selecting a small number of applicants to invite for OHNS residency interviews is a challenging process due to the ever‐increasing pool of highly qualified applicants. In this study, we demonstrated that the process of inviting applicants based on a CRS of points awarded for specific categories was confounded by both inter‐rater and geographical bias. We found that by liberating our selection requirements from a raw score and enabling application reviewers to directly select their top applicants for interviews, these biases were eliminated. Had the traditional CRS method been used to select candidates for interviews, applicants appearing at the bottom of the lists from small number of reviewers would have been invited, whereas several reviewers' top choices would have been passed over. Using the GDA method resulted in a more highly qualified and more diverse group of applicants being interviewed, with an appropriate representation of URM candidates.
The presence of inter‐rater bias was not surprising given that the majority of application rating categories are highly subjective. We believe that in previous years, having candidates reviewed by more than one reviewer exacerbated the effect of some reviewers being more generous with subjective points. Having one reviewer “force‐rank” candidates removed this effect and evenly distributed invitations among all reviewers. In addition, it is difficult to devise a point‐awarding system that truly selects the most desirable candidates. For example, an applicant with multiple poster presentations at a local meeting might be awarded more research points than a candidate with a PhD and one first‐author paper in a very high‐impact journal. A Navy SEAL applicant may have only one “leadership experience” but be awarded fewer points than a candidate listing several OHNS clubs and organization memberships. With the elimination of USMLE Step, I scores in 2022 this potential for skewing awarded points will be exacerbated as there will be less objective data by which to rate candidates, which will magnify any inter‐rater bias when evaluating subjective categories. The authors contend that an experienced reviewer can select the top 2–3 applicants out of a pool of 20 without being restricted by a point system, and we have demonstrated that allowing each reviewer to select a specific number of top applications for interviews eliminates inter‐rater bias. Candidate signaling had a negligible effect on where reviewers ranked candidates; only one candidate who signaled had their final rank changed, but this candidate was still not extended an interview.
Our results also demonstrated that URM candidates had significantly lower USMLE Step I scores but were still highly rated using the GDA method, suggesting that using USMLE Step I scores as an invitation criterion may reduce the number of qualified URM candidates receiving interviews. In our study, reviewers were blinded to the URM statuses and photographs of applicants but still selected a representative fraction of URM applicants for interviews, indicating that despite lower USMLE scores these applicants were equally competitive. Because no URM applicants declined or canceled interviews it was not necessary to utilize the URM arm of the GDA (Figure 3) to invite URM alternates.
We also confirmed the hypothesis that there was a geographical bias in our previous invitation process, demonstrated by an overrepresentation of local candidates in the invitation pool. This bias existed even when candidates from our institution were removed from the analysis. Our survey results suggest that a possible explanation for the local skewing of invitations was the belief that candidates from distant regions were not genuinely interested in our program but were just playing the “numbers game.” Following implementation of the GDA, our survey results indicated that the majority of reviewers who believed that interviewing distant applicants was wasting interview slots reversed their opinion (Figure S2). Our overall goal was not to simply increase the geographic representation of the country in our residency program, but rather to prevent the limiting of our pool of potential interview candidates to one region. In doing so, the overall quality of the invited applicants increases by eliminating the practice of passing over top‐quality distant applicants for less‐qualified local applicants. We believe that the practice of disregarding highly qualified applicants based on their geographic location is counterproductive and results in interviewing a less qualified and less diverse applicant pool. Any questions as to whether a candidate would consider relocating or whether a candidate would be a good “fit” for a program should be left entirely to the applicant.
A major caveat in this study is that both the 2021 and 2022 OHNS interview processes were performed virtually due to the COVID‐19 pandemic. It is possible that when applicants are required to travel in person to interviews, we may see a reduction in the rate of accepted interview offers from candidates in distant regions. Even if this is the case, our algorithm should ensure that any cancelations or declinations are replaced with highly qualified and diverse alternates.
5. CONCLUSION
The traditional system of numerically scoring applications to determine interview invitation offers is confounded by geographical and inter‐rater bias. Our GDA eliminates these biases and improves interviewee quality and diversity. OHNS programs should not consider an applicant's geographic location when awarding interviews.
FUNDING INFORMATION
All authors confirm that they have no financial disclosures.
CONFLICT OF INTEREST
All authors confirm that they have no conflict of interest in the submission of this manuscript.
Supporting information
Figure S1 Scoring sheet used to rate candidates using the Combined Raw Score (CRS) method.
Figure S2 Graphical representation of survey results of PEC members following administration of the GDA method.
ACKNOWLEDGMENTS
All authors confirm that they have no conflict of interest in the submission of this manuscript. All authors confirm that they have no financial disclosures and have received no compensation for this study. GS and CL had full access to the data in the study and take full responsibility for the integrity of the data and accuracy of the data analysis. The authors would like to acknowledge the following faculty for serving as PEC application reviewers: Mary Brown, MD, Erin Creighton, MD, Larry Hartzell, MD, Tyler Merrill, MD, Jumin Sunde, MD, Ozlem Tulunay, MD, Donald Vickers, MD, and Andre Wineland, MD.
Lau CO, Johnson AB, Nolder AR, King D, Strub GM. A novel algorithm to reduce bias and improve the quality and diversity of residency interviewees. Laryngoscope Investigative Otolaryngology. 2022;7(5):1367‐1375. doi: 10.1002/lio2.908
REFERENCES
- 1. Chang CW, Erhardt BF. Rising residency applications: how high will it go? Otolaryngol Head Neck Surg. 2015;153(5):702‐705. [DOI] [PubMed] [Google Scholar]
- 2. Salehi PP, Heiser A, Salehi P, et al. Ideas and innovations to improve the otolaryngology‐head and neck surgery residency application and selection process. Otolaryngol Head Neck Surg. 2021;164(5):1001‐1010. [DOI] [PubMed] [Google Scholar]
- 3. Caretta‐Weyer HA. An outcomes‐oriented approach to residency selection: implementing novel processes to align residency programs and applicants. Acad Med. 2022;97(5):626‐630. [DOI] [PubMed] [Google Scholar]
- 4. Gebhard GM, Hauser LJ, Dally MJ, Weitzenkamp DA, Cabrera‐Muffly C. Do otolaryngology residency applicants relocate for training? Laryngoscope. 2016;126(4):829‐833. [DOI] [PMC free article] [PubMed] [Google Scholar]
- 5. Bowe SN, Laury AM, Gray ST. Associations between otolaryngology applicant characteristics and future performance in residency or practice: a systematic review. Otolaryngol Head Neck Surg. 2017;156(6):1011‐1017. [DOI] [PubMed] [Google Scholar]
- 6. Villwock JA, Hamill CS, Sale KA, Sykes KJ. Beyond the USMLE: the STAR algorithm for initial residency applicant screening and interview selection. J Surg Res. 2019;235:447‐452. [DOI] [PubMed] [Google Scholar]
- 7. Hauser LJ, Gebhard GM, Blumhagen R, Carlson NE, Cabrera‐Muffly C. Applicant characteristics associated with successful matching into otolaryngology. Laryngoscope. 2017;127(5):1052‐1057. [DOI] [PMC free article] [PubMed] [Google Scholar]
- 8. Bernstein JD, Shahrestani S, Shahrvini B, Watson D. Geographic trends in the otolaryngology match (2016‐2020). OTO Open. 2021;5(2):2473974X211022611. [DOI] [PMC free article] [PubMed] [Google Scholar]
- 9. Dorismond C, Farzal Z, Shah RN, Ebert CS, Buckmire RA. Effect of application screening methods on racial and ethnic diversity in otolaryngology. Otolaryngol Head Neck Surg. 2022;166:1166‐1168. [DOI] [PubMed] [Google Scholar]
Associated Data
This section collects any data citations, data availability statements, or supplementary materials included in this article.
Supplementary Materials
Figure S1 Scoring sheet used to rate candidates using the Combined Raw Score (CRS) method.
Figure S2 Graphical representation of survey results of PEC members following administration of the GDA method.