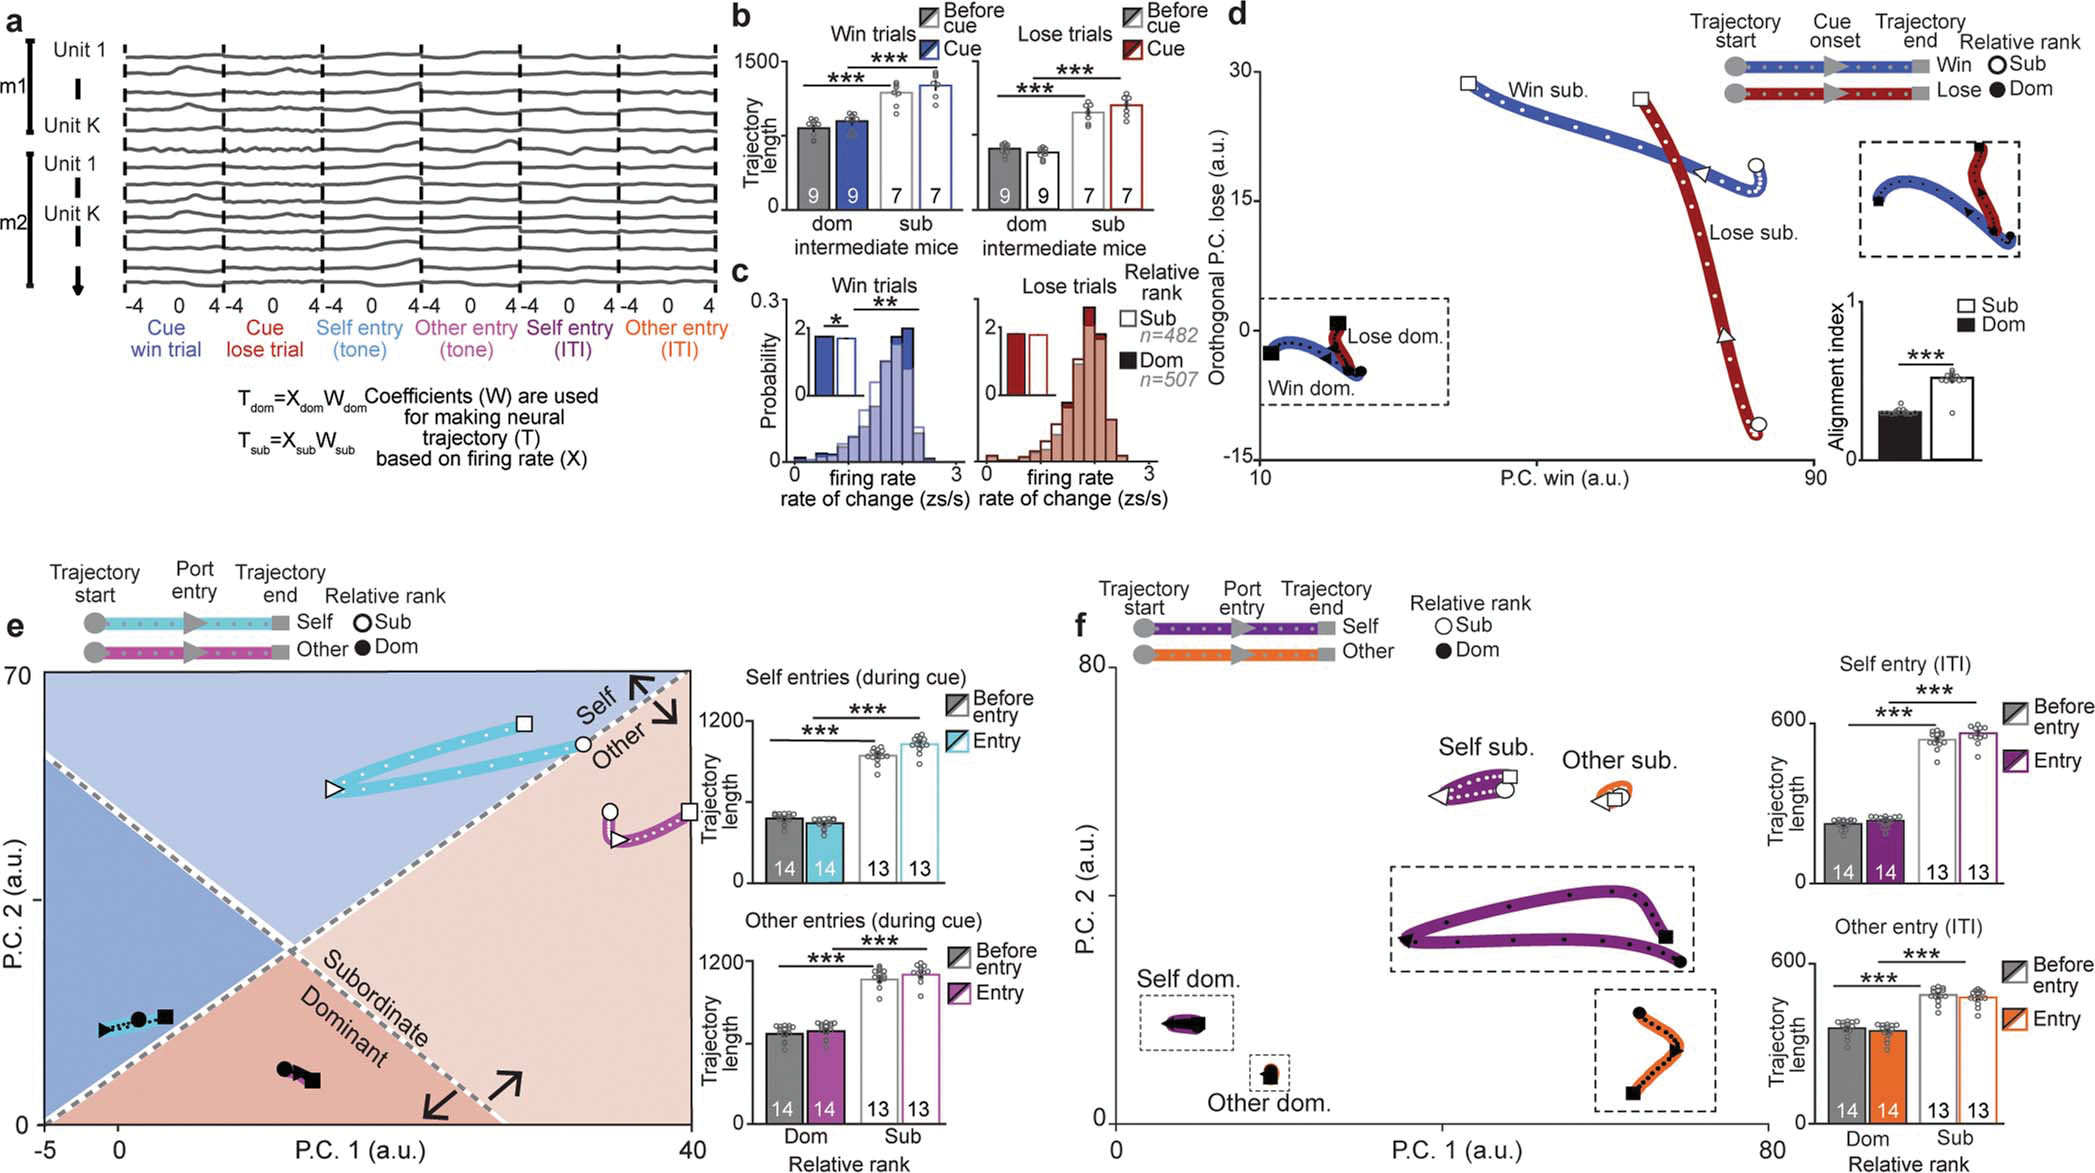
Extended Data Figure 6: Additional data for mPFC population dynamics during social competition.

a, Data arrangement across all animals (m1=mouse 1, m2=mouse 2) for the dimensionality reduction to a common subspace for the six task-relevant events. Neural trajectories were created for dominant and subordinate data using mean firing rate per event and the principal component analysis coefficients. b, Neural trajectory lengths (using principal components that captured 90% of variance) for win and lose trials are highest for relative subordinates in intermediate (ranks 2 or 3) mice (n indicated on plots; win 2-way RM-ANOVA main effects of relative rank F(1,14)=165, p=2×10⁻⁶; lose 2-way RM-ANOVA effect of relative rank F(1,14)=262, p=6×10⁻⁷). c, Firing rate rate of change is higher for relative dominants only in win trials (number of neurons indicated in plots, inset plot has average across groups; win trials rate of change: Kolmogorov-Smirnov (KS) test p=0.009, Wilcoxon rank sum p=0.01; lose trials rate of change: KS test p=0.40, Wilcoxon rank sum p=0.19). d, Neural trajectories for win and lose trials plotted in the first Principal Component (PC) for win and the orthogonal lose subspace show little overlap. Top right, inset of dominant neural trajectories. Bottom right, alignment of win and lose trajectories was significantly lower for dominant mice (n=13 per group; Wilcoxon rank-sum, p=1.5×10⁻⁵). e, Left, neural trajectories of mPFC population firing rate differ by relative rank for port entries that occur during the tone period in a lower dimensional common principal component (PC) sub-space (trajectories are the average across leave one out iterations leaving out one mouse at a time, total neurons recorded from dominants: n=507 and subordinates: n=490 units from 20 mice). Self entry events are aligned to port entries of the subject mouse while other entry events are aligned to the competitor’s port entries. Right, trajectory lengths (using PCs that captured 90% of variance) for self entry (top) and other entry (bottom) during the tone are higher for relative subordinates (self entry 2-way RM-ANOVA effect of relative rank F(1,25)=452, p=5×10⁻¹⁴ and interaction of relative rank and event F(1,25)=5950, p=1×10⁻¹⁷; other entry 2-way ANOVA effect of relative rank F(1,25)=728, p=3×10⁻¹⁵ and interaction of relative rank and event F(1,25)=90, p=5×10⁻⁷). f, Left, Neural trajectories of mPFC population firing rate for port entries that occur during inter-trial interval (ITI) projected into the first two principal components of the common behavioral subspace. Insets show closer look to the dominant trajectories. Right, neural trajectory lengths for self entry (top) and other entry (bottom) during the ITI (n=14 relative dom mice, n=13 relative sub mice; self entry: 2-way RM-ANOVA main effect of rank F(1,25)=77.7, p=1×10⁻⁹; other entry: 2-way RM-ANOVA main effect of rank F(1,25)=110, p=2×10⁻¹⁰. Self entry events are aligned to port entries of the subject mouse while other entry events are aligned to the competitor’s port entries. ITI port entries refer to port entries that occurred outside of the tone period.
