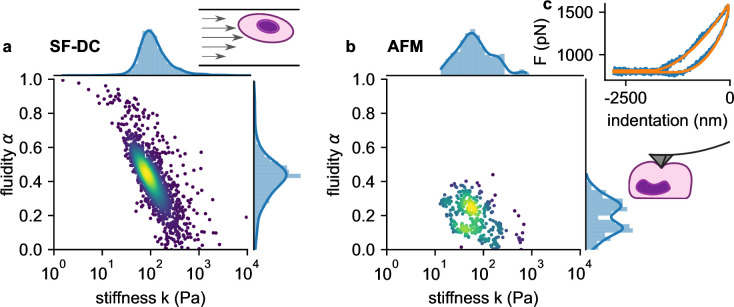
Figure 5. Comparison of viscoelastic cell properties measured with shear flow deformability cytometry (SF-DC) and AFM.
a. Stiffness versus fluidity α of THP1 cells (n=5000) measured with SF-DC at a pressure of 2 bar, 2% alginate solution. Colors represent Gaussian kernel density. Histograms show the probability density distributions of (top) and α (side) with Gaussian kernel density estimates (blue line). b, AFM measurements of THP1 cells. Each point represents and α from one cell, each obtained from the fit of Equation 24 to 3 or more force-indentation curves for each cell. c, Typical force-indentation curve (blue line) and fit with Equation 24 (orange line).

