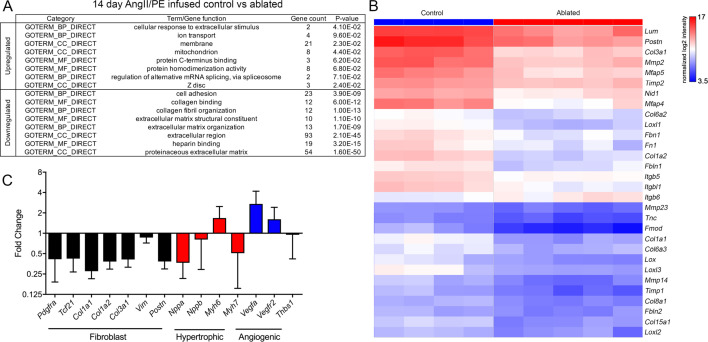
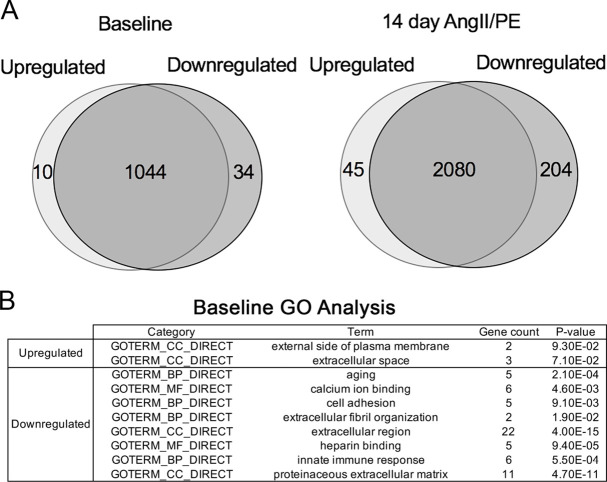
Figure 5. Differential gene expression after angiotensin II/phenylephrine (AngII/PE) infusion.
(A) Gene ontology (GO) analysis of differentially expressed genes between control and ablated hearts infused with AngII/PE for 14 days. All genes included had fold change values of log2 ≥2 or ≤–2 and p≤0.05. (B) Hierarchical clustering of extracellular matrix (ECM)-related genes differentially expressed in 14-day AngII/PE infused control and ablated. Control: n=4; ablated: n=5. (C) The qPCR analysis in whole ventricle tissue infused with 14 days of AngII/PE from ablated hearts compared to controls. The 18s was used as a housekeeping gene. Control: n=4; ablated: n=5. Results are mean ± SD.


