Abstract
Background and Objective
We investigated the associations between the APOE genotype, intracerebral hemorrhage (ICH), and neuroimaging markers of cerebral amyloid angiopathy (CAA).
Methods
We included patients from a prospective, multicenter UK observational cohort study of patients with ICH and representative UK population controls. First, we assessed the association of the APOE genotype with ICH (compared with controls without ICH). Second, among patients with ICH, we assessed the association of APOE status with the hematoma location (lobar or deep) and brain CT markers of CAA (finger-like projections [FLP] and subarachnoid extension [SAE]).
Results
We included 907 patients with ICH and 2,636 controls. The mean age was 73.2 (12.4 SD) years for ICH cases vs 69.6 (0.2 SD) for population controls; 50.3% of cases and 42.1% of controls were female. Compared with controls, any APOE ε2 allele was associated with all ICH (lobar and nonlobar) and lobar ICH on its own in the dominant model (OR 1.38, 95% CI 1.13–1.7, p = 0.002 and OR 1.50, 95% CI 1.1–2.04, p = 0.01, respectively) but not deep ICH in an age-adjusted analyses (OR 1.26, 95% CI 0.97–1.63, p = 0.08). In the cases-only analysis, the APOE ε4 allele was associated with lobar compared with deep ICH in an age-adjusted analyses (OR 1.56, 95% CI 1.1–2.2, p = 0.01). When assessing CAA markers, APOE alleles were independently associated with FLP (ε4: OR 1.74, 95% CI 1.04–2.93, p = 0.04 and ε2/ε4: 2.56, 95% CI 0.99–6.61, p = 0.05). We did not find an association between APOE alleles and SAE.
Discussion
We confirmed associations between APOE alleles and ICH including lobar ICH. Our analysis shows selective associations between APOE ε2 and ε4 alleles with FLP, a CT marker of CAA. Our findings suggest that different APOE alleles might have diverging influences on individual neuroimaging biomarkers of CAA-associated ICH.
Nontraumatic intracerebral hemorrhage (ICH) accounts for 10%–15% of all strokes in Western countries such as the United Kingdom and United States (but a high proportion in Asian countries), with a mortality of 40% at 1 month and 55% at 1 year.1–4 Survivors frequently remain severely disabled.5,6 Moreover, the incidence of ICH in the elderly population seems to be increasing, possibly because of the increased use of oral anticoagulation.7,8 In over 80% of cases, nontraumatic ICH results from bleeding into the brain parenchyma from a small arteriole affected by cerebral small vessel diseases (SVDs). The commonest sporadic SVDs causing ICH are deep perforator arteriopathy (also termed hypertensive arteriopathy or arteriolosclerosis) and cerebral amyloid angiopathy (CAA). Deep perforator arteriopathy is associated with hypertension and is a frequent cause of deep ICH in the basal ganglia or brainstem; CAA is caused by β-amyloid deposition in cortical and leptomeningeal blood vessels and contributes to lobar ICH.8 CT scans can detect brain imaging biomarkers of SVD including white matter changes, lacunes, and atrophy (associated with both hypertensive arteriopathy and CAA) and, in the acute phase, ICH morphological features including finger-like projections (FLP) and subarachnoid extension (SAE), which are associated with CAA.9,10
APOE has emerged as a strong genetic risk factor for ICH and its clinical consequences, possibly mediated by its role in membrane maintenance, neuronal repair, regulation, vascular integrity, and synaptic remodeling.11–13 The APOE genotype is the combination of 2 variants (rs7412 and rs429358), which form combinations of the ε2, ε3, and ε4 alleles. The most consistent and robust association is between APOE ε4 and CAA, with or without ICH, although APOE ε2 has been linked to ICH severity, perhaps because of increased vascular fragility.14,15 Studies in non-ICH populations suggest that APOE alleles can influence neuroimaging biomarkers of cerebral SVD.16–21
Despite these established associations between APOE alleles and ICH, we are not aware of any systematic studies in ICH linking them with neuroimaging markers of the underlying SVD type and severity.16–21 We therefore systematically investigated the associations of APOE with the following: ICH presence and location, and neuroimaging (CT) biomarkers of the underlying arteriopathy type and severity. We hypothesized that APOE ε2 and ε4 alleles are associated with neuroimaging biomarkers of CAA seen on acute CT scans.
Methods
Study Design and Population
We included patients with ICH from the prospective multicenter Clinical Relevance of Microbleeds in Stroke (CROMIS-2) study (NCT02513316)22 ICH cohort. The full study protocol and baseline clinical data collection in CROMIS-2 are published elsewhere.22 For this analysis, we included patients who had imaging-confirmed ICH, a blood sample available for genetic analysis, and baseline neuroimaging (acute CT) available for central neuroimaging analysis. The population controls were recruited from the Medical Research Council National Survey of Health and Development (MRC NSHD, 1946 British birth cohort).9 The NSHD is based on a social class stratified sample (n = 5,362) of all singleton births in 1 week in March 1946 in England, Scotland, and Wales, broadly representative of the general population, and followed up to 24 times since birth. The study is uniquely placed to investigate life course factors associated with aging.23
We collected detailed baseline characteristics and clinical presentation of patients with ICH using a standardized report questionnaire and definition of variables. NSHD data were collected by trained research nurses using standardized questionnaires.10 We included the following variables from both populations: age, sex, hypertension, diabetes mellitus, oral anticoagulation (defined as regular intake of any anticoagulation), antiplatelet medication (defined as regular intake of any antiplatelet medication), statins medication, antihypertensive medication, and smoker status.
Genotyping
The APOE genotype was determined using peripheral blood samples as follows. For CROMIS-2 patients, genomic DNA extraction was performed by the laboratory staff of the neurogenetics laboratory at the National Hospital of Neurology and Neurosurgery. APOE genotyping was performed as previously described.24 The person genotyping the samples (I.C.H.) was blinded to the clinical and neuroimaging data at the time of genotyping. See eTable 1, links.lww.com/WNL/C187, in the Supplement for primer sequence and reaction mix. The call rate was 94.9%. All samples were processed simultaneously to avoid batch effect. For the NSHD cohort, genotyping of the 2 single nucleotide variations (formerly SNPs), rs7412 and rs429358, used to determine the APOE genotype was performed at the LGC Genomics Limited (Hertfordshire, UK) using KASP assay technology.25,26
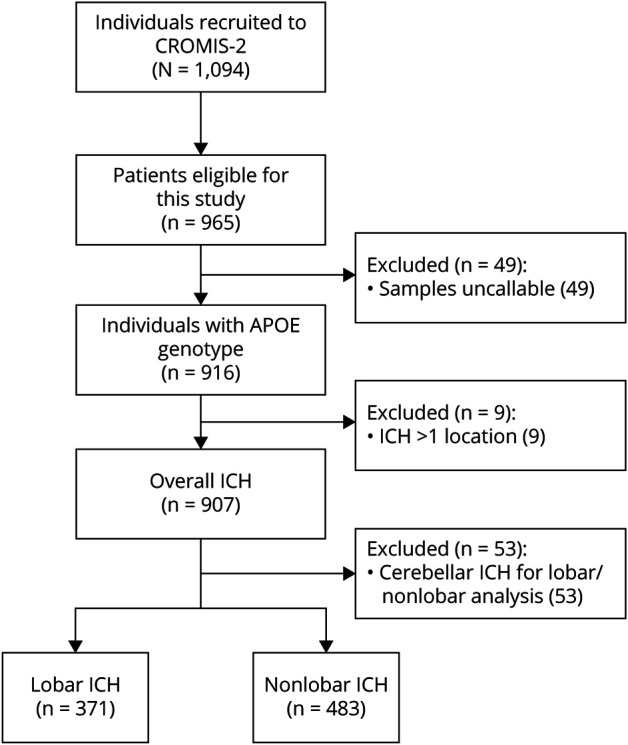
We classified the different APOE genotype alleles as prespecified into present or absent (dominant model), allele count (additive model) to evaluate a linear change and looked at ε2/ε4 heterozygosity as a post hoc analysis.15,27 See Figure 1 for the flowchart of patient inclusion for this study. We genotyped 965 individuals of the CROMIS-2 study and included 2,636 population controls with an available APOE genotype. We included the 53 patients with cerebellar ICH location in the overall analysis but excluded them from the analysis of the lobar and deep categories.
Figure 1. Study Flowchart.
Neuroimaging Analysis
All routine neuroimaging (CT) of patients in CROMIS-2 was coded, collected, and centrally stored at the Stroke Research Centre UCL Queen Square Institute of Neurology. Neuroimaging analysis was performed by clinical research fellows (D.W., I.C.H., G.B., and D.S.), all of whom were trained in neuroimaging rating and blinded to patient details. To evaluate raters' accuracy, all raters independently rated a random sample of 50 CT scans. Hematoma location was defined as lobar or deep (with locations in the thalamus, basal ganglia, internal capsule, or brainstem but excluding cerebellar location) using a validated anatomic rating instrument (CHARTS).28 We excluded patients with multiple simultaneous ICH or cerebellar ICH (n = 53) from the ICH location subanalyses.29
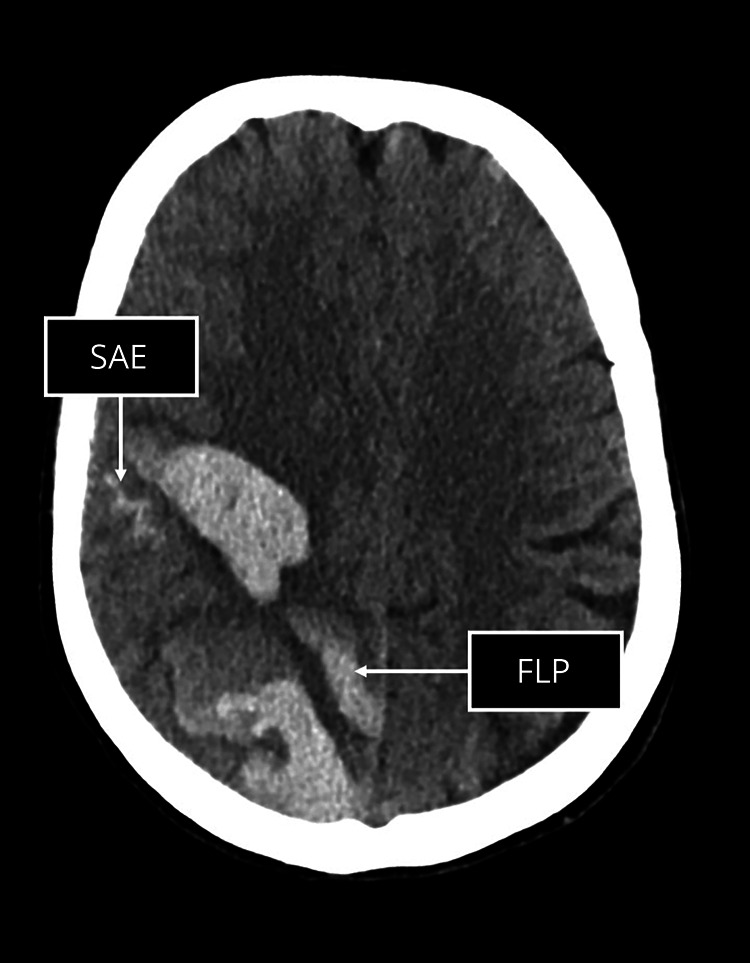
On acute noncontrast CT scans, we evaluated the presence vs absence of SAE (i.e., acute blood in the extra-axial space) and FLP (elongated extensions, which arise from the hematoma, are longer than wide, and can extend to the cortex but do not have to), as markers of CAA, using published criteria and using standardized training available online30 (see Figure 2 for an example of SAE and FLP, respectively).31,32
Figure 2. Example of Subarachnoid Extension (SAE; A) and Finger-Like Projections (FLP; B).
Statistical Analysis
We followed a predefined analysis plan completed in January 2018. We first analyzed the association of APOE between individuals with ICH (cases) with individuals free of ICH (controls) using univariable and multivariable (adjusting only for age as a continuous variable) logistic regression models. In the second stage, we analyzed APOE and its association with neuroimaging features in patients with ICH. We used univariable and again age-adjusted multivariable regression models to assess the association between APOE and hematoma location (deep vs lobar) and neuroimaging markers of CAA, i.e., SAE and FLP.
We present categorical variables using frequency and percentages and continuous variables using mean ± SD. We investigated continuous variables for normal distribution. We compared categorical variables using the χ2 or Fisher exact test and continuous variables using the t test or Mann-Whitney rank-sum as appropriate. The level of significance was set at 5% (p = 0.05). We performed all statistical analysis (ICH) in STATA 15 (StataCorp. 2017. Stata Statistical Software: Release 15. College Station, TX: StataCorp LLC).
Standard Protocol Approvals, Registrations, and Patient Consents
The CROMIS-2 study was approved by the National Research Ethics Service (reference: 10/H0716/64, clinical trial registration on clinicaltrials.gov, NCT02513316). The MRC NSHD study was approved by the Central anchester Research Ethics Committee (reference: 07/H1008/168). Written informed consent was obtained from all patients or from the relative or representative where there was lack of capacity.
Data Availability
Anonymized data requests will be considered by the Steering Committee from any qualified investigator.
Results
Population Summary
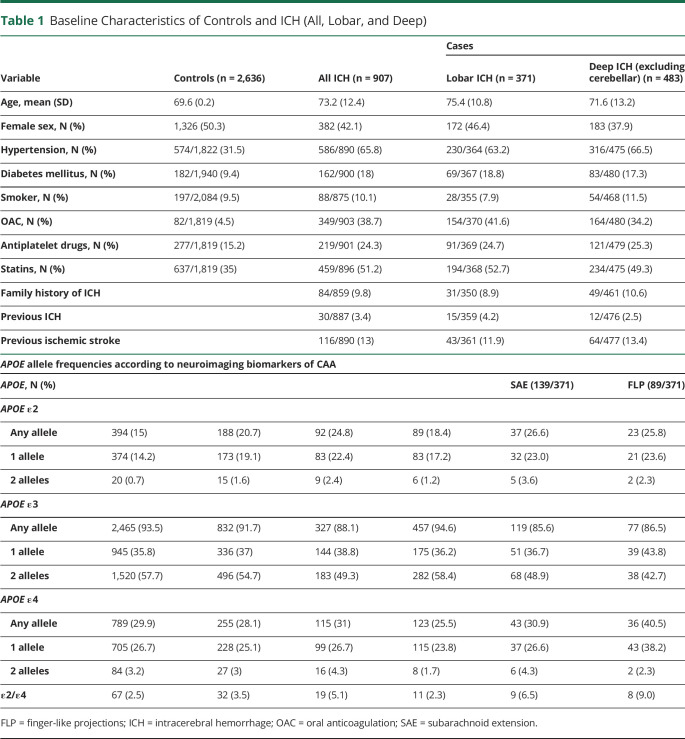
Among the overall cohort of 1,094 patients with ICH, the APOE genotype was available in 907. The mean age was 73.2 years (SD 12.4 years), and 382 (42.1%) were female. The mean age of 2,636 controls (all with the APOE genotype available) was 69.5 years (SD 0.24), and 1,326 (50.3%) were female. See Table 1 for baseline characteristics and APOE genotype frequency according to the case-control status and ICH subgroup. Controls tended to be younger, more frequently female, and less frequently had hypertension and diabetes mellitus. With regard to drug intake, controls had a less frequent intake of all compared medications (oral anticoagulation, antiplatelets, and statins). Of the 907 patients with ICH, 371 (43.4%) had lobar and 483 (56.6%) deep ICH location (excluding 53 patients with cerebellar ICH). There was no difference between patients with the genotype available and those not (data not shown).
Table 1.
Baseline Characteristics of Controls and ICH (All, Lobar, and Deep)
Association of APOE and ICH
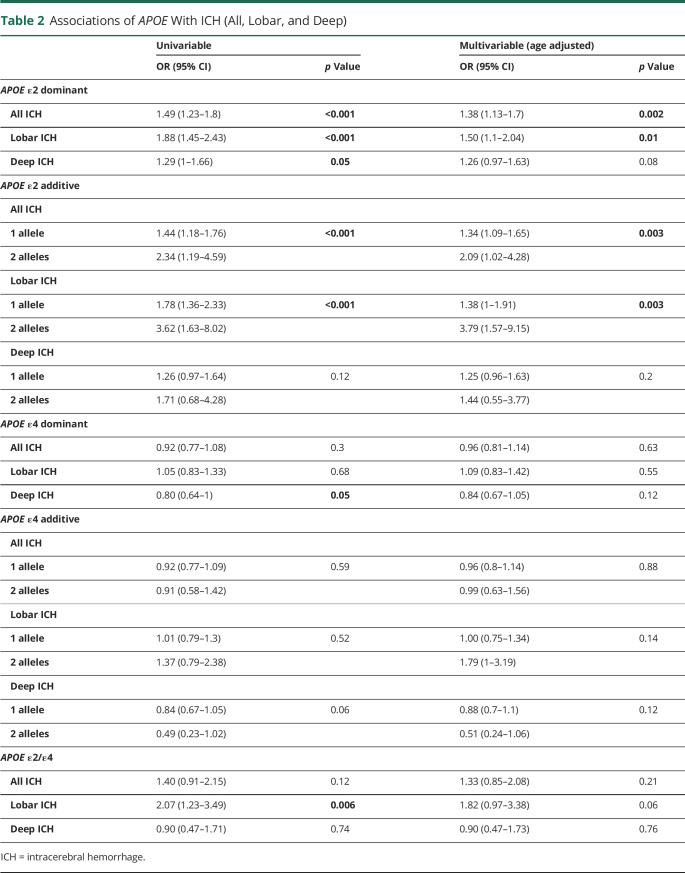
Compared with controls (n = 2,636), we found an independent statistically significant association of the APOE ε2 allele as a dominant variable with all ICH (n = 907, OR 1.38, 95% CI 1.13–1.7, p = 0.002) and lobar ICH (n = 371, OR 1.50, 95% CI 1.1–2.04, p = 0.01) in the age-adjusted multivariable analysis; this risk increased with increasing allele count (additive model; overall p value = 0.003; Table 2). We found a weak, nonsignificant association of APOE ε2 with deep ICH (n = 483, OR 1.26, 95% CI 0.97–1.63, p = 0.08). For APOE ε4, we found no association with all, lobar, or deep ICH location compared with controls (Table 2, all p value >0.05). There was also weak, nonsignificant evidence for an association of ε2/ε4 with lobar ICH location (OR 1.82, 95% CI 0.97–3.38, p = 0.06).
Table 2.
Associations of APOE With ICH (All, Lobar, and Deep)
APOE and Location of ICH (Cases-Only Analysis)
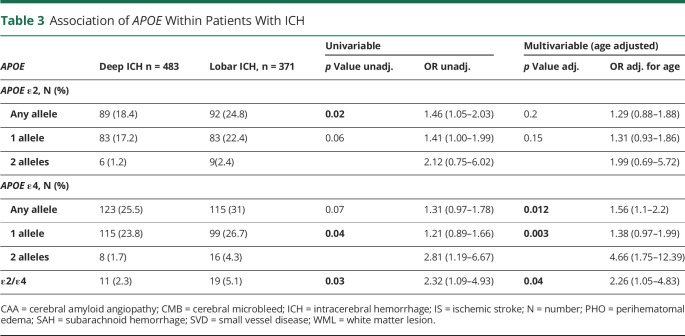
In the multivariable age-adjusted analyses, the APOE ε4 allele was associated with lobar ICH location compared with deep ICH location (OR 1.56, 95% CI 1.1–2.2, p = 0.01, Table 3), and the strength of association increased with increasing allele count (OR of 1.38 for 1 and 4.66 for 2 alleles [95% CI 0.97–1.99 and 1.75–12.39, respectively, overall p = 0.003]). In the multivariable age-adjusted analyses, APOE ε2/ε4 heterozygosity was associated with lobar ICH location (OR 2.26, 95% CI 1.05–4.83, p = 0.04).
Table 3.
Association of APOE Within Patients With ICH
APOE and Neuroimaging Markers of CAA
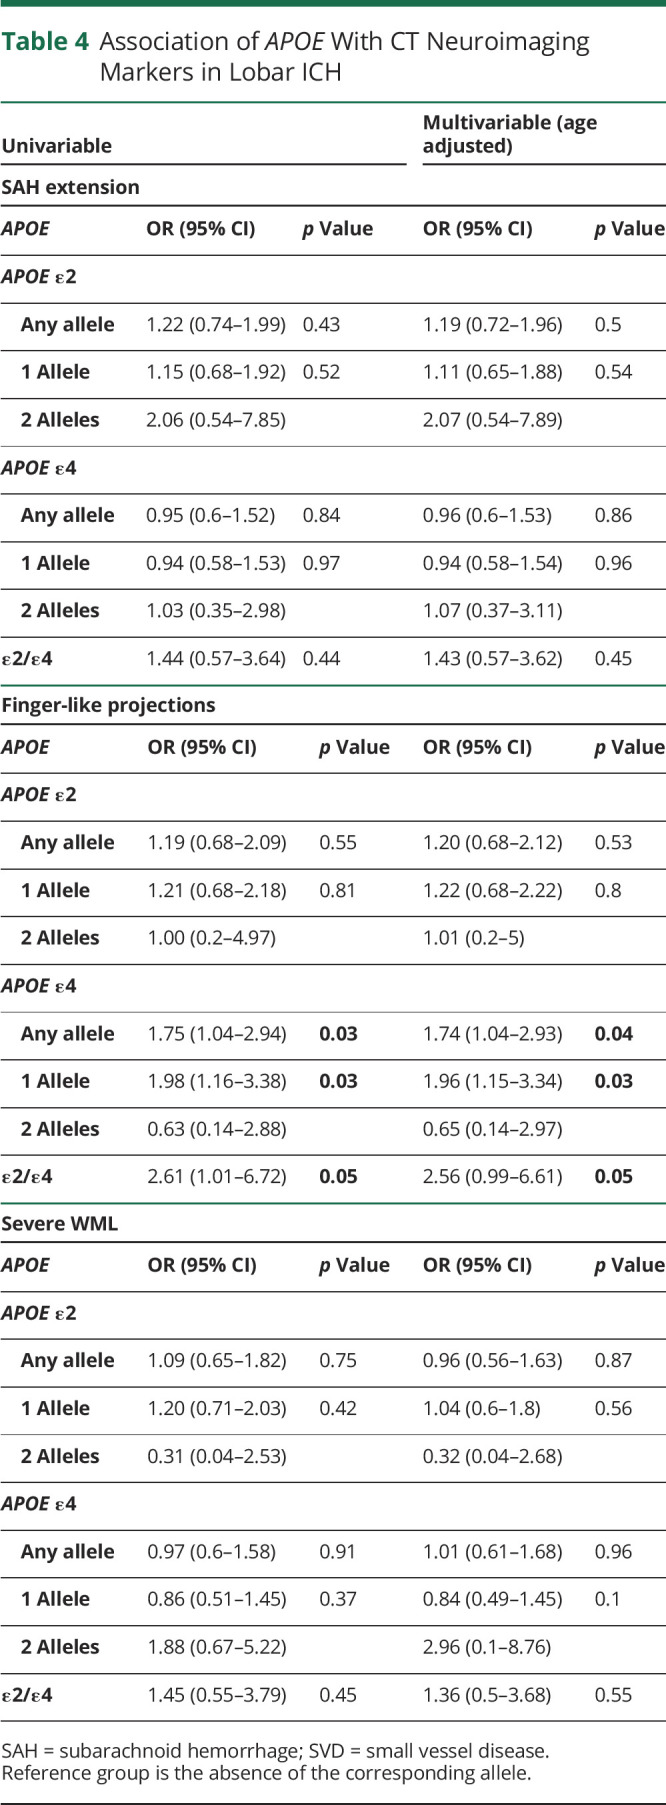
In patients with lobar ICH, APOE ε4 was associated with FLP as a dominant (OR 1.74, 95% CI 1.04–2.93, p = 0.04) and an additive variable (overall p value = 0.03, Table 4). Heterozygosity for ε2/ε4 was also associated with FLP (OR 2.56, 95% CI 0.99–6.61, p = 0.05). None of the APOE genotypes were associated with SAE in patients with lobar ICH, neither in the univariable nor in the age-adjusted multivariable analysis (Table 4). We conducted a sensitivity analysis adjusting the multivariable analysis for ICH volume in addition to age, which did not significantly change our results (eTable 2, links.lww.com/WNL/C187).
Table 4.
Association of APOE With CT Neuroimaging Markers in Lobar ICH
Discussion
In this analysis of a large well-phenotyped ICH cohort, we found that the APOE alleles ε2 and ε4 were independently associated with lobar ICH, APOE ε2 when compared with controls, and APOE ε4 when compared within patients with ICH. Our main new observation is that APOE ε4 and ε2/ε4 alleles are selectively associated with FLP but not SAE. Our findings suggest that different APOE alleles have diverging influences on individual neuroimaging biomarkers, and thus potentially with different pathophysiological processes, in acute CAA-associated ICH.
Our study confirms and extends findings from prior studies: we found APOE ε2 and ε2/ε4 to be associated with all ICH (compared with population controls) and ε4 and ε2/ε4 with lobar ICH location (compared with a deep ICH location).27 Previous association findings of the APOE genotype with lobar and deep ICH location have been inconsistent.27,33–35 For example, one study found an association between APOE ε4 and deep ICH location, whereas another did not.27,33 There could be several reasons for inconsistent findings: even slight changes in classification of ICH location could change associations with the APOE genotype. In the CROMIS-2 study, all imaging data were collected and rated centrally using a validated rating instrument, but this is not always the case.27 In line with other studies, we excluded cerebellar ICH location when assessing the subgroups of lobar and deep ICH.27 However, this is not routinely done and might also explain some inconsistencies.35
In recent years, neuroimaging markers have been developed for CT imaging additionally to MRI.31,32,36 The recently reported associations between FLP and SAE with pathologically verified CAA prompted us to investigate whether these new biomarkers are associated with different APOE genotypes in our ICH cohort.31 Our data show that different neuroimaging markers show different associations with the APOE genotype: ε2/ε4 heterozygosity was consistently associated with an increased likelihood of FLP in patients with lobar ICH, as was ε4 (in both dominant and additive models). By contrast, we found no statistically significant association of the APOE genotype with SAE. These findings suggest that APOE alleles may modify the manifestations of specific neuroimaging biomarkers of CAA. This in turn raises the possibility that APOE influences distinct pathologic processes in CAA. For example, it is possible that FLP represent severe parenchymal amyloid deposition, whereas SAE could relate to large volume ICH (with leakage into the subarachnoid space) or severe leptomeningeal CAA.37–39 Moreover, there are 2 different pathologic CAA subtypes: type 1, which is associated with ε4 and capillary CAA, and type 2 associated with ε2 and CAA in larger vessels.40 It is thus possible that FLP are a biomarker of more severe capillary CAA, leading to an increased probability of intracerebral bleeding dissecting into brain tissue. A previous meta-analysis evaluating the association of APOE and cortical superficial siderosis (cSS), but not cortical subarachnoid hemorrhage, showed an increased likelihood of cSS in patients harboring APOE ε2 genotypes.41 Cortical SS is a sign of cortical subarachnoid hemorrhage having previously taken place keeping in mind that convesity SAH (cSAH) is a strong risk factor of subsequent ICH in patients with CAA.42 Therefore, it is perhaps surprising that APOE ε2 was not significantly associated with SAE in our cohort. Furthermore, a subanalysis of patients with available MRI (175 patients) and therefore cSS ratings, APOE ε2 was not associated with cSS (data not shown).
Our study has strengths. We included a large prospective cohort with extensive phenotype data, including standardized assessment of neuroimaging characteristics associated with CAA and SVD presence and severity.
Our study also has limitations. CROMIS-2 has a bias toward ICH survivors as the patient, or a representative, had to consent for the patient to be included in the study. Therefore, the patients with most severe ICH could not be included into CROMIS-2. Independent large cohorts are needed to verify our findings. Finally, we did not have information on ethnicity in our population controls, and some variables of interest, such as hypertension and anticoagulation, had a high missingness rate. This precluded safe multiple imputation, and therefore, only43 very limited statements about frequency could be made about them. In addition, ethnicity for our patients with ICH was self-reported. Ethnicity should ideally be checked with multiple dimensional scaling analysis as reported, and genotyped ethnicity can diverge significantly.44,45
We confirm previously reported association between APOE alleles and lobar ICH. In addition, we show a selective association between the APOE ε2 and ε4 alleles with a CT-based neuroimaging marker of CAA, namely FLP. This might indicate that not all APOE alleles have the same effect on neuroimaging biomarkers of CAA-associated ICH and underlying pathophysiological processes. However, these results need to be replicated in a larger external, independent cohorts.
Glossary
- CAA
cerebral amyloid angiopathy
- CROMIS-2
Clinical Relevance of Microbleeds in Stroke
- cSS
cortical superficial siderosis
- FLP
finger-like projections
- ICH
intracerebral hemorrhage
- MRC NSHD
Medical Research Council National Survey of Health and Development
- SAE
subarachnoid extension
- SVD
small vessel disease
Appendix. Authors

Study Funding
This study was funded by the Stroke Association (CROMIS-2) and the British Heart Foundation (grant TSA BHF 2009/01).
Disclosure
The authors report no relevant disclosures. Go to Neurology.org/N for full disclosures.
References
- 1.Bamford J, Sandercock P, Dennis M, Burn J, Warlow C. A prospective study of acute cerebrovascular disease in the community: the Oxfordshire Community Stroke Project: 1981-86. 2. Incidence, case fatality rates and overall outcome at one year of cerebral infarction, primary intracerebral and subarachnoid haemorrhage. J Neurol Neurosurg Psychiatry. 1990;53(1):16-22. [DOI] [PMC free article] [PubMed] [Google Scholar]
- 2.Hong KS, Bang OY, Kang DW, et al. Stroke statistics in Korea: part I. Epidemiology and risk factors: a report from the Korean stroke society and clinical research center for stroke. J Stroke. 2013;15(1):2-20. [DOI] [PMC free article] [PubMed] [Google Scholar]
- 3.Toyoda K. Epidemiology and registry studies of stroke in Japan. J Stroke. 2013;15(1):21-26. [DOI] [PMC free article] [PubMed] [Google Scholar]
- 4.van Asch CJ, Luitse MJ, Rinkel GJ, van der Tweel I, Algra A, Klijn CJ. Incidence, case fatality, and functional outcome of intracerebral haemorrhage over time, according to age, sex, and ethnic origin: a systematic review and meta-analysis. Lancet Neurol. 2010;9(2):167-176. [DOI] [PubMed] [Google Scholar]
- 5.Moulin S, Labreuche J, Bombois S, et al. Dementia risk after spontaneous intracerebral haemorrhage: a prospective cohort study. Lancet Neurol. 2016;15(8):820-829. [DOI] [PubMed] [Google Scholar]
- 6.Sudlow C, Martinez Gonzalez NA, Kim J, Clark C. Does apolipoprotein E genotype influence the risk of ischemic stroke, intracerebral hemorrhage, or subarachnoid hemorrhage? Systematic review and meta-analyses of 31 studies among 5961 cases and 17, 965 controls. Stroke. 2006;37(2):364-370. [DOI] [PMC free article] [PubMed] [Google Scholar]
- 7.Bejot Y, Cordonnier C, Durier J, Aboa-Eboule C, Rouaud O, Giroud M. Intracerebral haemorrhage profiles are changing: results from the Dijon population-based study. Brain. 2013;136(pt 2):658-664. [DOI] [PubMed] [Google Scholar]
- 8.Lovelock CE, Molyneux AJ, Rothwell PM, Oxford Vascular Study. Change in incidence and aetiology of intracerebral haemorrhage in Oxfordshire, UK, between 1981 and 2006: a population-based study. Lancet Neurol. 2007;6:487-493. [DOI] [PubMed] [Google Scholar]
- 9.Kuh D, Wong A, Shah I, et al. The MRC National Survey of Health and Development reaches age 70: maintaining participation at older ages in a birth cohort study. Eur J Epidemiol. 2016;31(11):1135-1147. [DOI] [PMC free article] [PubMed] [Google Scholar]
- 10.Wadsworth M, Kuh D, Richards M, Hardy R. Cohort profile: the 1946 national birth cohort (MRC national Survey of Health and development). Int J Epidemiol. 2006;35(1):49-54. [DOI] [PubMed] [Google Scholar]
- 11.Martinez-Gonzalez NA, Sudlow CLM. Effects of apolipoprotein E genotype on outcome after ischaemic stroke, intracerebral haemorrhage and subarachnoid haemorrhage. J Neurol Neurosurg Psychiatry. 2006;77(12):1329-1335. [DOI] [PMC free article] [PubMed] [Google Scholar]
- 12.Bell RD, Winkler EA, Singh I, et al. Apolipoprotein E controls cerebrovascular integrity via cyclophilin A. Nature. 2012;485(7399):512-516. [DOI] [PMC free article] [PubMed] [Google Scholar]
- 13.Zlokovic BV. Cerebrovascular effects of apolipoprotein E: implications for Alzheimer disease. JAMA Neurol. 2013;70(4):440-444. [DOI] [PMC free article] [PubMed] [Google Scholar]
- 14.Rannikmae K, Samarasekera N, Martinez-Gonzalez NA, Al-Shahi Salman R, Sudlow CLM. Genetics of cerebral amyloid angiopathy: systematic review and meta-analysis. J Neurol Neurosurg Psychiatry. 2013;84(8):901-908. [DOI] [PubMed] [Google Scholar]
- 15.Biffi A, Anderson CD, Jagiella JM, et al. , International Stroke Genetics Consortium. APOE genotype and extent of bleeding and outcome in lobar intracerebral haemorrhage: a genetic association study. Lancet Neurol. 2011;10(8):702-709. [DOI] [PMC free article] [PubMed] [Google Scholar]
- 16.Schilling S, DeStefano AL, Sachdev PS, et al. APOE genotype and MRI markers of cerebrovascular disease: systematic review and meta-analysis. Neurology. 2013;81(3):292-300. [DOI] [PMC free article] [PubMed] [Google Scholar]
- 17.Lemmens R, Gorner A, Schrooten M, Thijs V. Association of apolipoprotein E epsilon2 with white matter disease but not with microbleeds. Stroke. 2007;38(4):1185-1188. [DOI] [PubMed] [Google Scholar]
- 18.Luo X, Jiaerken Y, Yu X, et al. Associations between APOE genotype and cerebral small-vessel disease: a longitudinal study. Oncotarget. 2017;8(27):44477-44489. [DOI] [PMC free article] [PubMed] [Google Scholar]
- 19.Utter S, Tamboli IY, Walter J, et al. Cerebral small vessel disease-induced apolipoprotein E leakage is associated with Alzheimer disease and the accumulation of amyloid beta-protein in perivascular astrocytes. J Neuropathol Exp Neurol. 2008;67(9):842-856. [DOI] [PubMed] [Google Scholar]
- 20.Rannikmae K, Kalaria RN, Greenberg SM, et al. APOE associations with severe CAA-associated vasculopathic changes: collaborative meta-analysis. J Neurol Neurosurg Psychiatry. 2014;85(3):300-305. [DOI] [PMC free article] [PubMed] [Google Scholar]
- 21.Nelson PT, Pious NM, Jicha GA, et al. APOE-ε2 and APOE-ε4 correlate with increased amyloid accumulation in cerebral vasculature. J Neuropathol Exp Neurol. 2013;72(7):708-715. [DOI] [PMC free article] [PubMed] [Google Scholar]
- 22.Charidimou A, Wilson D, Shakeshaft C, et al. The Clinical Relevance of Microbleeds in Stroke study (CROMIS-2): rationale, design, and methods. Int J Stroke. 2015;10(suppl A100):155-161. [DOI] [PubMed] [Google Scholar]
- 23.Stafford M, Black S, Shah I, et al. Using a birth cohort to study ageing: representativeness and response rates in the National Survey of Health and Development. Eur J Ageing. 2013;10(2):145-157. [DOI] [PMC free article] [PubMed] [Google Scholar]
- 24.Crook R, Hardy J, Duff K. Single-day apolipoprotein E genotyping. J Neurosci Methods. 1994;53(2):125-127. [DOI] [PubMed] [Google Scholar]
- 25.Rousseau K, Vinall LE, Butterworth SL, et al. MUC7 haplotype analysis: results from a longitudinal birth cohort support protective effect of the MUC7*5 allele on respiratory function. Ann Hum Genet. 2006;70(pt 4):417-427. [DOI] [PubMed] [Google Scholar]
- 26.Rawle MJ, Davis D, Bendayan R, Wong A, Kuh D, Richards M. Apolipoprotein-E (Apoe) ε4 and cognitive decline over the adult life course. Transl Psychiatry. 2018;8(1):18. [DOI] [PMC free article] [PubMed] [Google Scholar]
- 27.Biffi A, Sonni A, Anderson CD, et al. , International Stroke Genetics Consortium. Variants at APOE influence risk of deep and lobar intracerebral hemorrhage. Ann Neurol. 2010;68(6):934-943. [DOI] [PMC free article] [PubMed] [Google Scholar]
- 28.Charidimou A, Schmitt A, Wilson D, et al. The cerebral haemorrhage anatomical RaTing inStrument (CHARTS): development and assessment of reliability. J Neurol Sci. 2017;372:178-183. [DOI] [PubMed] [Google Scholar]
- 29.Pasi M, Marini S, Morotti A, et al. Cerebellar hematoma location: implications for the underlying microangiopathy. Stroke. 2018;49(1):207-210. [DOI] [PMC free article] [PubMed] [Google Scholar]
- 30.The University of Edinburgh, Edinbugh Imaging. Edinburgh Criteria for CAA-associated ICH Training (ECCITING. Accessed July 19, 2022. ed.ac.uk/clinical-sciences/edinburgh-imaging/education-teaching/short-courses/training-tools/edinburgh-criteria-for-caa-associated-ich-training.
- 31.Rodrigues MA, Samarasekera N, Lerpiniere C, et al. The Edinburgh CT and genetic diagnostic criteria for lobar intracerebral haemorrhage associated with cerebral amyloid angiopathy: model development and diagnostic test accuracy study. Lancet Neurol. 2018;17(3):232-240. [DOI] [PMC free article] [PubMed] [Google Scholar]
- 32.Samarasekera N, Rodrigues MA, Toh PS, Al-Shahi S. Imaging features of intracerebral hemorrhage with cerebral amyloid angiopathy: systematic review and meta-analysis. PLoS One. 2017;12(7):e0180923. [DOI] [PMC free article] [PubMed] [Google Scholar]
- 33.Woo D, Deka R, Falcone GJ, et al. Apolipoprotein E, statins, and risk of intracerebral hemorrhage. Stroke. 2013;44(11):3013-3017. [DOI] [PMC free article] [PubMed] [Google Scholar]
- 34.Chen C, Hu Z. ApoE polymorphisms and the risk of different subtypes of stroke in the Chinese population: a comprehensive meta-analysis. Cerebrovasc Dis. 2016;41(3-4):119-138. [DOI] [PubMed] [Google Scholar]
- 35.Woo D, Kaushal R, Chakraborty R, et al. Association of apolipoprotein E4 and haplotypes of the apolipoprotein E gene with lobar intracerebral hemorrhage. Stroke. 2005;36(9):1874-1879. [DOI] [PubMed] [Google Scholar]
- 36.Arba F, Inzitari D, Ali M, Warach SJ, Luby M, Lees KR, STIR/VISTA Imaging Collaboration. Small vessel disease and clinical outcomes after IV rt-PA treatment. Acta Neurol Scand. 2017;136(1):72-77. [DOI] [PubMed] [Google Scholar]
- 37.Maas MB, Nemeth AJ, Rosenberg NF, et al. Subarachnoid extension of primary intracerebral hemorrhage is associated with poor outcomes. Stroke. 2013;44(3):653-657. [DOI] [PubMed] [Google Scholar]
- 38.Chen G, Arima H, Wu G, et al. , INTERACT2 Investigators. Subarachnoid extension of intracerebral hemorrhage and 90-day outcomes in INTERACT2. Stroke. 2014;45(1):258-260. [DOI] [PubMed] [Google Scholar]
- 39.Saito S, Ikeda Y, Ando D, Carare RO, Ishibashi-Ueda H, Ihara M. Cerebral amyloid angiopathy presenting as massive subarachnoid haemorrhage: a case study and review of literature. Front Aging Neurosci. 2020;12:538456. [DOI] [PMC free article] [PubMed] [Google Scholar]
- 40.Thal DR, Ghebremedhin E, Rub U, Yamaguchi H, Del Tredici K, Braak H. Two types of sporadic cerebral amyloid angiopathy. J Neuropathol Exp Neurol. 2002;61(3):282-293. [DOI] [PubMed] [Google Scholar]
- 41.Charidimou A, Zonneveld HI, Shams S, et al. APOE and cortical superficial siderosis in CAA: meta-analysis and potential mechanisms. Neurology. 2019;93(4):e358-e371. [DOI] [PMC free article] [PubMed] [Google Scholar]
- 42.Hostettler IC, Wilson D, Fiebelkorn CA, et al. Risk of intracranial haemorrhage and ischaemic stroke after convexity subarachnoid haemorrhage in cerebral amyloid angiopathy: international individual patient data pooled analysis. J Neurol. 2022;269(3):1427-1438. [DOI] [PMC free article] [PubMed] [Google Scholar]
- 43.Sawyer RP, Sekar P, Osborne J, et al. Racial/ethnic variation of APOE alleles for lobar intracerebral hemorrhage. Neurology. 2018;91(5):e410-e420. [DOI] [PMC free article] [PubMed] [Google Scholar]
- 44.Shraga R, Yarnall S, Elango S, et al. Evaluating genetic ancestry and self-reported ethnicity in the context of carrier screening. BMC Genet. 2017;18(1):99. [DOI] [PMC free article] [PubMed] [Google Scholar]
- 45.Lee YL, Teitelbaum S, Wolff MS, Wetmur JG, Chen J. Comparing genetic ancestry and self-reported race/ethnicity in a multiethnic population in New York City. J Genet. 2010;89(4):417-423. [DOI] [PMC free article] [PubMed] [Google Scholar]
Associated Data
This section collects any data citations, data availability statements, or supplementary materials included in this article.
Data Availability Statement
Anonymized data requests will be considered by the Steering Committee from any qualified investigator.


