

Abstract
Background and Objectives
The understanding of the natural history of Friedreich ataxia (FRDA) has improved considerably recently, but patterns of neurologic deterioration are not fully clarified, compromising the assessment of the clinical relevance of effects and guidance for study design. The goal of this study was to acknowledge the broad genetic diversity of the population, especially for younger individuals, and to provide analyses stratified by age to guide population selection in future studies.
Methods
Based on a large natural history study, the FRDA Clinical Outcome Measures study that at the current data cut enrolled 1,115 participants, followed up for 5,287 yearly visits, we present results from the modified FRDA Rating Scale and its subscores. The secondary outcomes included the patient-reported activities of daily living scale, the timed 25-foot walk, and the 9-hole peg test. Long-term progression was modeled using slope analyses within early-onset, typical-onset, intermediate-onset, and late-onset FRDA. To reflect recruitment in clinical trials, short-term changes were analyzed within age-based subpopulations. All analyses were stratified by ambulation status.
Results
Long-term progression models stratified by disease severity indicated highly differential disease progression, especially at earlier ages at onset. In the ambulatory phase, decline was driven by axial items assessed by the Upright Stability subscore of the mFARS. The analyses of short-term changes showed slower progression with increasing population age due to decreasing genetic severity. Future clinical studies could reduce population diversity, interpatient variability, and the risk of imbalanced treatment groups by selecting the study population based on the functional capacity (e.g., ambulatory status) and by strict age-based stratification.
Discussion
The understanding of the diversity within FRDA populations and their patterns of functional decline provides an essential foundation for future clinical trial design including patient selection and facilitates the interpretation of the clinical relevance of progression detected in FRDA.
Friedreich ataxia (FRDA) is an autosomal recessive neurodegenerative disease caused by biallelic guanine-adenine-adenine (GAA) triplet-repeat expansions in intron 1 of the FXN gene, which encodes the mitochondrial protein frataxin. Approximately 4%–5% of patients are compound heterozygous for an expansion and a point mutation or deletion.1,2 Clinical presentation is diverse, largely reflecting variability in the size of the causal expanded GAA repeats. The length of the shorter expansion (GAA1) is sufficient to explain the distinction between patients with severe, early-onset disease and those with milder, later-onset disease, but is less predictive of differences within groups of similar age of onset (AOO), the most important predictor of clinical progression. Environmental and unidentified genetic modifiers explain approximately 50% of the variability in onset, consistent with the observation that epigenetic silencing of the FXN gene is similar for repeat lengths more than 500, a number almost uniformly found among early-onset individuals with biallelic expansions.3
AOO is accepted as the best individual predictor of genetic severity and correlates inversely with the length of GAA1. Several thresholds have been suggested to classify clinical presentation. AOO before or after an age of 15 years was proposed based on cross-sectional correlation analyses4 and later supported in a large natural history cohort, the EFACTS study.5 Subsequent longitudinal reports dropped this classification,6 making it more difficult to understand the diversity in this cohort. However, an even earlier threshold (AOO in those younger than 8 years or 0–7 years) is useful in interpreting neurologic progression,7 scoliosis,8 and the occurrence of diabetes mellitus.9 For late-onset FRDA,10 qualitative phenotypic differences appear11,12 using AOO thresholds of 25 years13 and even 40 years.14
Based on these findings, a 4-group stratification might prove useful: early-onset (0–7 years), typical Onset (8–14 years), intermediate-onset (15–24 years), and late-onset FRDA (older than 24 years). While transitions will always be fluid and might imperfectly represent the continuous nature of the causal defect, such grouping can help to identify subgroups with more homogeneous progression and support the understanding of clinical cohort structures beyond simple summary statistics.
Progression in FRDA is primarily assessed through rating scales, such as the Scale for Assessment and Rating of Ataxia (SARA)15 and the modified Friedreich Ataxia Rating Scale (mFARS).16 These instruments capture most patient-relevant features and are sensitive to change,6,17 but they rely heavily on axial function, balance, and walking (35% in SARA and 34% mFARS). This reshapes the functional sources of decline after loss of ambulation (LoA), and relative values of change cannot be readily compared.
For FRDA, LoA provides a milestone in the progression of FRDA that can serve as an anchor to assess clinical benefits. The most severely affected individuals become wheelchair-dependent at a median time of 11 years after onset of the first symptoms18; while further analyses will be necessary, in principle, any deferral of this time constitutes a clinically relevant benefit. Patients with FRDA commonly live for several decades after LoA.19,20
In view of the abovementioned facts, we aimed to further identify the genetic and initial clinical features of FRDA useful for stratification in clinical trials, characterize the loss of long-term function during disease progression by severity group and ambulation status, and provide selection criteria and endpoint sensitivity in age-based clinical trial-like cohorts. The latter analyses are particularly important because our study covered all age ranges of interest for clinical research.
Methods
Participants and Outcomes
The Friedreich Ataxia Clinical Outcome Measures Study (FACOMS, NCT03090789) has continuously enrolled participants since 2003,17 with genetic confirmation of the disease by assessment of the GAA repeat length as effectively the only inclusion criteria. Follow-up time is not limited. To exclude influence of the COVID pandemic, we used data collected before April 28, 2020. Evaluations were conducted at 15 international centers (eTable 1, links.lww.com/WNL/C195). The primary outcome measure was the mFARS and its sub scores,16 derived from the complete FARS examination,21,22 with the following secondary outcomes: a patient-reported activities of daily living scale (ADL9 items scored 0–4 each for a maximum disability of 36 points)17; 2 direct functional measures: the timed 25-foot walk (T25FW) and 9-hole peg test (9HPT). Both timed measures are reported as velocities (m/s and 1/min peg boards per minute, respectively), and observations were excluded once a patient became unable to perform the test due to disease progression (unable thresholds were set to 180s for T25FW and 350s for the 9HPT, occurrence <0.5%); and the functional disease staging (FDS), used for the overall functional status of participants and to derive ambulation status. Notably, LoA in FRDA is not a temporary isolated event but a process that spans several years even in the most severely affected patients. As previously,18 we defined the time of LoA as the first attainment of a score of 5 on the FDS, defined as “wheelchair bound,”18 i.e., considered unable to walk at all and uses wheelchair for essentially all movement.
Statistical Analyses
Disease progression over time was analyzed using 2 different methods to recognize different temporal contexts. FACOMS allows the assessment of broad disease evolution over decades and all stages. For the first analysis, we performed linear mixed-effects modeling (using restricted maximum likelihood, REML) with random effects on slope and intercept, the baseline value, and the AOO group (0–7 years, 8–14 years, 15–24 years, older than 24 years) as fixed effects. Time was expressed in years since the baseline visit (days divided by 365.25). Progression slopes were derived from the time*AOO group interaction.
By contrast, clinical trials are typically restricted to relatively short follow-up periods, where long-term predictors such as AOO are potentially less influential. Therefore, in a second type of analysis, the mean changes in 1-year or 2-year intervals were analyzed, stratified by current age group. Both children and adults were separated into 3 age brackets each (younger than 8 years, 8–11 years, and 12–15 years; 16–24 years, 25–40 years, and older than 40 years). These age groups were selected to cover ranges typically used in FRDA, as shown by important historical clinical trials, e.g., IONIA23 (drug: idebenone, age range 7–17 years), STEADFAST24 (interferon gamma, 10–26 years), and MOXIE (omaveloxolone). The latter study recruited patients aged 16–40 years, and results indicate that most of them were younger than 25 years.25 Within each age bracket, yearly changes were analyzed using descriptive mean values and estimates from linear mixed-effects models using repeated measures. AOO (continuous) and within-age group baseline values were used as independent covariates. The sensitivity of selected endpoints was assessed using standard response mean (SRM) values (mean change divided by SD of change).
Data were used as available, and no missing data were imputed. Visits from early/presymptomatic individuals (mFARS < 20 points) were excluded (n = 118, 2.2%). The mFARS, its sub scores, and ADL values were computed only when all items were available, leading to 111 visits (2.1%) with missing FARS data. No prespecified hypothesis was made; all statistical tests were performed 2 sided and interpreted in a descriptive, exploratory way, with p values<0.05 considered statistically significant. Statistical calculations were performed in R (R Core Team, 2021) with lme426 for mixed-effect models. Further information on data collection, statistical methodology, and analysis is given as supplementary material.
Standard Protocol Approvals, Registrations, and Patient Consents
Written informed consent was obtained from all patients or their authorized surrogates at enrollment and renewed at every yearly visit. The FACOMS study was approved by the local ethics committee of each participating center and is registered with ClinicalTrials.gov (NCT03090789).
Data Availability
The FACOMS, including relevant study information is part of the Friedreich Ataxia Integrated Clinical Database, available on appropriate request at The Data Collaboration Center of the Critical Path Institute.
Results
Demographics and Follow-up Time
Among 1,115 individuals with FRDA, 324 experienced early-onset (0–7 years, 29%), 438 typical-onset (8–14 years, 39%), 234 intermediate-onset (15–24 years, 21%), and 119 late-onset FRDA (>24 years, 11%, Table 1). The proportion of compound heterozygous individuals (carrying a point mutation or deletion) was 5.1%, slightly higher in earlier-onset groups. Depending on the type of mutation, these patients may show atypical clinical features and were excluded from analyses beyond demographics.27,28 Progression properties of this group will be reported elsewhere. The median follow-up time was 5 (IQR 3–10) years, relatively balanced over all groups. At enrollment, 70.0% of patients were ambulatory, which decreased to 49% at the most recent visit. Further analyses of follow-up time by ambulation status are provided in eTable 2, links.lww.com/WNL/C195.
Table 1.
Demographic and Follow-up Characteristics by Onset Group

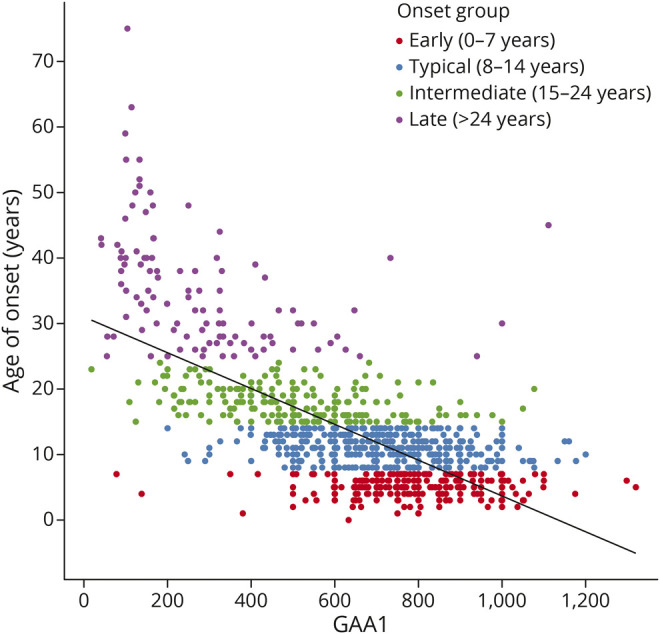
The number of GAA1 repeats predicts AOO and, as reported in the European EFACTS study, AOO occurs 2.3 years earlier per 100 repeats.5 Analogous regression of AOO as a function of GAA1 showed that on average for the whole population, onset was 2.73 years earlier for every 100 repeats (r2 = 0.46, 95% CI −2.91 to −2.55, Figure 1). The difference may reflect the smaller proportion of younger patients in EFACTS because the correlation differed between onset groups. Of note, a piecewise regression analysis indicates relatively poor fit statistics within onset group: the correlation was the highest for late onset (−1.76 y/100 repeats, r2 = 0.14, CI −2.60, −0.93), lower for intermediate onset (−0.45 y/100 repeats, r2 = 0.12, CI −0.61, −0.28) and typical onset (−0.26 y/100 repeats, r2 = 0.05, CI −0.38, −0.15), and insignificant for early onset (−0.01 y/100 repeats, r2 = 0.00, CI −0.10, 0.13). Similar modeling using polynomial functions did not improve the overall fit, and further segmentation of the late-onset group did not change the overall relation in this subgroup (data not shown).
Figure 1. Correlation of Age at Onset (AOO) With the Length of the Shorter FXN Gene GAA Repeat Expansion (GAA1).
Structure of the FACOMS Cohort
FACOMS is a continuously enrolling study, which complicates the analysis of the reasons for discontinuation, because dropouts occur frequently at later disease stage without the possibility to clarify a reason. This should, however, influence the results minimally in the ambulatory phase. In addition, follow-up time is not limited and differs widely. The longest follow-up time was 18 years (2 participants), 63 had 15 years or more years, and 254 had 10 years or more. Overall, 13% of in-between visits were missing, independent of genetic disease severity, but influenced by follow-up time (5.8% for 5 years or less, 22.6% for 6–10 years, and 20.9% for 11–15 years). The influence of intermittent missing data on age-based analyses of change is again difficult to interpret, but it should have minor effect on the long-term slope-based analyses.
The effect of genetic disease severity as defined by AOO on current age group becomes evident from Figure 2. At young ages, populations are dominated by severe, fast-progressing early-onset individuals, whereas from approximately 12 years of age onward, typical-onset FRDA predominates. Intermediate-onset and late-onset groups only play a significant role in cohorts with those older than 25 years. For the ambulatory disease phase, more detailed summary statistics by age group are summarized in eTable 3, links.lww.com/WNL/C195.
Figure 2. Visit Structure of the FACOMS Cohort.

Number of visits by ambulation, onset features, and current age. Age groups (see text) are enclosed by vertical dotted lines. Bold numbers show percentages of visits performed ambulatory within age groups. FACOMS = Friedreich Ataxia Clinical Outcome Measures Study.
Baseline Results
Baseline results were calculated by AOO group and ambulation status at enrollment. In general, early-onset individuals had higher mFARS and component scores (e.g., mFARS total and FARS B) at baseline, independent of ambulation status, whereas other groups had scores in a narrow range (Table 2). It is of interest that baseline results on functional tests behaved differently; baseline T25FW speeds were slower in the milder (but older) patient groups (intermediate and late onset), whereas 9HPT speed was greater in these types of patients.
Table 2.
Baseline Results in mFARS, ADL, and Functional Measures, by Ambulation Status

Disease Progression by Onset Group
Disease progression was faster with earlier AOO, regardless of the disease phase. For mFARS, in the ambulatory phase, early-onset group declined almost 50% faster than the typical-onset group (2.62, CI 2.35–2.90 vs 1.83, CI 1.60–2.06 points/y) and approximately twice as fast the intermediate-onset group (2.62, CI 2.35–2.90 vs 1.24, CI 0.95–1.53 points/y). Late onset was very similar to intermediate onset (1.18 vs 1.24 points/y, Figure 3A). In the ambulatory phase across all onset groups, decline in the mFARS score was driven by the Upright Stability Score (USS or FARS E, Figure 3B), with the lower limb subscore (FARS C) contributing most of the remaining decline. An additional illustration of all mFARS scores used in this analysis is provided in eFigure 1, links.lww.com/WNL/C195.
Figure 3. Estimated Yearly Progression by Onset Group and Ambulation Status.

mFARS (A), upright stability/FARS E (B), and FARS a, B, and C (C–E) activities of daily living (F), the timed 25-foot walk (G), 9-hole peg test (H). Note the differential y-axis scaling error bars represent 95% CIs. mFARS = modified Friedreich Ataxia Rating Scale.
The yearly progression in the USS differed by trend between early onset and typical onset (difference 0.21 points/y, CI −0.00 to 0.43), but the difference was less pronounced than that for the total mFARS score. In addition, compared with typical onset, individuals with intermediate onset and late onset declined slower in the USS (−0.51, CI −0.73 to −0.29 and −0.67, CI −0.94 to −0.40 points/y). For FARS B (upper limb coordination), during the ambulatory phase, only the early-onset group declined (−0.31 points/y, CI 0.12–0.50); in all other onset groups, the average progression was not different from 0.
These trends changed during the nonambulatory phase (Figure 3) because balance and gait functions are lost and FARS B (upper limbs) together with FARS C (lower limbs) drive decline. Overall decline in mFARS was lower, and differences by onset group were less evident and usually not statistically significant despite the large numbers of observations.
The bulbar function subscore (FARS A) contributes only 5 (5%) points to the total and only minimally affects total progression. It declines mostly in early onset and typical onset with higher changes during the nonambulatory phase.
The secondary outcome measures supported this pattern of progression. Decline in ADL did not differ among ambulatory early-onset and typical-onset individuals (difference 0.01 points/y, CI −0.19 to 0.21) but was lower in intermediate-onset and late-onset participants (difference −0.31 points/y, CI −0.52 to −0.10 and −0.56 points/y, CI −0.82 to −0.31, difference vs typical onset, respectively, eTable 4, links.lww.com/WNL/C195). Similarly, progression in both the 9HPT test and T25FW was slower with older AOO. In contrast to upper limb function (FARS B), the decline in the 9HPT was consistently greater throughout the ambulatory phase when stratified by the AOO groups. The 9HPT is the only outcome examined that showed relatively similar decline pre-LoA and post-LoA.
Analyses of Yearly Changes by Age Group
The mean annual changes in the mFARS score were the highest in the youngest age group (younger than 8 years) and steadily decreased with age (Figure 4A). However, the characteristics of decline in total mFARS were different in younger patients. Specifically, in the age group younger than 8 years and to a lesser extent in the age group 8–11 years, upper limb scores (FARS B, Figure 4C) contributed substantially to the overall decline. This result was consistent with the estimated decline for the early-onset group (shown earlier), who are predominantly enrolled at young ages. Upper limb (FARS B) scores also declined in the age group 8–11 years, but not after reaching 12 years of age. The mean USS changes were lower in children younger than 8 years but showed a consistent reduction in decline in all age groups after 8 years. Of note, the <8-year group is a very small subgroup (39 individuals, with 25 contributing changes at age younger than 8 years), and CIs in most endpoints overlapped with 0.
Figure 4. The Mean Annual Changes in Ambulatory Patients by Current Age Group.

mFARS (A), upright stability/FARS E (B), upper limb function/FARS B (C), activities of daily living (D), the timed 25-foot walk (E), 9-hole peg test (F). mFARS = modified Friedreich Ataxia Rating Scale.
The secondary functional tests were largely consistent with the corresponding mFARS sub scores. For example, the ADL behaved similarly to the USS, but with greater variability (Figure 4D). However, in contrast to upper limb function (FARS B), the 9HPT results continued to change in age groups older than 11 years albeit at a slower progression in the older age groups, following the pattern of the total mFARS score. On the contrary, the T25FW declined fastest in the 12- to 15-year age group, but at older ages, progression behaved similarly to the USS.
Mixed model results not only confirmed that AOO predicted the level of change in disease progression in certain situations but also that it was not a significant predictor in all situations. AOO was a highly statistically significant covariate for most mFARS components in the 16- to 24-year age group (eTable 5, links.lww.com/WNL/C195). The AOO covariate also significantly influenced ADL scores and timed tests (T25FW and 9HPT) but not as much as within the rating scale models. Similar results were found for direct functional measures (for the nonambulatory phase, see eTable 6, links.lww.com/WNL/C195).
Endpoint sensitivity was expressed as SRM (the mean change divided by SD of change) for selected endpoints in the ambulatory population (Figure 5). By this measure, total mFARS and USS (FARS E) were the most sensitive rating scales, while the most sensitive markers overall were secondary functional outcome measures especially the 9HPT.
Figure 5. Responsiveness of Selected Endpoints as Expressed by Standard Response Mean Values.

One-year and 2-year intervals, for ambulatory patients with current age 8–40 years. Using typical assumptions (80% power, α = 0.05, a treatment reduces progression by 50%), the y-axis labels correspond to 200 patients (SRM = 0.56), 100 patients (SRM = 0.80) and 50 patients (SRM = 1.12). SRM = standard response mean.
Discussion
We summarize the measurement of neurologic progression in a large natural history study of FRDA, examining in detail which functions are captured relative to the disease stage and current age. Long-term progression analysis indicates differential profiles based on AOO, and comprehensive, age-based analysis establishes short-term population-based disease progression patterns. These previously unavailable analyses should aid patient selection for clinical studies. Tight age-based stratification clarifies the utility of the most commonly used predictors of progression, GAA1 and AOO. Both correlate well with long-term progression in the full natural history study context but are less useful within narrower age ranges. GAA1 strongly predicts genetic severity within late-onset FRDA, but to a lesser degree with longer GAA1 repeats and earlier-onset disease; in patients with early onset, there is no statistical relationship. In these individuals, the theoretical change of genetic severity per year of AOO should be considerable, but the large variability obscures the relationship. It is of importance that our analysis focused on clinical features and subgroups, and it is known that AOO depends on a range of factors, such as frataxin levels and DNA methylation patterns.3
In ambulatory patients, the major driver of decline in mFARS scores were axial functions, as assessed in the USS/FARS E. These functions also dominate other rating scales (ICARS and SARA), and their progression differs greatly before and after the 15 year-threshold4 of AOO, a finding that this study strongly corroborates. The T25FW results confirm this pattern, and the ADL scores behave accordingly.
Appendicular function measures from FARS B plateau during adolescence that may reflect developmental gains at this age (see further). Differences in lower limb function loss are minor during both phases, reflected in a lower sensitivity (high variability at slow progression) of FARS C. However, FARS C nonambulatory baseline values are 35% higher when comparing early onset vs late onset (Table 2), indicating that individuals with milder disease retain more of this functionality beyond LoA and that most of this function is lost after enrollment.
Together with reflecting genetic severity, differences in disease progression between the AOO groups may indicate an interaction between disease processes and underlying development stages. Younger, more severely affected individuals are expected to decline faster,4,6,7,17 but our results attribute this decline not to more rapid axial function loss but to a specific pattern of early deterioration of appendicular function, as noted in FARS B. This pattern is not seen in the typical-onset and intermediate-onset groups before LoA. In the early-onset group, this may result from disease onset before puberty and indicate an interaction between neurodevelopment and neurodegeneration. Thus, in addition to influencing speed of progression, GAA1 length may influence phenotypic severity through effects on neuronal development and maturation. Such an interplay has been shown for other disorders (e.g., schizophrenia29 and Parkinson disease30) but may be more prominent in FRDA because the most severe patients are diagnosed several years before puberty, when developmental milestones are still being attained.31
This pattern has implications for participant selection in clinical trials: a shift of neurologic deterioration from axial to appendicular function below a certain age confounds the interpretation of clinical meaningfulness of these outcomes. Therefore, based on our data, 8 years may be an appropriate lower age limit for the current measures in FRDA, consistent with the finding that rating scales are potentially unreliable at ages younger than 8 years in healthy particiants.32 It is important that our results are based on relatively few patients diagnosed before the age of 8 years (Figure 2); they may not play a dominant role in most clinical trials.
Clinical studies in rare diseases such as FRDA may always span a range of ages, especially when focusing on individuals within a limited range of functional capacity (e.g., sufficient ability to ambulate). Expanding age cutoffs allows inclusion of more individuals with a less aggressive course and at an earlier stage of their disease, potentially at the expense of outcome sensitivity. This will increase the diversity of the population and appropriate stratification can ensure balanced treatment arms. Neither GAA1 nor AOO readily define such stratifications in a standardized manner. Instead, our results suggest that genetic diversity (the influence of AOO) can be limited by age-dependent stratification and by limiting patients' functional range. The latter is in practice already applied in most trials. As target ages might vary substantially, a careful reassessment of these results for any particular population and intervention may be needed. For typical trial sizes (e.g., 100 participants), stratification by median age (or age tertiles at larger sizes) should limit the risk of imbalanced treatment arms. Limitations emerge for very young populations because these most rapidly progressing individuals show the highest variability on current measures and AOO being at best a modest predictor of progression.
Our results can also refine endpoint selection. In particular, the change in USS/FARS E is very similar at the group level for ages 8–11 years and 12–15 years, and populations up to 24 years decline only slightly less fast. This makes USS a potentially superior endpoint in ambulant populations over the total mFARS score due to high changes in upper limb function/FARS B that diminish after approximately 12 years of age. The USS might also have other benefits: The recent MOXIE study25 showed a statistically significant effect of omaveloxolone compared with placebo in total mFARS, confirming its sensitivity to change and to potential treatment effects. However, a particularly large effect was also observed in the USS, which, in contrast to the total score, showed almost no placebo effect.25 This has been noted for axial functions in clinical trials,23,33 and studies focusing on comparing gait and balance outcomes in FRDA show superior responsiveness of the USS.34 Finally, the loss of USS-balance functions directly reflect future time to LoA,18 adding to the clinical relevance of the USS. On the contrary, potential ceiling effects might limit the use of FARS E in patients with only residual balance/walking capacity, potentially requiring carefully selected inclusion criteria.
Analysis of outcome responsiveness as indicated by their SRM values suggests that at least 18 months would be necessary to achieve sufficient power for most outcomes in the absence of a therapy that reverses disease course. The results indicate that in many situations, faster progression in children is more than compensated by higher variability. In nonambulatory patients, particularly results from the 9HPT seem promising and suggest that upper limb function would allow to assess meaningful change in individuals at this stage of the disease. Eminently, the variability in clinical trials is not necessarily comparable, and shorter trial durations are possible.25
On a more global note, FDS staging is mostly but not strictly monotonous, and using the first attainment of FDS 5 to separate the population into disease phases will shift this type of variability into the nonambulatory phase. In our analyses, this should increase confidence in the ambulatory results because it provides a defined functional limit, not unlike inclusion criteria in clinical trials. On the contrary, patients in the nonambulatory phase are a much more diverse subgroup because individual follow-up time will be influenced by not only functional status but also highly individual factors such as motivation and the ability to travel. The diversity of symptoms post-LoA makes it challenging to further establish functional milestones, and our results will likely underestimate progression in early nonambulatory patients (and vice-versa). Further research is necessary for this group, and the ADL findings (as also shown in Ref. 6) could stimulate focused patient-reported outcome development. Clinical research in late-stage FRDA will likely focus on specific symptoms (e.g., upper limb function, speech, and vision) rather than global outcome assessments.
Our results and methodology need to be opposed with data available from the European EFACTS study.6 No age-based results are available from this cohort, whereas we have shown that current age is a major predictor of population-based progression. In addition, long-term EFACTS analyses do not sufficiently differentiate disease severity, whereas we have shown that within the group with an AOO before <25 years progression differs broadly (more than a factor of 2). Both complicate conclusions on all levels, particularly on ADL scores that have a higher variability in our study. The fact that EFACTS almost exclusively recruited adults certainly not only contributes but also the way examinations were administered and other factors such as the influence of parents/peers in children need to be clarified. In addition, on partially subjective endpoints such as the ADL, variation of healthcare perspectives may influence grading of some questions. Our study also points out the importance of direct efficacy measures such as the T25FW and particularly the 9HPT, whereas EFACTS relies on composite endpoints whose clinical relevance may be more difficult to justify. Overall, the difference in population selection, incidentally, also explains the slightly higher average progression per 100 GAA repeats in our study compared with that in EFACTS. Although the values for GAA repeat length were used from commercial testing, assessment of the same participants in systematic basic science studies has not commonly revealed differences between commercial sizing and single-site research sizing.3
Notably, the variability in natural history studies does not always predict the findings in clinical trials, in which conditions are better controlled, and more repeated measures are possible within short follow-up times. Furthermore, participants commonly perform better in trials, again leading to reduced variability. Equally important, some conclusions are necessarily based on small subgroups or a limited follow-up, restricting their significance. Because the mFARS and other measures represent constructs to assess functional progression rather than actual biological change over time, correlations with ADL and QOL measures do not necessarily reflect the situation of individual participants, especially at the limits of the scale, in more advanced patients. Relatively uniform events such as LoA may be timed slightly differently based on exact results from the mFARS, ADL scores, timed walks, and disability scales. Thus, extrapolating the present population-based research findings to clinical care of a specific individual is imperfect.
In conclusion, we demonstrate the large diversity of clinical presentation and disease progression in FRDA. Individual severity was contextualized with age-based population analyses, providing selection criteria and stratification schemes for clinical trials. Most importantly, the relevant drivers of decline by disease phase were identified and quantified, informing the discussion of clinical relevance of rating scale changes in FRDA.
Glossary
- 9HPT
9-hole peg test
- ADL
activities of daily living
- AOO
age of onset
- FACOMS
Friedreich Ataxia Clinical Outcome Measures Study
- FRDA
Friedreich ataxia
- LoA
loss of ambulation
- mFARS
modified Friedreich Ataxia Rating Scale
- SARA
Scale for Assessment and Rating of Ataxia
- SRM
standard response mean
- T25FW
timed 25-foot walk
- USS
Upright Stability Score
Appendix. Authors

Study Funding
This study was funded by the Friedreich's Ataxia Research Alliance (FARS, curefa.org).
Disclosure
C. Rummey reports consultancy fees from Santhera, Voyager, Novartis, Minoryx, and Aavanti. M. Delatycki received grant funding from the National Health and Medical Research Council, Medical Research Future Fund, and Friedreich Ataxia Research Alliance. M. Corti is a consultant for Janssen Research & Development, LLC, and AavantiBio Inc. C. Gomez is supported by ERT/APDM for the IDEA study. R. Roxburgh reports funding from Roche and Biogen for unrelated research. L. Seeberger reports research grant support from Parkinson Study Group, Huntington Study Group, FARA, Biohaven Pharmaceuticals, and Neurocrine Biosciences. D.R. Lynch receives (outside the present study grants) from the NIH, FDA, FARA, MDA, Design, Retrotope, PTC, Reata, Stealth, Voyager, and Novartis. The other authors report no relevant disclosures. Go to Neurology.org/N for full disclosures.
References
- 1.Delatycki MB, Bidichandani SI. Friedreich ataxia- pathogenesis and implications for therapies. Neurobiol Dis. 2019;132:104606. doi: 10.1016/j.nbd.2019.104606. [DOI] [PubMed] [Google Scholar]
- 2.Galea CA, Huq A, Lockhart PJ, et al. Compound heterozygous FXN mutations and clinical outcome in friedreich ataxia: insights from Frataxin Structure and Function. Ann Neurol. 2016;79(3):485-495. doi: 10.1002/ana.24595. [DOI] [PubMed] [Google Scholar]
- 3.Rodden LN, Chutake YK, Gilliam K, et al. Methylated and unmethylated epialleles support variegated epigenetic silencing in Friedreich ataxia. Hum Mol Genet. 2021;29(23):3818-3829. doi: 10.1093/hmg/ddaa267. [DOI] [PMC free article] [PubMed] [Google Scholar]
- 4.Metz G, Coppard N, Cooper JM, et al. Rating disease progression of Friedreich's ataxia by the international cooperative ataxia rating scale: analysis of a 603-patient database. Brain. 2013;136(pt 1):259-268. doi: 10.1093/brain/aws309. [DOI] [PMC free article] [PubMed] [Google Scholar]
- 5.Reetz K, Dogan I, Costa AS, et al. Biological and clinical characteristics of the European Friedreich's Ataxia Consortium for Translational Studies (EFACTS) cohort: a cross-sectional analysis of baseline data. Lancet Neurol. 2015;14(2):174-182. doi: 10.1016/S1474-4422(14)70321-7. [DOI] [PubMed] [Google Scholar]
- 6.Reetz K, Dogan I, Hilgers RD, et al. , EFACTS study group. Progression characteristics of the European Friedreich's ataxia consortium for translational studies (EFACTS): a 4-year cohort study. Lancet Neurol. 2021;20(5):362-372. doi: 10.1016/S1474-4422(21)00027-2. [DOI] [PubMed] [Google Scholar]
- 7.Pandolfo M. Neurologic outcomes in Friedreich ataxia: study of a single-site cohort. Neurol Genet. 2020;6(3):e415. doi: 10.1212/NXG.0000000000000415. [DOI] [PMC free article] [PubMed] [Google Scholar]
- 8.Rummey C, Flynn JM, Corben LA, et al. Scoliosis in Friedreich's ataxia: longitudinal characterization in a large heterogeneous cohort. Ann Clin Transl Neurol. 2021;8(6):1239-1250. doi: 10.1002/acn3.51352. [DOI] [PMC free article] [PubMed] [Google Scholar]
- 9.Tamaroff J, McCormack S. Friedreich's ataxia related diabetes: epidemiology and management practices. Diabetes Res Clin Pract. 2022;186:109828. doi: 10.1016/j.diabres.2022.109828. [DOI] [PMC free article] [PubMed] [Google Scholar]
- 10.Lecocq C, Charles P, Azulay JP, et al. Delayed-onset Friedreich's ataxia revisited: the delayed-onset Friedreich's ataxia revisited. Mov Disord. 2016;31(1):62-69. doi: 10.1002/mds.26382. [DOI] [PubMed] [Google Scholar]
- 11.Koeppen AH. Friedreich's ataxia: pathology, pathogenesis, and molecular genetics. J Neurol Sci. 2011;303(1-2):1-12. doi: 10.1016/j.jns.2011.01.010. [DOI] [PMC free article] [PubMed] [Google Scholar]
- 12.Bhidayasiri R, Perlman SL, Pulst SM, Geschwind DH. Late-onset Friedreich ataxia: phenotypic analysis, magnetic resonance imaging findings, and review of the literature. Arch Neurol. 2005;62(12):1865-1869. doi: 10.1001/archneur.62.12.1865. [DOI] [PubMed] [Google Scholar]
- 13.Martinez ARM, Moro A, Abrahao A, et al. Nonneurological involvement in late-onset Friedreich ataxia (LOFA): exploring the phenotypes. Cerebellum. 2017;16(1):253-256. doi: 10.1007/s12311-015-0755-8. [DOI] [PubMed] [Google Scholar]
- 14.Fearon C, Lonergan R, Ferguson D, et al. Very-late-onset Friedreich's ataxia: diagnosis in a kindred with late-onset cerebellar ataxia. Pract Neurol. 2020;20(1):55-58. doi: 10.1136/practneurol-2019-002368. [DOI] [PubMed] [Google Scholar]
- 15.Schmitz-Hübsch T, du Montcel ST, Baliko L, et al. Scale for the assessment and rating of ataxia: development of a new clinical scale. Neurology. 2006;66(11):1717-1720. doi: 10.1212/01.wnl.0000219042.60538.92. [DOI] [PubMed] [Google Scholar]
- 16.Rummey C, Corben LA, Delatycki MB, et al. Psychometric properties of the Friedreich ataxia rating scale. Neurol Genet. 2019;5(6):371. doi: 10.1212/NXG.0000000000000371. [DOI] [PMC free article] [PubMed] [Google Scholar]
- 17.Patel M, Isaacs CJ, Seyer L, et al. Progression of Friedreich ataxia: quantitative characterization over 5 years. Ann Clin Transl Neurol. 2016;3(9):684-694. doi: 10.1002/acn3.332. [DOI] [PMC free article] [PubMed] [Google Scholar]
- 18.Rummey C, Farmer JM, Lynch DR. Predictors of loss of ambulation in Friedreich's ataxia. EClinicalMedicine. 2020;18:100213. doi: 10.1016/j.eclinm.2019.11.006. [DOI] [PMC free article] [PubMed] [Google Scholar]
- 19.Tai G, Corben LA, Gurrin L, et al. A study of up to 12 years of follow-up of Friedreich ataxia utilising four measurement tools. J Neurol Neurosurg Psychiatry. 2015;86(6):660-666. doi: 10.1136/jnnp-2014-308022. [DOI] [PubMed] [Google Scholar]
- 20.Tai G, Yiu EM, Delatycki MB, Corben LA. How does performance of the Friedreich Ataxia Functional Composite compare to rating scales? J Neurol. 2017;264(8):1768-1776. doi: 10.1007/s00415-017-8566-0. [DOI] [PubMed] [Google Scholar]
- 21.Subramony SH, May W, Lynch D, et al. , Cooperative Ataxia Group. Measuring Friedreich ataxia: interrater reliability of a neurologic rating scale. Neurology. 2005;64(7):1261-1262. doi: 10.1212/01.WNL.0000156802.15466.79. [DOI] [PubMed] [Google Scholar]
- 22.Lynch DR, Farmer JM, Tsou AY, et al. Measuring Friedreich ataxia: complementary features of examination and performance measures. Neurology. 2006;66(11):1711-1716. doi: 10.1212/01.wnl.0000218155.46739.90. [DOI] [PubMed] [Google Scholar]
- 23.Lynch DR, Perlman SL, Meier T. A phase 3, double-blind, placebo-controlled trial of idebenone in Friedreich ataxia. Arch Neurol. 2010;67(8):941-947. doi: 10.1001/archneurol.2010.168. [DOI] [PubMed] [Google Scholar]
- 24.Lynch DR, Hauser L, McCormick A, et al. Randomized, double-blind, placebo-controlled study of interferon- γ 1b in Friedreich Ataxia. Ann Clin Transl Neurol. 2019;6(3):546-553. doi: 10.1002/acn3.731. [DOI] [PMC free article] [PubMed] [Google Scholar]
- 25.Lynch DR, Chin MP, Delatycki MB, et al. Safety and efficacy of omaveloxolone in friedreich ataxia (MOXIe study). Ann Neurol. 2021;89(2):212-225. doi: 10.1002/ana.25934. [DOI] [PMC free article] [PubMed] [Google Scholar]
- 26.Bates D, Mächler M, Bolker B, Walker S. Fitting linear mixed-effects models using lme4. J Stat Softw. 2015;67(1):1-48. doi: 10.18637/jss.v067.i01. [DOI] [Google Scholar]
- 27.Lazaropoulos M, Dong Y, Clark E, et al. Frataxin levels in peripheral tissue in Friedreich ataxia. Ann Clin Transl Neurol. 2015;2(8):831-842. doi: 10.1002/acn3.225. [DOI] [PMC free article] [PubMed] [Google Scholar]
- 28.Clark E, Butler JS, Isaacs CJ, Napierala M, Lynch DR. Selected missense mutations impair frataxin processing in Friedreich ataxia. Ann Clin Transl Neurol. 2017;4(8):575-584. doi: 10.1002/acn3.433. [DOI] [PMC free article] [PubMed] [Google Scholar]
- 29.Davies EJ. Developmental aspects of schizophrenia and related disorders: possible implications for treatment strategies. Adv Psychiatr Treat. 2007;13(5):384-391. doi: 10.1192/apt.bp.106.002600. [DOI] [Google Scholar]
- 30.Schwamborn JC. Is Parkinson's disease a neurodevelopmental disorder and will brain organoids help us to understand it? Stem Cell Dev. 2018;27(14):968-975. doi: 10.1089/scd.2017.0289. [DOI] [PubMed] [Google Scholar]
- 31.Selvadurai LP, Harding IH, Corben LA, Georgiou-Karistianis N. Cerebral abnormalities in Friedreich ataxia: a review. Neurosci Biobehav Rev. 2018;84:394-406. doi: 10.1016/j.neubiorev.2017.08.006. [DOI] [PubMed] [Google Scholar]
- 32.Lawerman TF, Brandsma R, Burger H, Burgerhof JGM, Sival DA, The Childhood Ataxia and Cerebellar Group of the European Pediatric Neurology Society. Age-related reference values for the pediatric Scale for Assessment and Rating of Ataxia: a multicentre study. Dev Med Child Neurol. 2017;59(10):1077-1082. doi: 10.1111/dmcn.13507. [DOI] [PubMed] [Google Scholar]
- 33.Meier T, Perlman SL, Rummey C, Coppard NJ, Lynch DR. Assessment of neurological efficacy of idebenone in pediatric patients with Friedreich's ataxia: data from a 6-month controlled study followed by a 12-month open-label extension study. J Neurol. 2012;259(2):284-291. doi: 10.1007/s00415-011-6174-y. [DOI] [PubMed] [Google Scholar]
- 34.Milne SC, Kim SH, Murphy A, et al. The responsiveness of gait and balance outcomes to disease progression in friedreich ataxia. Cerebellum. 2021;2. doi: 10.1007/s12311-021-01348-2. [DOI] [PubMed] [Google Scholar]
Associated Data
This section collects any data citations, data availability statements, or supplementary materials included in this article.
Data Availability Statement
The FACOMS, including relevant study information is part of the Friedreich Ataxia Integrated Clinical Database, available on appropriate request at The Data Collaboration Center of the Critical Path Institute.