

Abstract
Background and Objectives
Most studies of health-related quality of life (HRQoL) in multiple sclerosis (MS) have been cross-sectional. The few longitudinal studies have not accounted for potential heterogeneity in HRQOL trajectories. There may be groups of individuals with common physical or mental HRQoL trajectories over time. Identification of early risk factors for membership in trajectories with poor HRQoL would inform on those at risk. We aimed to identify physical and mental HRQoL trajectories among people with MS and early risk factors for membership in the trajectory groups with the worst HRQoL.
Methods
Between 2004 and 2020, we queried NARCOMS participants regarding HRQoL using the RAND-12, demographics, fatigue, and physical impairments (using the Patient-Determined Disease Steps scale). We included participants who were enrolled in the NARCOMS registry within 3 years of MS diagnosis, lived in the United States, reported physician-confirmed MS, and had ≥3 HRQoL observations. We used group-based trajectory modeling to determine whether there were distinct clusters of individuals who followed similar HRQoL trajectories over time. We evaluated whether baseline participant characteristics associated with the probability of trajectory group membership using a multinomial logit model.
Results
We included 4,888 participants who completed 57,564 HRQoL questionnaires between 1 and 27 years after MS diagnosis. Participants had a mean (SD) age of 41.7 (9.5) years at diagnosis, and 3,978 participants (81%) were women. We identified 5 distinct physical HRQoL trajectories and 4 distinct mental HRQoL trajectories. Older age at diagnosis, worse physical impairments, and worse fatigue were associated with an increased odds of being in the group with the worst physical HRQoL when compared with being in the other 4 groups. Income ≤$50,000 and no postsecondary education were associated with an increased odds of membership in the group with the lowest mental HRQoL when compared with that in the other 3 groups.
Discussion
We identified groups of people with MS who reported similar physical and mental HRQoL trajectories over time. There are early risk factors for membership in the groups with the worst HRQoL that are easily identifiable by clinicians, providing an opportunity for early interventions.
Multiple sclerosis (MS) is a chronic immune-mediated inflammatory disease with heterogeneous outcomes. People with MS report lower health-related quality of life (HRQoL) when compared with individuals in the general population or those living with other chronic diseases.1-3 Most studies of HRQoL in MS have been cross-sectional. The few longitudinal studies have focused on population average changes in HRQoL over time and have not accounted for potential heterogeneity in the evolution of HRQoL within the MS population. In this study, we call the evolution of HRQoL over time a trajectory.4
Group-based trajectory modeling (GBTM) uses finite mixture modeling to identify subgroups of people within a population with similar changes in a phenomenon over time.4 GBTM differs from linear regression, which assumes a single underlying population with a single average probability trajectory and an associated set of variance parameters measuring the population variability about a single mean trajectory.5 Therefore, GBTM is particularly valuable when modeling outcomes in diseases with heterogeneous outcomes, such as MS, where subpopulations with different behaviors may exist. Previous studies among people experiencing other chronic disorders have used GBTM to identify distinct HRQoL trajectories and factors associated with membership in those trajectories. A study of 817 prostate cancer survivors identified 3 physical HRQoL and 3 mental HRQoL trajectories.6 Comorbidity was associated with membership in those trajectories. Three HRQoL trajectories were identified among 213 people with early rheumatoid arthritis.7 Gender was associated with trajectory membership. Five HRQoL trajectories were identified among 452 people with axial spondyloarthritis.8 Sex, age, and disease duration were associated with trajectory membership.
In cross-sectional studies, HRQoL in MS is adversely influenced by physical impairments, fatigue, and comorbidities.9-12 It is not known whether assessment of these factors early in the disease course can predict long-term trajectories of HRQOL. However, identification of individuals at risk for poor outcomes early in their disease may allow clinicians to target clinical and pharmacologic interventions more effectively.
Using GBTM, we aimed to identify physical and mental HRQoL trajectories among people with MS and early risk factors for membership in the trajectory groups with the worst HRQoL. We hypothesized that there would be distinct physical and mental HRQoL trajectory groups and membership in the groups with the worst HRQoL would be associated with greater physical impairments and fatigue at diagnosis.
Methods
Study Population
The North American Research Committee on Multiple Sclerosis (NARCOMS) registry is a self-report registry for individuals with MS that has collected demographic and clinical information since 1996. Information is collected at enrollment and updated semiannually thereafter. Extensive efforts have validated diagnoses of MS and outcomes used.13-16
Standard Protocols, Approvals, and Consents
Participants permit use of their deidentified information for research purposes. During analysis, the NARCOMS registry was approved by the Institutional Review Board of Washington University at St. Louis.
We included participants in this study who were enrolled in the NARCOMS Registry within 3 years of MS diagnosis, lived in the United States, reported physician-confirmed MS, and reported HRQoL at ≥3 time points. Restricting this analysis to participants who were enrolled in the NARCOMS Registry within 3 years of MS diagnosis enabled us to create a virtual inception cohort, reflecting the common clinical situation when people with MS first engage in MS-specific care and may be evaluated for risk factors for membership in poor HRQoL trajectories. Most participants in the NARCOMS Registry reside in the United States; inclusion in this analysis was restricted to US inhabitants because HRQoL varies between countries and we did not have enough participants from non-US countries to account for between-country heterogeneity. At least 3 HRQoL observations were needed to ascertain nonlinear trajectories (e.g., 3 observations needed for quadratic trajectories).
Demographic and Clinical Characteristics
At enrollment in the NARCOMS registry, participants reported sex, date of birth, race, education, income, year of MS diagnosis, age at MS diagnosis, year of MS symptom onset, Patient-Determined Disease Steps (PDDS), MS disease course, fatigue, and comorbidities. Information on race was collected because it is a social determinant of health associated with outcomes among people with MS.17 The PDDS is a single-item measure of disability with response options ranging from 0 (normal) to 8 (bedridden). It correlates highly with the physician-scored Expanded Disability Status Scale score.18 Participants reported fatigue using the Performance Scales©; the fatigue domain was assessed using a single-item measure with responses ranging from 0 (normal) to 5 (total fatigue).16,19 Diagnostic lag was calculated as the difference in years between the reported age at MS diagnosis and the age at MS symptom onset. Participants reported HRQoL using the RAND-12. Duration of RAND-12 observation was calculated as the difference in years between the first and last RAND-12 observations. Comorbidities were queried at enrollment, and updates as of 2006, using the following question format: “Has a doctor ever told you that you have…?”20-23 Participants indicated the presence or absence of comorbidities and, if present, the year of diagnosis. Queried comorbidities varied from update to update. Overall, these included blood disorders, cancer, hypercholesterolemia, diabetes, epilepsy, gastrointestinal disorders, cardiac disorders including valvular disease, HIV, kidney disorders, mental health disorders, migraine, musculoskeletal disorders, skin disorders, sleep disorders, thyroid and parathyroid disorders, and visual disorders. Participants were also asked to specify diagnoses conferred to them that were not queried; chronic disorders known to negatively affect HRQoL were included (e.g., endometriosis and Parkinson disease).24,25 We excluded disorders that were signs or symptoms of MS. Participants were categorized as experiencing any mental health comorbidity if they reported the presence of any of the following mental health disorders: anxiety, depression, bipolar disorder, psychosis, posttraumatic stress disorder, schizophrenia, anorexia, or bulimia. Participants were categorized as experiencing any physical comorbidity if they reported the presence of any comorbidity that was not a mental health disorder.
Health‐Related Quality of Life
HRQoL was queried in select updates between 2004 and 2020 using the RAND-12, which is a validated measure of health status, known to be responsive to changes in disability and employment status in MS populations.26-29 The RAND-12 captures the following 8 concepts: physical functioning, role limitations due to physical health problems, bodily pain, general health, vitality (energy and fatigue), social functioning, role limitations due to emotional problems, and mental health (psychological distress and psychological well-being). The RAND-12 can be scored to produce 2 aggregate scores: one that summarizes physical HRQoL (physical component score, PCS-12) and a separate aggregate score that summarizes mental HRQoL (mental component score, MCS-12). Alternatively, the RAND-12 can be scored to produce 8 subscale scores for each of the concepts evaluated. The aggregate and subscale scores all range from 0 to 100 with higher scores indicating better HRQoL. Each score has a mean of 50 and SD of 10.
Analysis
We summarized characteristics of the study population using the mean (SD), median (interquartile range), and frequency (percentage) values. We performed bivariate analyses between the first physical and mental HRQoL observations of participants and individual characteristics included in the multivariable models described in this study.
We identified 2 sets of trajectories using group-based trajectory modeling (GBTM): one set for physical HRQoL and a second set for mental HRQoL.4 We assumed a normal distribution censored at zero to accommodate the continuous outcomes (PCS-12 and MCS-12). We evaluated multiple models with varying numbers of groups and trajectory shapes (polynomial orders).4 Participants with missing data were included, but only available data were used. The preferred models were chosen based on a combination of the Bayesian information criterion (BIC) index of model fit, Akaike Information Criterion, parsimony, theoretical justification, research questions, and clinical interpretability.4,30 Meaningful differences in the BIC were evaluated using the Bayes factor. Trajectory model fit was evaluated using the average posterior probability, odds of correct classification, and the CIs around estimated group membership probabilities. An average posterior probability ≥0.7 (with 1 being no ambiguity in group assignment) was considered a good fit. Each participant was assigned to the group to which they had the highest probability of membership. We presented the summary statistics that profile the characteristics of individuals following each of the identified physical and mental HRQoL trajectories. We reported the number and percentage of participants who are in the lowest physical and lowest mental HRQoL trajectory groups. We also reported the number and percentage of participants who were in the highest physical and highest mental HRQoL trajectory groups. As a complementary analysis, we generated unadjusted trajectories for the 8 RAND-12 subscales.
To identify risk factors for membership in the trajectory groups with the lowest mental or physical HRQoL, we evaluated the association of baseline participant characteristics with the probability of group membership using a multinomial logit model. Modeling the probability of trajectory group membership accounts for uncertainty in group membership. This modeling extension is incorporated into the trajectory estimation and allows for simultaneous estimation of the parameters determining trajectory shapes and the multinomial logit parameters that predict probabilities of trajectory group membership as a function of individual-level covariates. We report the coefficient estimates of the parameters of the multinomial logit function. The coefficients were estimated jointly with the parameter estimates of the trajectories.
We evaluated the following baseline characteristics: female sex (male sex as reference group, binary), age at MS diagnosis (years, continuous), diagnostic lag (years, continuous), year of MS diagnosis (years, continuous), progressive disease course (relapsing-remitting disease course as the reference group, binary), PDDS (ordinal), White race (non-White race as reference group, binary), education > high school diploma or General Educational Development Test (education ≤ high school diploma or General Educational Development Test reference group, binary), income >$50,000 annually (income ≤$50,000 annually reference group, binary), the presence of any physical comorbidity (no physical comorbidity as the reference group, binary), and the presence of any mental comorbidity (no mental comorbidity as the reference group, binary). Race was evaluated as White vs non-White because this was the only configuration that would allow our model to converge because of small cell sizes. We also adjusted for baseline fatigue (ordinal) in the model for membership in the physical HRQoL trajectory groups; we did not adjust for fatigue in the model for mental HRQoL because the mental HRQoL score (MCS-12) accounts for vitality (defined as energy and fatigue). Variable selection was informed by literature review and factors accessible to clinicians during initial encounter to inform on clinically relevant predictors of trajectory membership.
We used k-fold cross-validation (k = 5) to validate the stability of the latent classes identified in the GBTM.31 We reported the root-mean-squared errors (RMSEs, which measure the average prediction error for the model) as measures of model fit. Similar RMSEs among the model using the full data set and after cross-validation would indicate that performance of the model should perform consistently when applied to an external data set. Statistical analyses were conducted using Stata 17.0.32
Data Availability
The data sets generated and analyzed during this study are held by the NARCOMS registry (narcoms.org).
Results
Participants
After application of the inclusion criteria, 4,888 participants were eligible for the current analysis (Figure 1). Participants completed 57,564 HRQoL questionnaires within 27 years after MS diagnosis, with a mean (SD) of 12 (7) RAND-12 responses per participant over time. Half of the participants were older than 42 years during MS diagnosis, and most of the participants were women (Table 1).
Figure 1. Participant Disposition.
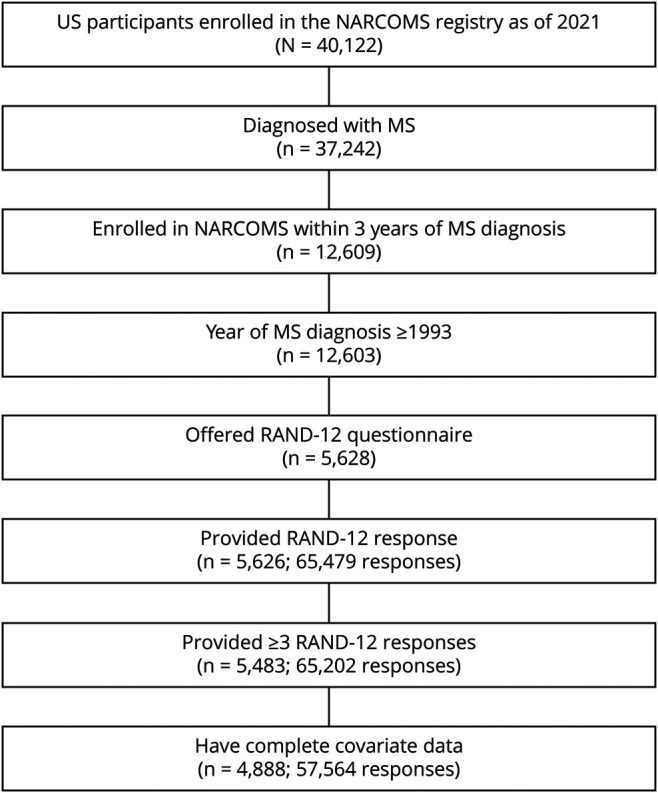
Table 1.
Baseline Participant Characteristics

Physical HRQoL Trajectories
We identified 5 distinct physical HRQoL trajectories (Figure 2). Group 1 (26.4%) reported consistently low and stable physical HRQoL; group 2 (29.2%) reported moderately low and stable physical HRQoL; group 3 (13.4%) reported moderate to low physical HRQoL within the first 10 years after diagnosis, followed by normal physical HRQoL thereafter; group 4 (17.1%) experienced an early decline in physical HRQoL within the first 8 years after diagnosis and an increase to moderate/normal HRQoL thereafter; and group 5 (13.9%) reported persistently normal physical HRQoL for the first 20 years after diagnosis and then a decline. The RMSE for the physical HRQoL model was 8.89.
Figure 2. Trajectories (95% confidence intervals) of Health-Related Quality of Life.

Characteristics Associated With Physical HRQoL Trajectories
On univariate logistic regression, several participant characteristics were associated with an increased odds of being in the group with the lowest physical HRQoL (group 1) when compared with being in all other groups, including older age at MS diagnosis, longer diagnostic lag, progressive disease course, worse physical impairments, worse fatigue, and annual income <$50,000 (Table 2). The group with the lowest physical HRQoL differed from all other groups regarding year of MS diagnosis; however, the direction of this relationship differed across groups. The group with the lowest HRQoL (group 1) had an earlier year of MS diagnosis when compared with the group with the persistently normal then late decline (group 5). Male sex and no postsecondary education were associated with an increased odds of being in the group with the lowest physical HRQoL (group 1) when compared with being in 3 of the 4 other groups (groups 3–5). The presence of any comorbid physical disorder was associated with an increased odds of being in the group with the lowest physical HRQoL (group 1) when compared with being in groups 2, 4, and 5. The presence of any comorbid mental disorder was associated with an increased odds of being in the group with the lowest physical HRQoL (group 1) when compared with being in groups 2, 3, and 5.
Table 2.
Physical Health Trajectory Group Descriptives

On multivariable logistic regression, older age at MS diagnosis, worse physical impairments, and worse fatigue were associated with an increased odds of being in the group with the lowest physical HRQoL (group 1) when compared with being in all other groups (Table 3). More recent year of MS diagnosis was associated with an increased odds of being in the group with the lowest physical HRQoL (group 1) when compared with being in 3 of the other groups (groups 2, 3, and 4) and a decreased odds of being in the group with persistently normal physical HRQoL, followed by a late decline (group 5). A longer diagnostic lag, annual income ≤$50,000, and the presence of a comorbid physical disorder were associated with an increased odds of being in the group with the lowest physical HRQoL (group 1) compared with being in all other groups. However, not all these associations were statistically significant. No postsecondary education was consistently associated with an increased odds of being in the group with the lowest physical HRQoL (group 1) when compared with being in 3 of the other groups, but this was statistically significant only for group 2. Similarly, male sex was associated with an increased odds of being in the group with the lowest physical HRQoL (group 1) when compared with being in all other groups, but this was only statistically significant for group 4. Race and disease course were not associated with group membership.
Table 3.
Multivariable Models of Physical HRQoL

Mental HRQoL Trajectories
We identified 4 distinct mental HRQoL trajectories (Figure 2A): group 1 (18.6%) reported chronically low mental HRQoL; group 2 (32.9%) reported moderately low and stable mental HRQoL; group 3 (22.2%) reported moderately low mental HRQoL within the first 10 years after diagnosis, followed by reports of normal mental HRQoL thereafter; and group 4 (26.4%) reported chronically normal mental HRQoL. The RMSE for the mental HRQoL model was 9.36.
Characteristics Associated With Mental HRQoL Trajectories
On univariate logistic regression, non-White race, annual income ≤$50,000, and the presence of any comorbid mental health disorder were associated with an increased odds of being in the group with the lowest mental HRQoL (group 1; Table 4) compared with being in the other 3 groups. Greater diagnostic delay, worse physical impairments, and no postsecondary education were associated with an increased odds of being in the group with the lowest mental HRQoL (group 1) compared with being in groups 3 and 4. More recent year of MS diagnosis was associated with an increased odds of being in the group with the lowest mental HRQoL (group 1) compared with being in groups 2 and 3. Younger age at MS diagnosis was associated with an increased odds of being in the group with the lowest mental HRQoL (group 1) compared with being in the group with chronically normal mental HRQoL (group 4). Sex, disease course, and the presence of any comorbid physical disorder were not associated with group membership.
Table 4.
Mental Health Trajectory Group Descriptives

On multivariable logistic regression, annual income ≤$50,000 and no postsecondary education were associated with an increased odds of membership in the group with the lowest mental HRQoL (group 1; Table 5) when compared with being in the 3 other groups. Younger age at MS diagnosis and non-White race were associated with an increased odds of membership in the group with the lowest mental HRQoL (group 1) compared with that in group 4. Worse physical impairments were associated with an increased odds of membership in the group with the lowest mental HRQoL (group 1) compared with that in groups 3 and 4. More recent year of MS diagnosis was associated with an increased odds of membership in the group with the lowest mental HRQoL (group 1) compared with that in groups 2 and 3. The presence of a mental comorbidity was associated with an increased odds of membership in the group with the lowest mental HRQoL (group 1) compared with that in groups 2 and 4. Sex, disease course, and the presence of any comorbid physical disorder were not associated with group membership.
Table 5.
Multivariable Model of Mental HRQoL

Overlap Between Physical and Mental HRQoL Trajectories
We did not observe a pattern of overlap between membership in the worst or best HRQoL physical and mental trajectories. Overall, 415 (8%) participants were members in both the worst physical HRQoL trajectory (group 1) and the worst mental HRQoL trajectory (group 1). By comparison, 388 (8%) participants were members in both the best physical HRQoL trajectory (group 5) and the best mental HRQoL trajectory (group 4).
Subscale Trajectories
In the complementary analysis of the unadjusted trajectories of the 8 RAND-12 subscales, we identified 5 distinct trajectories for the physical functioning, role limitations (physical), bodily pain, and general health subscales and 4 distinct trajectories for the vitality, role limitations (emotional), social functioning, and mental health subscales (eFigure 1, links.lww.com/WNL/C205). As shown, the general trajectory patterns of the former 4 subscales are overall similar to the 5 trajectories generated from the physical HRQoL aggregate score and the general trajectory patterns of the latter 4 subscales are overall similar to the 4 trajectories generated from the mental HRQoL aggregate score.
Cross-validation
We found a substantial overlap between the trajectories estimated using cross-validation and those estimated using our original data set, suggesting that the latent classes identified using our original data set are stable (eFigure 2, links.lww.com/WNL/C206). The RMSEs of the physical HRQoL model (8.98) and the mental HRQoL model (9.52) were similar to those reported for the initial model using the entire data set.
Discussion
Using a large virtual inception cohort of participants with MS residing in the United States, we investigated whether there were clusters of people who followed similar physical and mental HRQoL trajectories. We identified 5 clusters of participants who followed similar physical HRQoL trajectories and 4 clusters of participants who followed similar mental HRQoL trajectories for up to 27 years after MS diagnosis. Specifically, there were clusters of individuals with MS who had chronically low and stable physical HRQoL, moderately low but stable physical HRQoL, low physical HRQoL soon after MS diagnosis, followed by persistently normal physical HRQoL, an early decline in physical HRQoL, followed by a rebound to normal physical HRQoL, and persistently normal physical HRQoL, followed by a decline 20 years after MS diagnosis. Older age at diagnosis, worse physical impairments as measured using the PDDS, and worse fatigue within 3 years of diagnosis were associated with an increased odds of being in the group with the worst physical HRQoL trajectory when compared with being in the other 4 physical HRQoL trajectories. Regarding mental HRQoL, we observed individuals with chronically low mental HRQoL, moderately low and stable mental HRQoL, low mental HRQoL soon after MS diagnosis, followed by persistently normal mental HRQoL, and chronically normal mental HRQoL. Annual household incomes ≤$50,000 and no postsecondary education were associated with an increased odds of being in the group with the worst mental HRQoL when compared with being in the other 3 mental HRQoL trajectories (see eFigure 3, links.lww.com/WNL/C207 summary).
We identified distinct HRQoL trajectories among people with MS. The GBTM approach highlights the heterogeneity in the MS population and illustrates the importance of longitudinal data sets to delineate groups of people who follow similar trajectories. Our finding of different long-term HRQoL trajectories among people with MS may help to explain some of the discrepant findings reported among previous studies that have evaluated HRQoL trends among people with MS using a single average for the entire population. A study of 204 veterans with MS reported worsening in physical functioning over 3 years using the 36-Item Short-Form Health Survey for Veterans, but no change in mental health.33,34 A study of 288 people with MS found a decline in self-reported physical functioning over a 2-year period using the SF-36, but no change in the other domains of that instrument.35 A study of 3,779 people found that most of the participants reported stable HRQoL over a 5-year period, but that 40% of participants experienced clinically significant declines in their physical HRQoL and 36% experienced clinically significant declines in their mental HRQoL.10 A longitudinal phase 3 study of relapsing-remitting multiple sclerosis patients treated with interferon beta reported declines in physical and total scores on the Sickness Impact Profile questionnaire and no change in the psychosocial domain.36 The findings of some of these studies contrasted with ours possibly due to methodological differences in the study populations, instruments used, duration of observation (all 5 years or less), or analytic approaches. Traditional regression methods model the average outcome in the population and may fail to detect meaningful heterogeneity within the population, whereas we modeled heterogeneity explicitly. Our finding of distinct clusters of people with MS who report similar physical or mental HRQoL trajectories is consistent with previous studies that found distinct trajectories among people with MS for outcomes such as cost of illness, work productivity, disability progression, and healthcare use before nursing home entry.37-44 Collectively, this highlights the importance of accounting for heterogeneity when evaluating MS outcomes.
The factors that we identified as associated with membership in the trajectory groups with the worst HRQoL are consistent with findings from previous cross-sectional and longitudinal studies. People who are younger during MS diagnosis have better physical HRQoL, but worse mental HRQoL.9 Worse physical impairments and fatigue are associated with worse physical HRQoL.9,11 Less income and lower education are associated with worse mental HRQoL. The presence of comorbidities is associated with worse physical and mental HRQoL.10,12
Strengths of our study include the large sample size, long average duration of follow-up, emphasis on information accessible to clinicians, and use of a valid measure of HRQoL. Study limitations should also be considered. Participants in the NARCOMS registry were volunteers, which may limit the generalizability of our findings. Owing to small cell sizes, we were unable to evaluate whether there was a relationship between the number of comorbidities and trajectory group membership. Previous studies suggest that increasing number of comorbidities is associated with lower physical HRQoL. We were unable to differentiate the severity and relative importance of individual comorbidities on HRQoL. Previous studies suggest that some comorbidities such as headache and musculoskeletal disorders have a stronger association with HRQoL than others.45 We were unable to fully evaluate the relationship between race and HRQoL because of minimal variability in race among study participants. We did not account for changes in clinical status or health behaviors over time because we were specifically interested in identifying factors associated with long-term HRQOL outcome that are measurable at baseline that may prompt intervention. Future studies should examine the role of changes in disability, fatigue, health behaviors, comorbidity, and disease-modifying therapy on HRQoL trajectories. Future studies should also examine whether interventions targeted at supporting those with low socioeconomic status improve mental HRQoL among people with MS.
There are clusters of people with MS who follow similar physical and mental HRQoL trajectories over time. There are early risk factors for membership in the groups with the worst HRQoL that are easily identifiable by clinicians and potentially amenable to change, providing an opportunity for early targeted interventions for those at risk of poor long-term HRQoL. Risk factors for membership in the group with the lowest physical HRQoL, including greater physical impairments and greater fatigue, are often captured during routine neurologic examinations or through self-report assessments. Both physical impairments and fatigue are responsive to disease-modifying MS therapies, emphasizing the need for early initiation of treatments among those with these risk factors. The socioeconomic risk factors for membership in the group with the lowest mental HRQoL, including less education and income, may be easily identified using brief self-report assessments. Interventions that target social determinants of mental health have been shown to be effective at the individual, system (e.g., health, education), and macro (e.g., political, economic) levels.46 Income supplements have been associated with reductions in food insecurity, which is associated with worse mental health.47,48 Expansion of the Earned Income Tax Credit generated improvements in well-being among recipients, including decreased depression, increased happiness, and increased self-esteem.49 Greater access to green spaces around homes, schools, and workplaces is associated with fewer depressive symptoms.50 Previous studies have shown that supported education might be beneficial for young adults experiencing mental illness, although these benefits weaken with age.46
Acknowledgment
NARCOMS is a project of the Consortium of Multiple Sclerosis Centers (CMSC). NARCOMS is funded partly by the CMSC and the Foundation of the CMSC.
Glossary
- BIC
Bayesian information criterion
- GBTM
Group-based trajectory modeling
- HRQoL
health-related quality of life
- MS
Multiple sclerosis
- NARCOMS
North American Research Committee on Multiple Sclerosis
- PDDS
Patient-Determined Disease Steps
Appendix. Authors
Study Funding
This study was funded by Consortium of Multiple Sclerosis Centers (CMSC).
Disclosure
J. O'Mahony receives research funding from Multiple Sclerosis Society of Canada, Multiple Sclerosis Scientific Foundation, and CMSC; A. Salter receives research funding from Multiple Sclerosis Society of Canada, National Multiple Sclerosis Society, CMSC, and the US Department of Defense and is a member of editorial advisory board for Neurology. R.A. Marrie receives research funding from CIHR, Research Manitoba, Multiple Sclerosis Society of Canada, Multiple Sclerosis Scientific Foundation, Crohn's and Colitis Canada, National Multiple Sclerosis Society, CMSC, and the US Department of Defense and is a coinvestigator on studies receiving funding from Biogen Idec and Roche Canada. G.R. Cutter: data/safety monitoring committees for AMO, BioLineRx, BrainStorm Cell Therapeutics, Galmed, Horizon, Hisun, Merck, Merck/Pfizer, OPKO Biologics, Neurim, Novartis, Orphazyme, Sanofi, Reata, Receptos/Celgene, Teva, NHLBI (Protocol Review Committee), NICHD (OPRU oversight committee); consulting/advisory boards for Biogen, Click Therapeutics, Genzyme, Genentech, GW, Klein Buendel, MedImmune, MedDay, Novartis, Osmotica, Perception Neuroscience, Recursion, Roche, Somahlution, and TG Therapeutics. R.J. Fox has received personal consulting fees from AB Science, Biogen, Celgene, EMD Serono, Genentech, Genzyme, Immunic, Janssen, Novartis, Sanofi, and TG Therapeutics; has served on advisory committees for AB Science, Biogen, Genzyme, Immunic, Janssen, Novartis, Sanofi, and TG Therapeutics; and received clinical trial contract and research grant funding from Biogen, Novartis, and Sanofi. The other author reports no relevant disclosures. Go to Neurology.org/N for full disclosures.
References
- 1.Hermann BP, Vickrey B, Hays RD, et al. A comparison of health-related quality of life in patients with epilepsy, diabetes and multiple sclerosis. Epilepsy Res. 1996;25(2):113-118. [DOI] [PubMed] [Google Scholar]
- 2.Nortvedt MW, Riise T, Myhr KM, Nyland HI. Quality of life in multiple sclerosis: measuring the disease effects more broadly. Neurology. 1999;53(5):1098-1103. [DOI] [PubMed] [Google Scholar]
- 3.Rudick RA, Miller D, Clough JD, Gragg LA, Farmer RG. Quality of life in multiple sclerosis. Comparison with inflammatory bowel disease and rheumatoid arthritis. Arch Neurol. 1992;49(12):1237-1242. [DOI] [PubMed] [Google Scholar]
- 4.Nagin DS, Odgers CL. Group-based trajectory modeling in clinical research. Annu Rev Clin Psychol. 2010;6:109-138. [DOI] [PubMed] [Google Scholar]
- 5.Nagin DS. Group-Based Modeling of Development. Harvard University Press; 2005. [Google Scholar]
- 6.Farris MS, Kopciuk KA, Courneya KS, McGregor SE, Wang Q, Friedenreich CM. Identification and prediction of health-related quality of life trajectories after a prostate cancer diagnosis. Int J Cancer. 2017;140(7):1517-1527. [DOI] [PubMed] [Google Scholar]
- 7.Zou Y, Cheung PP, Teoh LK, Chen C, Lahrir M. Sociodemographic factors as determinants of disease, disability and quality of life trajectories in early rhematoid arthritis: a multi-ethnic inception cohort study. Int J Rheum Dis. 2021;23(1):55-64. [DOI] [PubMed] [Google Scholar]
- 8.Imkamp M, Lima Passos V, Boonen A, et al. Uncovering the heterogeneity of disease impact in axial spondyloarthritis: bivariate trajectories of disease activity and quality of life. RMD Open. 2018;4(2):e000755. [DOI] [PMC free article] [PubMed] [Google Scholar]
- 9.Wu N, Minden SL, Hoaglin DC, Hadden L, Frankel D. Quality of life in people with multiple sclerosis: data from the sonya slifka longitudinal multiple sclerosis study. J Health Hum Serv Adm. 2007;30(3):233-267. [PubMed] [Google Scholar]
- 10.Turpin KVL, Carroll LJ, Cassidy JD, Hader WJ. Deterioration in the health-related quality of life of persons with multiple sclerosis: the possible warning signs. Mult Scler. 2007;13(8):1038-1045. [DOI] [PubMed] [Google Scholar]
- 11.Janzen W, Turpin KVL, Warren SA, Marrie RA, Warren KG. Change in the health-related quality of life of multiple sclerosis patients over 5 years. Int J MS Care. 2013;15(1):46-53. [DOI] [PMC free article] [PubMed] [Google Scholar]
- 12.Berrigan LI, Fisk JD, Patten SB, et al. , CIHR Team in the Epidemiology and Impact of Comorbidity on Multiple Sclerosis ECoMS. Health-related quality of life in multiple sclerosis: direct and indirect effects of comorbidity. Neurology. 2016;86(15):1417-1424. [DOI] [PMC free article] [PubMed] [Google Scholar]
- 13.Horton M, Rudick RA, Hara-Cleaver C, Marrie RA. Validation of a self-report comorbidity questionnaire for multiple sclerosis. Neuroepidemiology. 2010;35(2):83-90. [DOI] [PubMed] [Google Scholar]
- 14.Marrie RA, Cutter G, Tyry T, Campagnolo D, Vollmer T. Validation of the NARCOMS registry: diagnosis. Mult Scler. 2007;13(6):770-775. [DOI] [PubMed] [Google Scholar]
- 15.Marrie RA, Goldman M. Validity of performance scales for disability assessment in multiple sclerosis. Mult Scler. 2007;13(9):1176-1182. [DOI] [PubMed] [Google Scholar]
- 16.Schwartz CE, Vollmer T, Lee H. Reliability and validity of two self-report measures of impairment and disability for MS. North American research Consortium on multiple sclerosis outcomes study group. Neurology. 1999;52(1):63-70. [DOI] [PubMed] [Google Scholar]
- 17.McKay KA, Jahanfar S, Duggan T, Tkachuk S, Tremlett H. Factors associated with onset, relapses or progression in multiple sclerosis: a systematic review. Neurotoxicology. 2017;61:189-212. [DOI] [PubMed] [Google Scholar]
- 18.Hohol MJ, Orav EJ, Weiner HL. Disease steps in multiple sclerosis: a simple approach to evaluate disease progression. Neurology. 1995;45(2):251-255. [DOI] [PubMed] [Google Scholar]
- 19.Marrie RA, Cutter G, Tyry T, Hadjimichael O, Campagnolo D, Vollmer T. Validation of the NARCOMS registry: fatigue assessment. Mult Scler. 2005;11(5):583-584. [DOI] [PubMed] [Google Scholar]
- 20.Salter A, Tyry T, Wang G, Fox RJ, Cutter G, Marrie RA. Examining the joint effect of disability, health behaviors, and comorbidity on mortality in MS. Neurol Clin Pract. 2016;6(5):397-408. [DOI] [PMC free article] [PubMed] [Google Scholar]
- 21.Marrie RA, Horwitz R, Cutter G, Tyry T, Campagnolo D, Vollmer T. Comorbidity delays diagnosis and increases disability at diagnosis in MS. Neurology. 2009;72(2):117-124. [DOI] [PMC free article] [PubMed] [Google Scholar]
- 22.Marrie RA, Horwitz R, Cutter G, Tyry T. Cumulative impact of comorbidity on quality of life in MS. Acta Neurol Scand. 2012;125(3):180-186. [DOI] [PMC free article] [PubMed] [Google Scholar]
- 23.Marrie RA, Rudick R, Horwitz R, et al. Vascular comorbidity is associated with more rapid disability progression in multiple sclerosis. Neurology. 2010;74(13):1041-1047. [DOI] [PMC free article] [PubMed] [Google Scholar]
- 24.Soliman AM, Singh S, Rahal Y, et al. Cross-sectional survey of the impact of endometriosis symptoms on health-related quality of life in Canadian women. J Obstet Gynaecol Can. 2020;42(11):1330-1338. [DOI] [PubMed] [Google Scholar]
- 25.Martinez-Martin P, Rodriguez-Blazquez C, Kurtis MM, Chaudhuri KR, NMSS Validation Group. The impact of non-motor symptoms on health-related quality of life of patients with Parkinson's disease. Mov Disord. 2011;26(3):399-406. [DOI] [PubMed] [Google Scholar]
- 26.Stewart AL, Ware JE. Measuring Functioning and Well-Being: The Medical Outcomes Study Approach: Duke University Press; 1992. [Google Scholar]
- 27.McHorney CA, Ware JE Jr., Raczek AE. The MOS 36-Item Short-Form Health Survey (SF-36): II. Psychometric and clinical tests of validity in measuring physical and mental health constructs. Med Care. 1993;31(3):247-263. [DOI] [PubMed] [Google Scholar]
- 28.Nortvedt MW, Riise T, Myhr KM, Nyland HI. Performance of the SF-36, SF-12, and RAND-36 summary scales in a multiple sclerosis population. Med Care. 2000;38(10):1022-1028. [DOI] [PubMed] [Google Scholar]
- 29.Marrie RA, Leung S, Cutter GR, Fox RJ, Salter A. Comparative responsiveness of the health utilities index and the RAND-12 for multiple sclerosis. Mult Scler. 2021;27(11):1781-1789. [DOI] [PubMed] [Google Scholar]
- 30.Raftery AE. Bayesian model selection in social research. Sociological Methodol. 1995. [Google Scholar]
- 31.Mosteller F, Tukey JW. Data Analysis, Including Statistics; 1968. [Google Scholar]
- 32.StataCorp. Stata Statistical Software: Release 17.0: StataCorp LLC. 2021. [Google Scholar]
- 33.Guarnaccia JB, Aslan M, O'Connor TZ, et al. Quality of life for veterans with multiple sclerosis on disease-modifying agents: relationship to disability. J Rehabil Res Dev. 2006;43(1):35-44. [DOI] [PubMed] [Google Scholar]
- 34.Kazis LE, Miller DR, Skinner KM, et al. Patient-reported measures of health: the veterans health study. J Ambul Care Manage. 2004;27(1):70-83. [DOI] [PubMed] [Google Scholar]
- 35.Hopman WM, Coo H, Pavlov A, et al. Multiple sclerosis: change in health-related quality of life over two years. Can J Neurol Sci. 2009;36(5):554-561. [DOI] [PubMed] [Google Scholar]
- 36.Miller DM, Rudick RA, Baier M, et al. Factors that predict health-related quality of life in patients with relapsing-remitting multiple sclerosis. Mult Scler. 2003;9(1):1-5. [DOI] [PubMed] [Google Scholar]
- 37.Bessing B, Hussain MA, Claflin SB, et al. Work productivity trajectories of Australians living with multiple sclerosis: a group-based modelling approach. Mult Scler Relat Disord. 2021;54:103131. [DOI] [PubMed] [Google Scholar]
- 38.Butepage G, Esawi A, Alexanderson K, et al. Cost-of-illness trajectories among people with multiple sclerosis by comorbidity: a register-based prospective study in Sweden. Mult Scler J Exp Transl Clin. 2020;6(4):2055217320968597. [DOI] [PMC free article] [PubMed] [Google Scholar]
- 39.Earla JR, Hutton GJ, Thornton JD, Chen H, Johnson ML, Aparasu RR. Comparative adherence trajectories of oral fingolimod and injectable disease modifying agents in multiple sclerosis. Patient Prefer Adherence. 2020;14:2187-2199. [DOI] [PMC free article] [PubMed] [Google Scholar]
- 40.Finlayson M, Ekuma O, Finlayson G, Jiang D, Marrie RA. Ten-year trajectories of health care utilization by Manitobans with MS predict nursing home entry. Neurol Clin Pract. 2019;9(1):16-23. [DOI] [PMC free article] [PubMed] [Google Scholar]
- 41.Hum S, Lapierre Y, Scott SC, Duquette P, Mayo NE. Trajectory of MS disease course for men and women over three eras. Mult Scler. 2017;23(4):534-545. [DOI] [PubMed] [Google Scholar]
- 42.Karampampa K, Gyllensten H, Yang F, et al. Healthcare, sickness absence, and disability pension cost trajectories in the first 5 Years after diagnosis with multiple sclerosis: a prospective register-based cohort study in Sweden. Pharmacoecon Open. 2020;4(1):91-103. [DOI] [PMC free article] [PubMed] [Google Scholar]
- 43.Mesidor M, Rousseau MC, Duquette P, Sylvestre MP. Classification and visualization of longitudinal patterns of medication dose: an application to interferon-beta-1a and amitriptyline in patients with multiple sclerosis. Pharmacoepidemiol Drug Saf. 2021;30(9):1214-1223. [DOI] [PubMed] [Google Scholar]
- 44.Ow N, Kuspinar A, Mayo NE, for MSOAC. Longitudinal analysis of disability outcomes among young people with MS. Mult Scler Relat Disord. 2021;52:102966. [DOI] [PubMed] [Google Scholar]
- 45.Fiest KM, Fisk JD, Patten SB, et al. , CIHR Team in the Epidemiology and Impact of Comorbidity on Multiple Sclerosis ECoMS. Fatigue and comorbidities in multiple sclerosis. Int J MS Care. 2016;18(2):96-104. [DOI] [PMC free article] [PubMed] [Google Scholar]
- 46.Alegria M, NeMoyer A, Falgas Bague I, Wang Y, Alvarez K. Social determinants of mental health: where we are and where we need to go. Curr Psychiatry Rep. 2018;20(11):95. [DOI] [PMC free article] [PubMed] [Google Scholar]
- 47.Li N, Dachner N, Tarasuk V. The impact of changes in social policies on household food insecurity in British Columbia, 2005-2012. Prev Med. 2016;93:151-158. [DOI] [PubMed] [Google Scholar]
- 48.Leung CW, Epel ES, Willett WC, Rimm EB, Laraia BA. Household food insecurity is positively associated with depression among low-income supplemental nutrition assistance program participants and income-eligible nonparticipants. J Nutr. 2015;145(3):622-627. [DOI] [PubMed] [Google Scholar]
- 49.Boyd-Swan C, Herbst C, Ifcher J, Zarghamee H. The earned income tax credit, mental health, and happiness. J Econ Behav Organ. 2016;126:18-38. [Google Scholar]
- 50.McEachan RRC, Prady SL, Smith G, et al. The association between green space and depressive symptoms in pregnant women: moderating roles of socioeconomic status and physical activity. J Epidemiol Community Health. 2016;70(3):253-259. [DOI] [PMC free article] [PubMed] [Google Scholar]
Associated Data
This section collects any data citations, data availability statements, or supplementary materials included in this article.
Data Availability Statement
The data sets generated and analyzed during this study are held by the NARCOMS registry (narcoms.org).