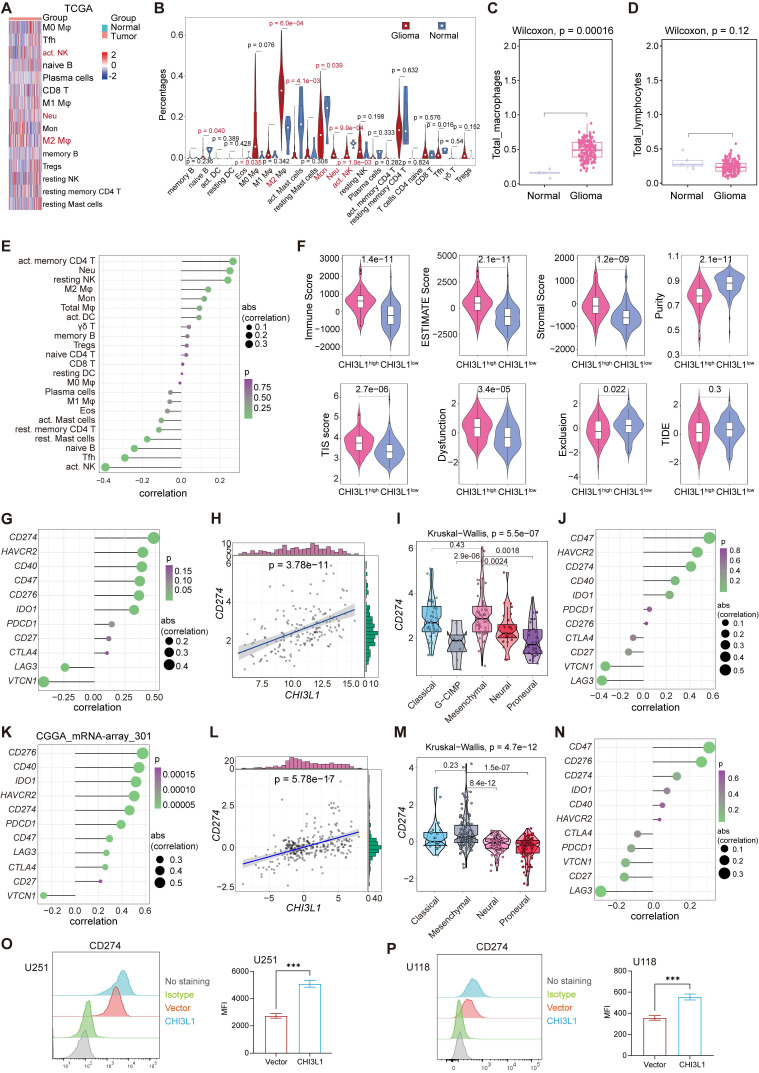
Figure 5.
CHI3L1 reprogrammed the TME to an immunosuppressive phenotype in glioma. (A-B) Heatmap and violin plot showed the immune cells infiltration in glioma in TCGA. (C-D) Total macrophages and lymphocytes comparison between normal and glioma tissues in TCGA, Wilcoxon test. (E) Spearman correlation analysis between the CHI3L1 expression and immune cells infiltration in TCGA. (F) The immune score, estimate score, stromal score, tumor purity, TIS score, dysfunction, exclusion and TIDE score between the CHI3L1high and CHI3L1low groups of patients with glioma in TCGA, Wilcoxon test. (G-J) Spearman correlation analysis between the expression of CHI3L1 and immune checkpoints in glioma, as well as in MES glioma in TCGA. (H)
tstudent (163) = 7.09, rPearson = 0.49, CI95% [0.36, 0.59], npairs = 165. loge (BF01) = -19.44,  = 0.48,
  = [0.37, 0.60],
  = 1.41. (K-N) Spearman correlation analysis between the expression of CHI3L1 and immune checkpoints in glioma, as well as in MES glioma in CGGA. (L)
tstudent (299) = 8.89, rPearson = 0.46, CI95% [0.36, 0.54], npairs = 301. loge (BF01) = -32.33,
  = 0.45,
  = [0.37, 0.54],
  = 1.41. (O-P) Flow cytometry analysis of the mean fluorescence intensity (MFI) of CD274 (PDL1) staining in U251 (O) and U118 (P) cells transfected with empty vector or CHI3L1 expression plasmid. act.: activated, Neu: neutrophils, Mφ: macrophages, Mon: monocytes, DC: dendritic cells, Tregs: regulatory T cells, Eos: eosinophils, rest.: resting, Tfh: T cells follicular helper.

