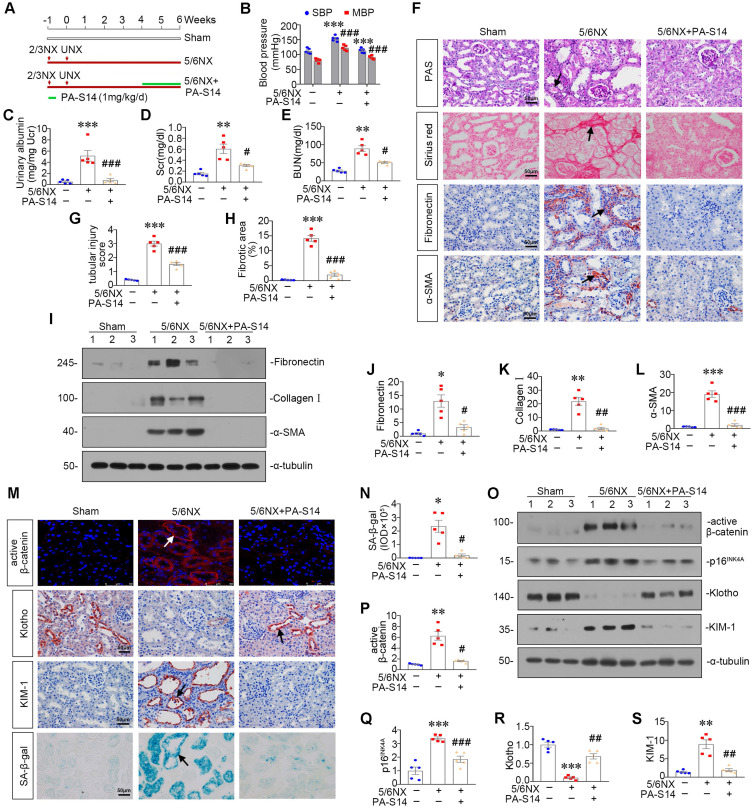
Figure 9.
PA-S14 attenuates renal fibrosis and tubular cell senescence in 5/6NX mice. (A) Diagram shows the experimental design. Red arrows indicate the surgical resection of left kidney and nephrectomy of right kidney. Green line indicates PA-S14 treatment (1.0 mg/kg body weight). (B) Tail-cuff blood pressure measurements show that PA-S14 normalizes systolic blood pressure (SBP) and mean blood pressure (MBP) in mice at 6 weeks after 5/6NX. (C) Urinary albumin levels in different groups at 6 weeks after 5/6NX. ***P < 0.001 versus sham mice; ###P < 0.001 versus 5/6NX mice (n = 5). (D-E) The treatment of PA-S14 significantly decreased serum creatinine and BUN levels. **P < 0.01 versus sham mice; #P < 0.05 versus 5/6NX mice (n = 5). (F) Representative micrographs show tubular injury and Collagen deposition in different groups as indicated. Paraffin sections were subjected to PAS staining and Sirius red staining, respectively. Representative micrographs showing renal expression of Fibronectin and α‐SMA in different groups. Arrows indicate positive staining. Scale bar, 50 µm. (G) Quantitative analysis of tubular injury in different groups as indicated. Kidney sections were subjected to PAS staining. At least 10 randomly selected fields were evaluated under 400× magnification and results were averaged for each animal. ***P < 0.001 versus sham mice; ###P < 0.001 versus 5/6NX mice (n = 5). (H) Graphical representations of the degree of kidney fibrotic lesions in different groups after quantitative determination of Sirius red staining intensity. ***P < 0.001 versus sham mice; ###P < 0.001 versus 5/6NX mice (n = 5). (I-L) Representative western blot and quantitative data show the reduction of renal Fibronectin, Collagen I and α‐SMA expression after PA-S14 treatment. Numbers (1-3) indicate each individual animal in given group. *P < 0.05, **P < 0.01, ***P < 0.001 versus sham mice; #P < 0.05, ##P < 0.01, ###P < 0.001 versus 5/6NX mice (n = 5). (M) Representative micrographs show the expression of active β-catenin, SA‐β‐gal activity, Klotho and KIM-1 in different groups as indicated. Frozen kidney sections were stained for active β-catenin and SA‐β‐gal activity. Paraffin sections were stained with antibodies against Klotho and KIM-1, respectively. Arrows indicate positive staining. Scale bar, 50 µm. (N) Quantitative determination of SA‐β‐gal activity staining in 5/6NX kidney. *P < 0.05 versus sham mice; #P < 0.05 versus 5/6NX mice (n = 5). (O-S) Representative western blot and quantitative data showing renal expression of active β-catenin, p16INK4A, Klotho and KIM-1. Numbers (1-3) indicate each individual animal in a given group. **P < 0.01, ***P < 0.001 versus sham mice; #P < 0.05, ##P < 0.01, ###P < 0.001 versus 5/6NX mice (n = 5).

