

Abstract
OBJECTIVE
To assess national trends in out-of-pocket (OOP) costs among adults aged 18–64 years with diabetes in the U.S.
RESEARCH DESIGN AND METHODS
Using data from the 2001–2017 Medical Expenditure Panel Survey, we estimated total per person annual OOP costs (insurance premiums, prescription drug costs, inpatient and outpatient deductibles, copays, and other payments not covered by insurance) and high OOP cost rate, defined as the percentage of people with OOP spending >10% of their family’s pretax income. We examined trends overall, by subgroup (insurance type, income level, insulin use, size of patient’s employer, and whether the patient was enrolled in a high deductible health plan), and by type of service. Changes in trends were identified using joinpoint analysis; costs were adjusted to 2017 U.S. dollars.
RESULTS
From 2001 to 2017, OOP costs decreased 4.3%, from $4,328 to $4,139, and the high OOP cost rate fell 32%, from 28 to 19% (P < 0.001). Changes in the high OOP cost rate varied by subgroup, declining among those with public or no insurance and those with an income <200% of the federal poverty level (P < 0.001) but remaining stable among those with private insurance and higher income. Drug prescription OOP costs decreased among all subgroups (P < 0.001). Decreases in total (−$58 vs. −$37, P < 0.001) and prescription (−$79 vs. −$68, P < 0.001) OOP costs were higher among insulin users than noninsulin users.
CONCLUSIONS
OOP costs among U.S. nonelderly adults with diabetes declined, especially among those least able to afford them. Future studies may explore factors contributing to the decline in OOP costs and the impact on the quality of diabetes care and complication rates.
During 2010–2012, 25% of nonelderly U.S. adults reported that they had difficulty paying medical bills (1). High out-of-pocket (OOP) costs are associated with underuse of necessary health care services and poor treatment adherence (2–4), including not visiting health care providers, a lower medication initiation rate, and skipping doses of necessary prescriptions (5), which could lead to negative health outcomes.
People with diabetes have a lower average income than those without diabetes (2,3) and are especially vulnerable to high OOP costs associated with managing diabetes and its complications (6,7). Direct medical costs of diabetes have increased by 240% during the past decade, especially the cost of medications; medication costs associated with glucose management in the United States increased from $16.9 billion to $57.6 billion (4). These increases and other costs of treating diabetes complications often lead to high OOP costs.
Recent changes in national health policy may have also impacted OOP costs for people with diabetes (1). Enacted in 2010, the Affordable Care Act (ACA) required people to purchase health insurance, allowed parents to cover their children through their private insurance until age 26 (8), expanded Medicaid coverage and provided subsidies to some low-income populations, and supported small businesses with tax credits for offering health care coverage (9). Many of these ACA policies were designed to ease the burden of health costs for individuals. Insurance coverage for nonelderly people with diabetes has increased substantially since its implementation (10). On the other hand, high-deductible health plans (HDHPs) have proliferated since ACA implementation (11,12). Previous studies reported larger OOP costs among those enrolled in HDHPs compared with those with low- or no-deductible plans (13–15). In addition, insulin plays a vital role in managing both type 1 and type 2 diabetes. The number of patients on insulin treatment has increased during the past decade, and a higher proportion of patients use the more expensive insulin analog rather than the cheaper human insulin (16, 17). Wide adoption of HDHPs and increased use of insulin analog may increase the OOP costs for people with diabetes.
Two previous studies examined OOP cost trends among nonelderly people with diabetes through 2011 (16,17). No national studies have examined how the burden of OOP costs have changed since that time, despite transformations in the health insurance market and increasing costs of some diabetes medications. We examine recent national trends of OOP costs among nonelderly U.S. adults with diabetes. We also examine disparities in these costs by subpopulations and trends in these disparities.
RESEARCH DESIGN AND METHODS
Data Source and Study Population
We used data from the 2001–2017 Medical Expenditure Panel Survey, Household Component (MEPS-HC). MEPS is a nationally representative household survey of the U.S. civilian noninstitutionalized population sponsored by the Agency for Healthcare Research and Quality (18). We identified people with diabetes by the question, “Have you ever been told by a doctor or other health professional that you had diabetes?” We limited our study to people with diabetes who were aged 18–64 years because those aged ≥65 have different health care needs, income levels, and insurance types (16). Our study sample includes a total of 22,649 adults aged 18 to 64 years with diabetes from 2001 to 2017 with an annual sample size of 959 to 1,557. Our study sample represents ~4.8 million nonelderly persons with diagnosed diabetes in 2017.
Outcome Variables
OOP Costs
We used the OOP amount paid by the family to represent the cost for persons with diabetes because members of families share resources and make collective decisions on health care needs. The family was defined according to the Current Population Survey (19). OOP costs were the total amount paid by the family for health care, including insurance premiums; patient share (deductibles, copays, coinsurance, and personal contributions from health savings accounts) of the payments for inpatient care, outpatient care, and prescription drugs partially covered by insurance; and payments not covered by insurance. Medicare Part B premiums for people aged 18–64 years are mostly paid by Medicaid or by disease-specific financial assistance programs, such as the Medicare End-Stage Renal Disease Program; therefore, these premiums were not included as OOP costs.
All costs were inflated to 2017 U.S. dollars by multiplying the ratio of the 2017 Consumer Price Index for all-urban consumers to the Consumer Price Index of the survey year (20). People with negative OOP costs or a value exceeding the family income were considered data errors and were excluded from the analysis.
High OOP Cost Rate
A person was considered to have high OOP costs if he or she lived in a family with annual OOP costs >10% of pretax family income. The rate of high OOP costs was the percentage of people with diabetes who had high OOP costs. We used pretax family income rather than disposable income because information on the amount paid in taxes was not available in MEPS; the choice of definition would not likely affect trends (21).
Subgroup Analysis
To pinpoint groups with increasing or decreasing OOP health care costs, we conducted subgroup analyses by type of health insurance, income level, and insulin use. For people with private health insurance, we also conducted subgroup analyses by the size of the patient’s employer and whether the patient was enrolled in an HDHP.
Insurance Type
We assigned three mutually exclusive insurance categories: uninsured, publicly insured, and privately insured. Uninsured were those who did not have insurance for any month of the survey year. Public insurance included Medicare, TRICARE, Medicaid, and other public hospital or physician coverage. If a person switched between public and private insurance, we used the insurance type they had for longest of the survey year.
Income Level
We defined four income categories based on federal poverty level (FPL), which combines household income and size: poor or near poor (<125% FPL), low income (125% to <200% FPL), middle income (200% to <400% FPL), and high income (≥400% FPL).
Insulin Use
The MEPS Diabetes Care Survey provided detailed treatment information, including insulin treatment (22). Those who reported not using insulin were treated with oral diabetes medications or lifestyle modification. Those who did not provide treatment information were excluded from this subgroup analysis but were included in other analyses.
Employer Size (Private Insurance Only)
Respondents covered by private insurance reported the number of employees at their worksite; we defined employer size as small (<50 employees) versus large (≥50 employees) (9). For those with more than one employer, we used the employer that provided their insurance for the longest period during the survey year. For unemployed respondents, employer size was determined by the working family member whose employer had the largest number of employees. Self-employed participants and unemployed participants without working family members were excluded from this subgroup analysis.
HDHPs (Private Insurance Only)
MEPS defines HDHPs based on the deduction threshold set by the Internal Revenue Service, determined annually based on the cost of living and whether the plan covers an individual or a family. In 2017, for example, this threshold was $1,300 minimum annual deductible and $6,550 maximum OOP for single-level coverage and twice that for family-level coverage (23). We considered a person to have an HDHP if they had an HDHP for any part of the survey year. Data on this variable are presented from 2011 to 2017; MEPS did not collect HDHP information before that time.
Statistical Analysis
To assess trends in OOP costs and the rate of high OOP costs during the study period, we first used joinpoint regression analysis to identify the year(s) in which there were significant trend changes (24). Joinpoint regression analysis is a statistical model to identify and describe the occurrence of changes in distinct periods in trend data by connecting several segments at “joinpoints.” (24) The regression model started with zero joinpoints (fitting a linear regression) and then examined whether adding one joinpoint at a time would significantly improve the fitness of the model (up to three joinpoints) (24). Monte Carlo permutation was used to test the significance of the trend change (24). After the joinpoints were identified, the magnitude and direction of trend changes were estimated as the annual percentage change.
Linear changes over the entire study period were examined by ordinary least squares regression. The annual change rate was reported by the slope of the regression. We used t tests to assess differences between levels in subgroup analysis for insulin use, employer size, and HDHPs. Joinpoint analysis was performed using Surveillance Epidemiology and End Results (SEER) statistical software (Joinpoint Trend Analysis Software, version 4.7.0.0); all other analyses were performed using SAS 9.4 software. To account for the complex sampling design of MEPS, SAS survey procedures and MEPS person-level weights were used to generate a representative U.S. civilian noninstitutionalized population. Because information on insulin use was obtained from the Diabetes Care Survey portion of MEPS, estimates for insulin versus noninsulin user groups incorporate MEPS Diabetes Care Weight to adjust for nonresponse. MEPS administered a Diabetes Care Survey (DCS) for patients who reported that they had been diagnosed with diabetes to examine their checkups, complications, and treatment status. Insulin use status was asked in a DCS section, and MEPS suggests that the Diabetes Care Weight should be used for questions in the DCS section to adjust for DCS nonresponses and MEPS person-weights to adjust the number of persons with diabetes in the U.S. civilian noninstitutionalized population. Differences were considered significant if P < 0.05.
Sensitivity Analysis
We conducted two one-way sensitivity analyses. In the first, we excluded patients covered by Medicare, because this group may have different health care needs than those not covered by Medicare. In the second, we excluded patients with more than one type of insurance to test more precisely the effect of insurance type.
RESULTS
Overall Population
Trends in total OOP and high OOP costs are shown in Fig. 1. Total OOP costs decreased significantly from 2001 to 2017 (−$35.7 per year on average; P = 0.009). By service types, OOP costs declined for prescriptions (−$50.9; P < 0.0001), increased for insurance premiums ($40.5; P < 0.0001), and did not change significantly for inpatient, outpatient, or other services (Fig. 2). From 2001 to 2017, the high OOP cost rate decreased by one-third, from 28 to 18% (Fig. 1); the linear trend test found a 0.6% annual decrease (P < 0001).
Figure 1—
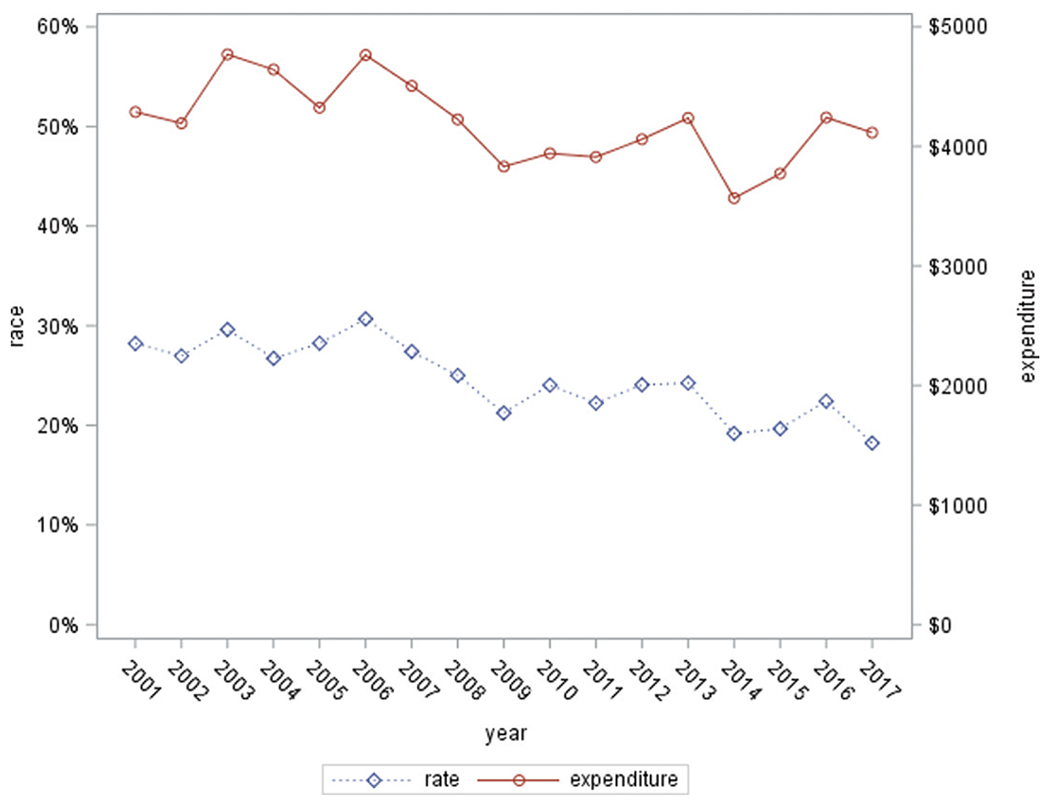
Total OOP costs and high OOP cost rate among U.S. adults with diagnosed diabetes, 2001–2017. High OOP cost rate: percentage of patients living in a family of OOP cost >10% of family income.
Figure 2—
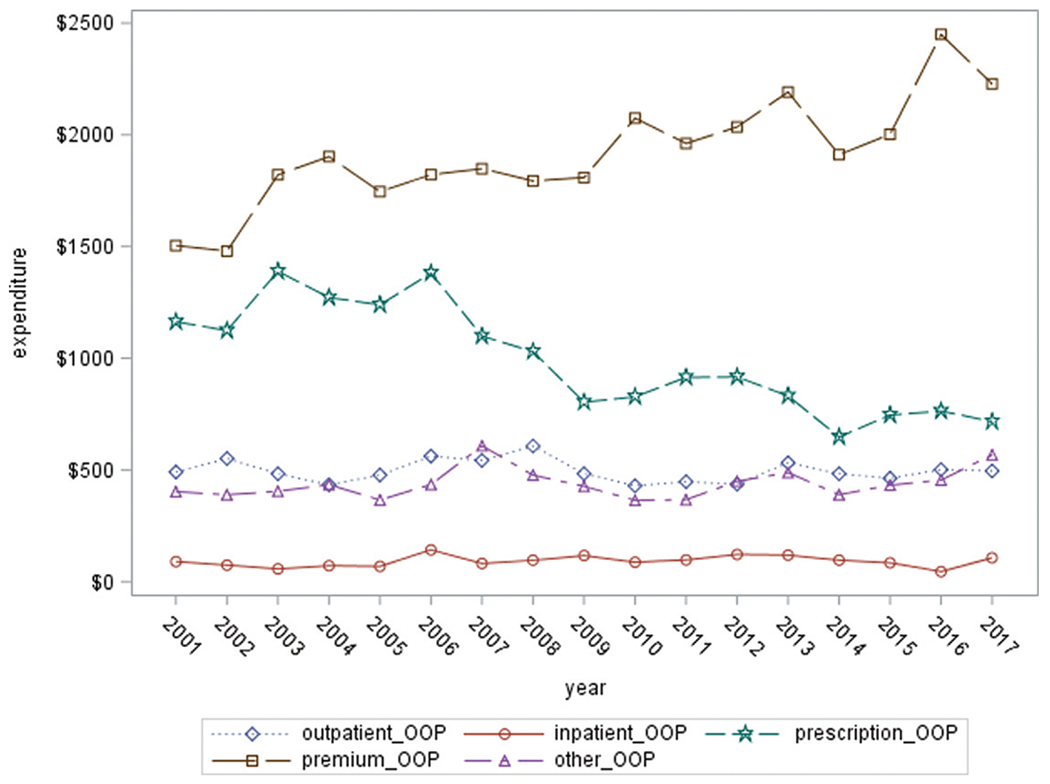
Trend in OOP costs among U.S. adults with diagnosed diabetes by services type, 2001–2017.
Joinpoint regression did not identify significant changes in overall trends of OOP costs in total or by service type or in the high OOP cost rate. Few joinpoints were identified in subgroup analyses described below; they were noted when found but not mentioned otherwise.
By Health Insurance Type
Linear trends in overall OOP costs varied by insurance type, decreasing among those with public insurance (−$104.3; P < 0.001) and no health insurance (−$93.8; P < 0.001) but increasing among those with private insurance ($49.9; P = 0.0002) (Supplementary Table 1).
By cost component, premiums increased among the privately insured ($92; P < 0.0001) and uninsured ($24; P < 0.0001), but there were no significant changes among those publicly insured. For prescription drug cost, two joinpoints were identified among those with private insurance, with costs increasing until 2006 and declining from 2006 to 2009; the decreasing trend after 2010 was not statistically significant. Linear trend tests found significant decreases in drug costs for all insurance types (P < 0.001 for each); the largest decrease was among those without health insurance (−$99, P < 0.001). For inpatient care, overall trends were not significant except for a decrease among patients with private insurance (−$11; P = 0.0024). For outpatient costs, two joinpoints were identified among those publicly insured, with decreases during 2001–2004 and 2008–2017 and increases during 2004–2008. Linear trend tests showed a decrease among patients with no insurance (−$19; P < 0.0001). There were no significant trend changes among those with private insurance.
Changes in the high OOP cost rate also varied by insurance type (Fig. 3), with decreases among those with public insurance (−0.017 per year; P < 0.0001) and no insurance (−0.012; P < 0.0001) but no significant changes among those with private insurance. Those with private insurance had the lowest high OOP cost rate in the early years but the largest from 2009 onward.
Figure 3—
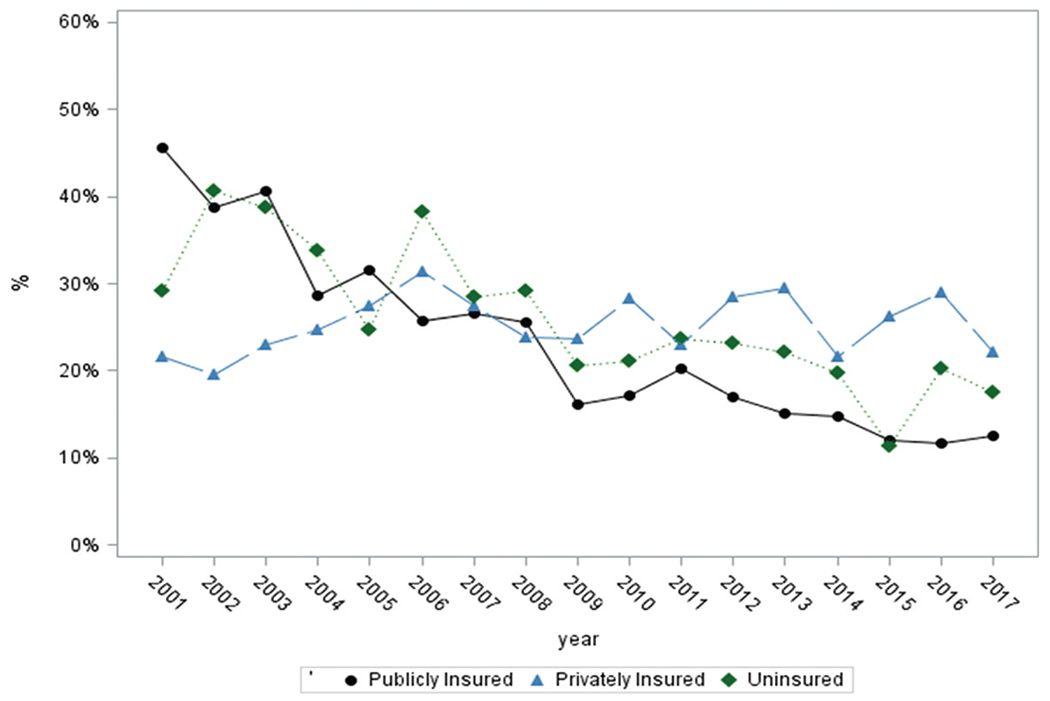
High OOP cost rate among U.S. adults with diagnosed diabetes, by insurance type, 2001–2017. High OOP cost rate: percentage of patients living in a family with OOP costs >10% of family income.
By Income Level
Linear trend analysis identified significant decreases in total OOP costs among the poor or near poor (−$109.5 per year, P < 0.001) and low-income group (−$114.5, P < 0.001) but no significant trend in the middle-income group. Total OOP costs increased significantly among those with high income ($48.0, P = 0.006). Details of OOP costs are shown in Supplementary Table 2.
In the low-income group, there was a 4.7% increase in premiums per year before 2010, followed by a statistically non-significant downward trend thereafter. Premiums increased significantly for the middle-income ($29; P = 0.0003) and high-income groups ($100; P < 0.0001) but declined for those poor or near poor (—$9; P = 0.0041) and with low income (−$1; P < 0.0001). Linear trend tests showed significant decreases in prescription drug costs for all income groups (P < 0.001 for each), with the largest decreases among low-income participants (−$108, P < 0.001). There were slight declines in inpatient costs among the poor or near poor (−$3; P = 0.0148) and those with low income (−$3; P < 0.0001). Trends were not significant in the middle-income or high-income groups.
High OOP cost rates decreased among the poor or near poor (−2.4%; P < 0.0001) and low-income groups (−1.1%; P < 0.0001). No significant trends were identified among middle-income or high-income participants (Fig. 4).
Figure 4—
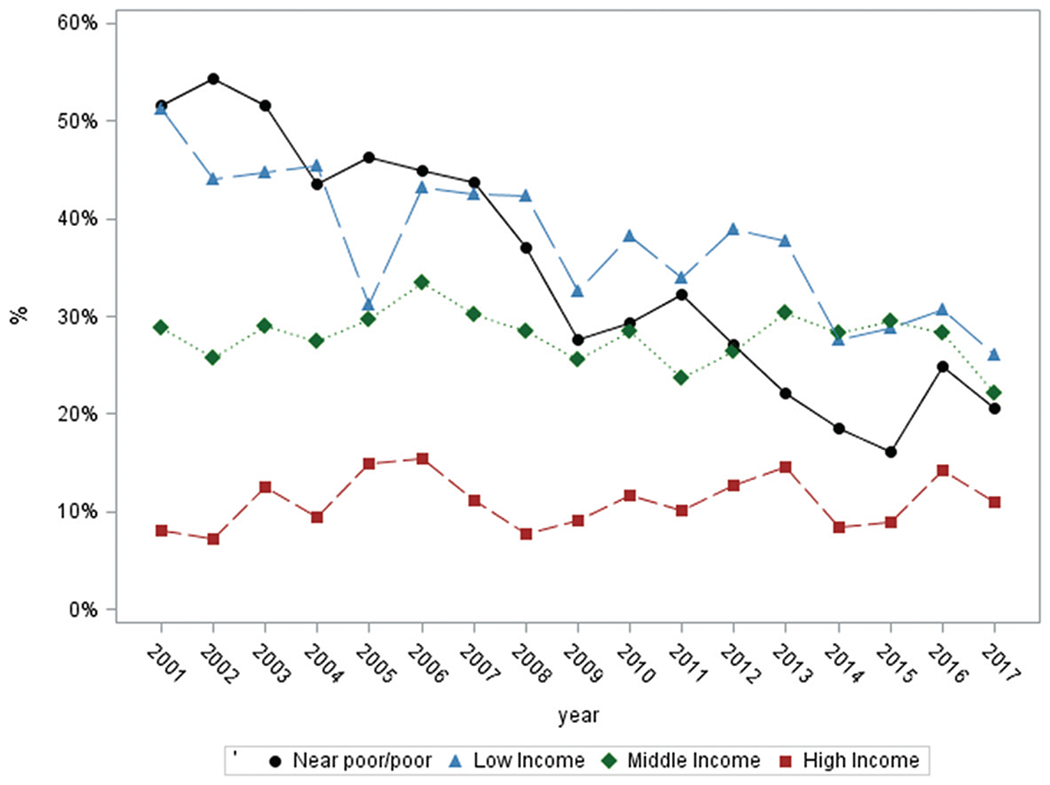
High OOP cost rate among U.S. adults with diagnosed diabetes, by income level, 2001–2017 High OOP cost rate: percentage of patients living in a family with OOP costs >10% of family income.
By Insulin Use
High OOP cost rates declined significantly in those who use insulin as well as those who do not (P < 0.001 for both), although the rate was significantly higher among persons who use insulin (P < 0.001). Total OOP costs and costs for prescription drugs for both groups decreased (total OOP costs: −$58 [P = 0.0052] for insulin users vs. −$37 [P = 0.0044] for noninsulin users; prescription drugs: −$79 vs. −$68, P < 0.001 for both), whereas premiums significantly increased for both ($26 vs. $43, P < 0.001 for both). The high OOP cost rate, total OOP costs, and prescription costs were higher in the insulin group than in the noninsulin group (Supplementary Fig. 3).
By Employer Size (Private Insurance Only)
Joinpoint analysis identified one increasing trend change for OOP costs on premiums (increasing after 2003) and one decreasing trend change for OOP costs on prescription drugs (declining after 2005) among those employed by small employers.
The high OOP cost rate was higher among participants covered by small employers from 2001 to 2015 but was not significantly different from those covered by large employers after 2015 (Supplementary Fig. 1). The rate declined significantly among patients covered by small employers across the study period (P < 0.0001) and did not change significantly among patients covered by large employers. Total OOP costs did not change significantly for the small employer group (−$37, P = 0.0514) and increased for the large employer group ($48, P = 0.0097). Premium costs increased among both groups, but the increase was much larger among those working for large employers ($86 [P < 0.0001] vs. $49 [P < 0.0001]). Prescription costs were higher among the small employer group before 2014 and were lower since 2015 compared with the large employer group.
By HDHP (Private Insurance, 2011–2017 Only)
The high OOP cost rate was significantly higher among those with HDHPs (P < 0.001) compared with those covered by traditional plans, with higher total OOP costs and higher costs in every service category except inpatient care in 2011 (P < 0.05 for each). No significant trends were identified (Supplementary Fig. 2).
Sensitivity Analyses
When people with Medicare insurance were excluded, the high OOP cost rate reduced by up to 3% each year. The trend in high OOP costs was not affected. By limiting private and public insurance coverage groups to those with full coverage through the year, the high OOP cost rate reduced slightly (within 1%) but trends did not change.
CONCLUSIONS
Changes in national health policy and the cost of diabetes care could affect the burden of OOP costs among nonelderly adults with diabetes. We found that the total OOP costs and the high OOP cost rate both declined, with no significant changes in these trends from 2001 through 2017. Trends varied by subgroup, with costs declining among both insulin and noninsulin users and generally declining among the most vulnerable: those with public insurance or no insurance and those with incomes less than twice the federal poverty level.
At the beginning of the study period, privately insured adults with diabetes were less likely than those publicly insured or uninsured to have a high OOP cost rate. Since then, the high OOP cost rate remained stable among those with private insurance, while decreasing among those with public insurance and no insurance. By 2017, those with private insurance were more likely to have high OOP costs than those with public insurance or those without insurance. A decrease in OOP costs among patients with public insurance or no insurance, who are more vulnerable to such costs, could lead to improved access to care and better health outcomes; for example, one study among cancer patients showed that decreases in OOP costs improved care (25). However, the decrease in OOP costs could also imply a decrease in health care use among this population. Future studies could explore how changes in the burden of OOP costs are related to access to care and health care utilization among people with diabetes.
A similar trend was seen by income level. In 2001, the poor or near poor and low-income groups were more likely to have high OOP cost rates than those with middle- and high-income levels, but by 2017, this disparity had decreased substantially. Implementation of ACA policies targeting the low-income population, especially Medicaid expansion, could have contributed to the decrease in OOP costs among the lower-income groups. Expansion to the Medicaid program was proposed to cover people with incomes <138% of FPL, but not all states opted to participate. For people with incomes 100–400% of FPL who are not eligible for Medicaid, the federal government provides tax credits under the ACA to subsidize health insurance premiums purchased on the health care marketplace (9).
Throughout most of the study period, those working for small employers were more likely to have high OOP costs than those working for large employers. However, by 2017 these high OOP cost rates had become equivalent. Implementation of the ACA may have contributed to the OOP costs decline among workers at small employers. Under the ACA, employers with ≥25 employees and average annual wages of <$50,000 were eligible for tax credits of up to 50% to help them afford the cost of health care premiums, while employers with fewer than 50 employees were offered with options to provide health plans through a Small Business Health Options Program Marketplace (9).
Although the cost of insulin has increased in recent years (19), OOP costs for prescription drugs among insulin users decreased during the study period, suggesting that other entities, such as insurers, insulin makers, or self-funded employers, may have borne the cost increase. Medicaid reimbursement for rapid-acting insulin analogs increased from $3.69 per unit in 1997 to $19.81 per unit in 2014 (26), and many insulin manufacturers have increased their rebate programs to insurers (27). In addition, patients who cannot afford high-cost insulin may be more likely to skip doses, which could lead to lower OOP costs (28). Although insulin users consistently had higher OOP costs than nonusers, the declines were substantial among both groups.
While the cost of diabetes medications has more than doubled during the past decade (4), we found that OOP costs for prescriptions decreased, suggesting that the increase in drug costs did not translate into higher OOP costs. Among patients with Medicaid, the decrease could be attributed to a series of cost-containment strategies (17, 29–32) that gave patients and providers incentives to purchase or prescribe less expensive drugs and to acquire drugs from manufacturers at a lower price. Medicaid beneficiaries showed high-price sensitivity, which incentivized them to use less expensive drugs when possible (33), and generic drug use among Medicaid beneficiaries has been increasing in recent years (31). The decrease in OOP costs in 2006 among those with private insurance could be partially due to indirect benefit from implementation of Medicare Part D, as suggested in previous studies (34,35). More drugs have become generic and more patients use generic drugs, which tend to have a lower cost and could also have contributed to the lower OOP cost among those with private insurance (34,35).
We found that premium costs increased substantially overall and specifically among privately insured, partially uninsured, middle-income, and high-income populations, consistent with a National Conference of State Legislatures report on annual premium changes (36). Private health insurance premiums have increased since 1999, growing at a faster rate before ACA than after (37). As premiums often reflect a lagged underlying health care cost trend, the continuous increase in premium costs could be a result of the introduction of new technologies and medications into the health care market as well as the rapid expansion of medical facilities, which may have contributed to increases in national health care costs (38). In addition, implementation of ACA could have contributed to this premium increase by incor-porating previously uninsured people with worse health status (39). Considering the decline in prescription drug cost, there might also be a substitution effect between cost of insurance premiums and other cost components, which future studies might explore.
This study has several limitations. First, MEPS only includes the civilian, noninstitutionalized population. Thus, our study results do not apply to the people with diabetes who are enlisted or living in nursing facilities or prisons. Diabetes was identified by self-report; however, self-reported diabetes has been shown to have 95% specificity compared with physician records (40). Third, OOP costs are affected by many factors, including health insurance policy, purchaser options, national and state health policies, and drug patent expiration. Future studies to examine how these factors contribute to trends in OOP costs may identify opportunities for potential intervention.
In conclusion, we found that OOP costs and high OOP cost rates among nonelderly adults with diabetes continued to decline from 2001 to 2017, especially among those least able to pay. Future studies may reveal whether these reductions in OOP costs have improved quality of diabetes care and have led to reductions in diabetes complications.
Supplementary Material
Acknowledgments
The findings and conclusions in this report are those of the authors and do not necessarily represent the official position of the Centers for Disease Control and Prevention.
Footnotes
This article contains supplementary material online at https://doi.org/10.2337/figshare.15108639.
Duality of Interest. No potential conflicts of interest relevant to this article were reported.
References
- 1.Richman IB, Brodie M. A national study of burdensome health care costs among non-elderly Americans. BMC Health Serv Res 2014;14:435. [DOI] [PMC free article] [PubMed] [Google Scholar]
- 2.Rabi DM, Edwards AL, Southern DA, et al. Association of socio-economic status with diabetes prevalence and utilization of diabetes care services. BMC Health Serv Res 2006;6:124. [DOI] [PMC free article] [PubMed] [Google Scholar]
- 3.Bernard DM, Banthin JS, Encinosa WE. Health care expenditure burdens among adults with diabetes in 2001. Med Care 2006;44:210–215 [DOI] [PubMed] [Google Scholar]
- 4.Zhou X, Shrestha SS, Shao H, Zhang P. Factors contributing to the rising national cost of glucose-lowering medicines for diabetes during 2005-2007 and 2015-2017. Diabetes Care 2020;43:2396–2402 [DOI] [PMC free article] [PubMed] [Google Scholar]
- 5.The Physicians Foundation. 2016 Survey of America’s Physicians: Practice Patterns and Perspectives. 2016. Accessed 17 August 2021. Available from https://physiciansfoundation.org/wp-content/uploads/2018/01/Biennial_Physician_Survey_2016.pdf
- 6.Seaquist ER. Addressing the burden of diabetes. JAMA 2014;311:2267–2268 [DOI] [PubMed] [Google Scholar]
- 7.Riddle MC, Herman WH. The cost of diabetes care—an elephant in the room. Diabetes Care 2018;41:929–932 [DOI] [PubMed] [Google Scholar]
- 8.Akosa Antwi Y, Moriya AS, Simon K. Effects of federal policy to insure young adults: evidence from the 2010 Affordable Care Act’s dependent-coverage mandate. Am Econ J-Econ Polic 2013; 5:1–28 [Google Scholar]
- 9.Harrington SE. US health-care reform: the Patient Protection and Affordable Care Act. J Risk Insur 2010;77:703–708 [Google Scholar]
- 10.Casagrande SS, McEwen LN, Herman WH. Changes in health insurance coverage under the Affordable Care Act: a national sample of U.S. adults with diabetes, 2009 and 2016. Diabetes Care 2018;41:956–962 [DOI] [PubMed] [Google Scholar]
- 11.Goldman AL, Woolhandler S, Himmelstein DU, Bor DH, McCormick D. Out-of-pocket spending and premium contributions after implementation of the Affordable Care Act. JAMA Intern Med 2018;178:347–355 [DOI] [PMC free article] [PubMed] [Google Scholar]
- 12.Kaiser Family Foundation. 2019. Employer Health Benefits Survey. Accessed 17 August 2021. Available from https://www.kff.org/health-costs/report/2019-employer-health-benefits-survey/
- 13.Zhang X, Trish E, Sood N. Financial burden of healthcare utilization in consumer-directed health plans. Am J Manag Care 2018;24:e115–e121 [PubMed] [Google Scholar]
- 14.Abdus S, Keenan PS. Financial burden of employer-sponsored high-deductible health plans for low-income adults with chronic health conditions. JAMA Intern Med 2018;178:1706–1708 [DOI] [PMC free article] [PubMed] [Google Scholar]
- 15.Segel JE, Kullgren JT. Health insurance deductibles and their associations with out-of-pocket spending and affordability barriers among US adults with chronic conditions. JAMA Intern Med 2017;177:433–436 [DOI] [PubMed] [Google Scholar]
- 16.Cunningham P, Carrier E. Trends in the financial burden of medical care for nonelderly adults with diabetes, 2001 to 2009. Am J Manag Care 2014;20:135–142 [PubMed] [Google Scholar]
- 17.Li R, Barker LE, Shrestha S, et al. Changes over time in high out-of-pocket health care burden in U.S. adults with diabetes, 2001-2011. Diabetes Care 2014;37:1629–1635 [DOI] [PMC free article] [PubMed] [Google Scholar]
- 18.Agency for Healthcare Research and Quality. MEPS. Medical Expenditure Panel Survey. 2019. Accessed 17 August 2021. Available from https://meps.ahrq.gov/mepsweb/
- 19.Cefalu WT, Dawes DE, Gavlak G, et al. Insulin Access and Affordability Working Group: conclusions and recommendations. Diabetes Care 2018;41:1299–1311 [DOI] [PMC free article] [PubMed] [Google Scholar]
- 20.Dunn A, Grosse SD, Zuvekas SH. Adjusting health expenditures for inflation: a review of measures for health services research in the United States. Health Serv Res 2018;53:175–196 [DOI] [PMC free article] [PubMed] [Google Scholar]
- 21.Cunningham PJ. The growing financial burden of health care: national and state trends, 2001-2006. Health Aff (Millwood) 2010;29:1037–1044 [DOI] [PubMed] [Google Scholar]
- 22.Agency for Healthcare Research and Quality. Medical Expenditure Panel Survey. MEPS HC-201. 2017 Full Year Consolidated Data File, 2019. Accessed 17 August 2021. Available from https://meps.ahrq.gov/data_stats/download_data/pufs/h201/h201doc.shtml#Using312
- 23.Internal Revenue Service. U.S. Department of the Treasury. 26 CFR 601.602: Tax forms and instructions. 2016. Accessed 17 August 2021. Available from https://www.irs.gov/pub/irs-drop/rp-16-28.pdf
- 24.Kim HJ, Fay MP, Feuer EJ, Midthune DN. Permutation tests for joinpoint regression with applications to cancer rates. Stat Med 2000; 19:335–351 [DOI] [PubMed] [Google Scholar]
- 25.Guy GP Jr, Yabroff KR, Ekwueme DU, et al. Healthcare expenditure burden among non-elderly cancer survivors, 2008–2012. Am J Prev Med 2015;49(Suppl. 5):S489–S497 [DOI] [PMC free article] [PubMed] [Google Scholar]
- 26.Luo J, Avorn J, Kesselheim AS. Trends in Medicaid reimbursements for insulin from 1991 through 2014 [published correction appears in JAMA Intern Med 2016;176:417]. JAMA Intern Med 2015;175:1681–1687 [DOI] [PubMed] [Google Scholar]
- 27.Luo J, Gellad WF. Origins of the crisis in insulin affordability and practical advice for clinicians on using human insulin. Curr Diab Rep 2020;20:2. [DOI] [PMC free article] [PubMed] [Google Scholar]
- 28.Karter AJ, Parker MM, Solomon MD, et al. Effect of out-of-pocket cost on medication initiation, adherence, and persistence among patients with type 2 diabetes: the Diabetes Study of Northern California (DISTANCE). Health Serv Res 2018;53:1227–1247 [DOI] [PMC free article] [PubMed] [Google Scholar]
- 29.National Conference of State Legislatures. Recent Medicaid Prescription Drug Laws and Strategies. Updated 8 August 2018. Accessed 17 August 2021. Available from https://www.ncsl.org/research/health/medicaid-pharmaceutical-laws-and-policies.aspx
- 30.National Conference of State Legislatures. Pharmaceutical Bulk Purchasing. 2 March 2020. Accessed 17 August 2021. Available from https://www.ncsl.org/research/health/bulk-purchasing-of-prescription-drugs.aspx
- 31.Young K. Utilization and Spending Trends in Medicaid Outpatient Prescription Drugs. Published 15 February 2019. Kaiser Family Foundation. Accessed 17 August 2021. Available from https://www.kff.org/medicaid/issue-brief/utilization-and-spending-trends-in-medicaid-outpatient-prescription-drugs/ [Google Scholar]
- 32.Kaiser Family Foundation. Medicaid’s Prescription Drug Benefit: Key Facts. 1 May 2019. Accessed 17 August 2021. Available from https://www.kff.org/medicaid/fact-sheet/medicaids-prescription-drug-benefit-key-facts/
- 33.Ghosh A, Simon K, Sommers BD. The effect of health insurance on prescription drug use among low-income adults: evidence from recent Medicaid expansions. J Health Econ 2019;63:64–80 [DOI] [PubMed] [Google Scholar]
- 34.Gellad WF, Donohue JM, Zhao X, Zhang Y, Banthin JS. The financial burden from prescription drugs has declined recently for the nonelderly, although it is still high for many. Health Aff (Millwood) 2012;31:408–416 [DOI] [PMC free article] [PubMed] [Google Scholar]
- 35.Frost A, Barrette E, Kennedy K, Brennan N. Health care spending under employer-sponsored insurance: a 10-year retrospective. Health Aff (Millwood) 2018;37:1623–1631 [DOI] [PubMed] [Google Scholar]
- 36.National Conference of State Legislatures. Health Insurance: Premiums and Increases, 2019. Accessed 17 August 2021. Available from https://www.ncsl.org/research/health/health-insurance-premiums.aspx#2017_Premiums
- 37.Long M, Rae M, Claxton G, Jankiewicz A, Rousseau DJ; for the Kaiser Family Foundation. Recent trends in employer-sponsored health insurance premiums. JAMA 2016;315:18 [Google Scholar]
- 38.Ginsburg PB, Strunk BC, Banker MI, Cookson JP . Tracking health care costs: continued stability but at high rates in 2005. Health Aff (Millwood) 2006;25:w486–w495 [DOI] [PubMed] [Google Scholar]
- 39.Cox C, Claxton G, Levitt L, Long M, Gonzales S, Sroczynski N. Analysis of 2017 Premium Changes and Insurer Participation in the Affordable Care Act’s Health Insurance Marketplaces. Updated 28 July 2016. Henry J. Kaiser Family Foundation. Accessed 17 August 2021. Available from https://files.kff.org/attachment/Issue-Brief-Analysis-of-2017-Premium-Changes-and-Insurer-Participation-in-the-ACA-Marketplaces [Google Scholar]
- 40.Kehoe R, Wu S-Y, Leske MC, Chylack LT Jr. Comparing self-reported and physician-reported medical history. Am J Epidemiol 1994;139:813–818 [DOI] [PubMed] [Google Scholar]
Associated Data
This section collects any data citations, data availability statements, or supplementary materials included in this article.