. 2022 Oct 10;11:e79346. doi: 10.7554/eLife.79346

Figure 5. Complete loss of Pgm1 activity overshoots a fitness optimum.

(A) AlphaFold structure of S. cerevisiae Pgm1 (Jumper et al., 2021). Mutated residues shown as spheres. (B) Kinetic parameters of recombinant Pgm1 enzymes as determined by a coupled enzymatic assay. Values ± 95% confidence intervals. (C) Michaelis–Menten curves of wild-type and mutant Pgm1. Replicate measurements are plotted as circles. (D) Pgm1 enzyme Vmax versus the corresponding allele’s fitness effect in the diploid pACT1-sec53-V238M background (as shown in Figure 3A). Horizontal and vertical error bars represent 95% confidence intervals. Best fit regression shown as a dashed curve (y = 14.583 + 0.04613x − 0.00014x2, R2 = 0.907, df = 4, F = 37.34, p = 0.0258, analysis of variance [ANOVA]). Note that we did not measure Pgm1-S120A activity and assume null activity.

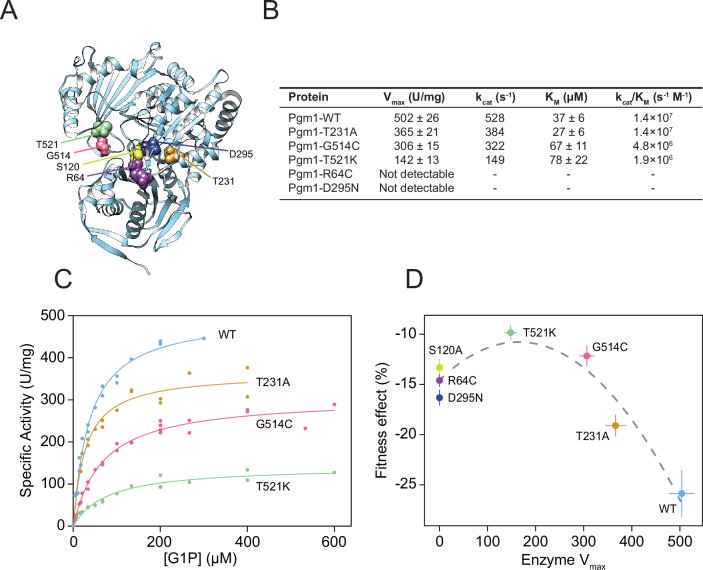
Figure 5—source data 1. Other biochemical properties of mutant Pgm1.

Figure 5.

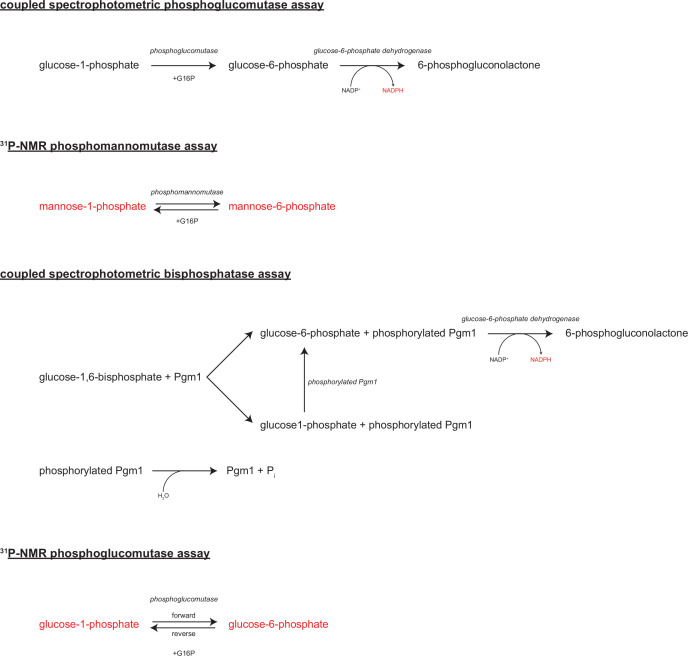
Figure 5—figure supplement 1. Enzymatic assays.

Figure 5—figure supplement 1.

Diagrams of the enzymatic reactions assayed in this study.
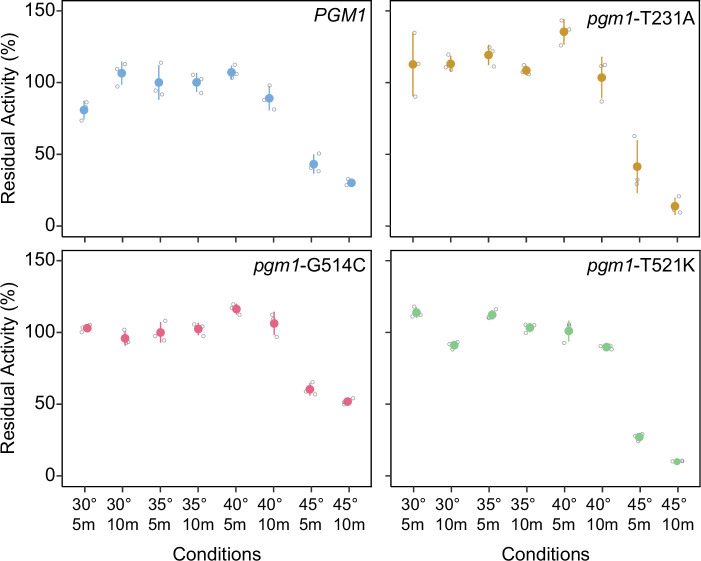
Figure 5—figure supplement 2. Thermostabilities of mutant Pgm1.

Figure 5—figure supplement 2.

Average residual activity and standard deviations of recombinant Pgm1 enzymes determined after incubation at the conditions described on the x-axis. Replicate measurements plotted as gray circles. Proteins were incubated in the presence bovine serum albumin (BSA; 0.1 mg/ml).
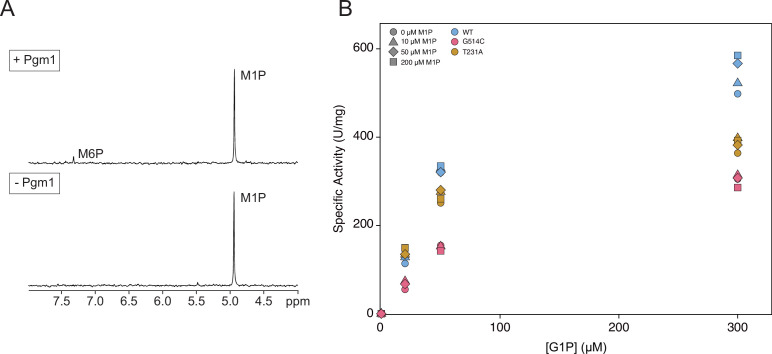
Figure 5—figure supplement 3. Phosphomannomutase activity of mutant Pgm1.

Figure 5—figure supplement 3.

(A) Representative phosphomannomutase assay by 31P-NMR spectroscopy. Pgm1 was incubated with 1 mM mannose-1-phosphate (M1P) and 20 μM glucose-1,6-bisphosphate (G16P) for 0 or 60 min. The amount of M1P or M6P was measured by integrating the area of the signals and comparing them to creatine phosphate, added as an internal standard. (B) Spectrophotometric phosphoglucomutase assays were conducted at different concentrations of glucose-1-phosphate (G1P) and M1P. Shapes indicate varying concentrations of M1P and colors indicate Pgm1 variants.
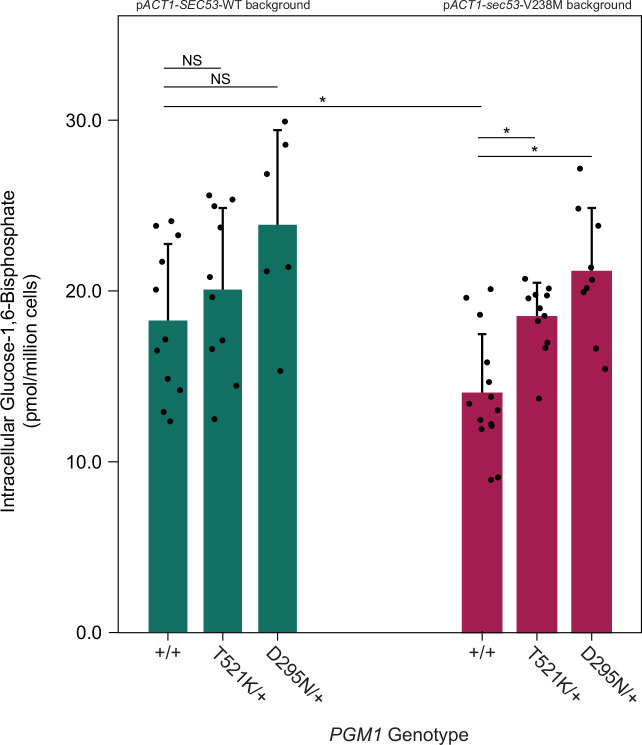
Figure 5—figure supplement 4. pgm1 mutations increase glucose-1,6-bisphosphate (G16P) levels in the pACT1-sec53-V238M background.

Figure 5—figure supplement 4.

Average abundance and standard deviations of G16P in SEC53-WT and sec53-V238M strains following metabolite extraction. Plus signs (+) indicate wild-type alleles. Replicate measurements plotted as circles. Asterisks (*) represent statistically significant differences (Mann–Whitney U-test, p < 0.01).
Figure 5—figure supplement 5. Representative forward/reverse phosphoglucomutase assay.

Figure 5—figure supplement 5.

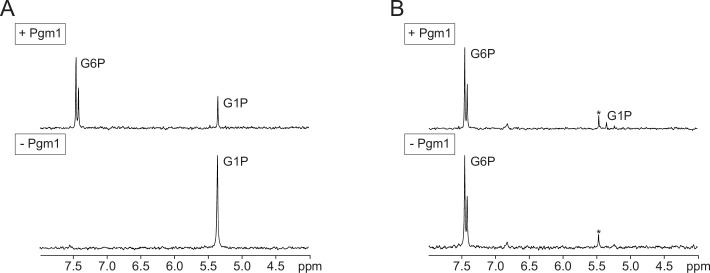
Equal amounts of Pgm1 were incubated with glucose-1-phosphate (G1P) (A) or G6P (B) in the presence of glucose-1,6-bisphosphate (G16P) for 0, 5, 10, or 15 min. The amount of the substrates and products was measured by integrating the area of the signals and comparing them to creatine phosphate, added as an internal standard. Asterisks (*) indicate Pi contaminants.