

Abstract
Caudal hindbrain A2 noradrenergic neurons provide critical metabolic-sensory input to the brain glucostatic circuitry. In males, insulin-induced hypoglycemia (IIH)-associated patterns of A2 cell dopamine-beta-hydroxylase (DβH) protein expression reflect diminution of the oxidizable fuel L-lactate, yet DβH exhibits sex-dimorphic responses to IIH. Here, retrograde tracing and combinatory single-cell laser-microdissection/multiplex qPCR techniques were used to examine whether lactate imposes sex-specific control of hypoglycemia-associated metabolic-sensory function and noradrenergic neurotransmission in A2 neurons that innervate the ventromedial hypothalamic nucleus (VMN), a key glucose-regulatory structure. VMN-projecting A2 neurons from each sex were characterized by presence or absence of nuclear glucokinase regulatory protein (nGKRP) immunoreactivity (-ir). IIH caused lactate-reversible up- or down-regulation of DβH mRNA in male and female nGKRP-ir-positive A2 neurons, respectively, and stimulated glucokinase (GCK) and sulfonylurea receptor-1 (SUR-1) gene expression in these cells in each sex. Hypoglycemia did not alter DβH, GCK, and SUR-1 transcript profiles in nGKRP-ir-negative male or female A2 neurons innervating the VMN. Estrogen receptor (ER) gene profiles in nGKRP-ir-positive neurons showed sex-specific [ER-alpha; G-protein-coupled estrogen-receptor-1 (GPER)] or sex-monomorphic (ER-beta) transcriptional responses to IIH. Fewer ER gene profiles were affected by IIH in nGKRP-ir-negative A2 neurons from male or female rats. Results show that during IIH, VMN-projecting A2 neurons may deliver altered, sex-dependent (nGKRP-positive) or unaffected (nGKRP-negative) noradrenergic input to the VMN. In each sex, metabolic-sensory gene profiles were reactive to hypoglycemia in nGKRP-ir-positive, not -negative A2 cells. Further studies are needed to elucidate the role of GKRP in transduction of metabolic imbalance into noradrenergic signaling, and to determine if input by one or more ER variants establishes sex differences in DβH transcriptional sensitivity to IIH.
Keywords: estradiol, dopamine-beta-hydroxylase, glucokinase, glucokinase regulatory protein, food deprivation, single-cell quantitative multiplex PCR
Introduction:
Specialized hindbrain dorsal vagal complex (DVC) neurons produce a dynamic readout of cellular energy status through adjustment of synaptic firing in reaction to small-scale changes in ambient energy fuel levels [Oomura and Yoshimatsu, 1984]. Caudal DVC A2 noradrenergic neurons are a reputed source of metabolic regulatory signaling as these cells express the following metabolic sensors [Briski et al., 2009; Cherian and Briski, 2011; Ibrahim et al., 2013]: 1) glucokinase (GCK), a specialized hexokinase that catalyzes non-reversible, product-independent phosphorylation of glucose in the initial step of the glycolytic pathway, functioning as a glucose sensor at this stage of intermediary metabolism [Matschinsky and Wilson, 2019]; 2) the ATP-sensitive plasma membrane potassium channel (KATP), an energy sensor that augments synaptic firing by membrane depolarization and is associated with hypothalamic ‘glucose-excited’ (GE) metabolic-sensory neuron function [Cotero and Routh, 2009; Gonzàlez et al., 2009]; and 3) the ultra-sensitive ATP sensor adenosine 5’-monophosphate-activated protein kinase (AMPK) [Hardie et al., 2016; Hardie and Lin, 2017; Lin and Hardie, 2019]. A2 neurons monitor the oxidizable substrate fuel L-lactate, an exportable product of astrocyte glycolysis, as pharmacological suppression of hindbrain monocarboxylate transporter function by alpha-cyano-4-hydroxycinnamate (4-CIN) increases expression of the immediate-early gene product Fos in these cells [Patil and Briski, 2005a]. Lactate uptake is clearly a critical hindbrain metabolic variable as caudal fourth ventricular 4-CIN administration elicits Fos immunostaining in key forebrain autonomic structures implicated in glucostasis [Briski and Patil, 2006] and elevates plasma glucose levels [Patil and Briski, 2005b]. Exogenous lactate delivery to the caudal hindbrain represses insulin-induced hypoglycemia (IIH)-associated patterns of noradrenaline (NA) activity in several hypothalamic loci, including the ventromedial hypothalamic nucleus (VMN) [Shrestha et al., 2014], a key site for integration of nutrient, endocrine, and neurochemical cues that shape glucose counter-regulation [Watts and Donovan, 2010; Donovan and Watts, 2014]. Recent studies show that neurotoxic destruction of caudal hindbrain catecholaminergic neurons results in sex-specific alterations in hypoglycemic patterns of VMN glucose-regulatory transmission marker protein expression [Briski et al., 2021]. Brain tissue lactate accumulation is also a vital indicator of oxygen deficiency-associated adjustments in mitochondrial energy production observed during hypoxia/ischemia [Chaudhari et al., 2022].
Electrophysiological mapping over the rostro-caudal length of the DVC reveals that neurons that exhibit decreased or increased firing activity, i.e. engage in GE versus ‘glucose-inhibited’ (GI) metabolic-sensory signaling when glucose supply falls reside primarily in the A2 cell group area [Mizuno and Oomura, 1984], where both metabolic-sensory phenotypes are ascribed to catecholaminergic neurons [Yettefti et al., 1997]. Recent studies show that A2 neurons exhibit sex-dimorphic changes in expression of the hypoglycemia-sensitive catecholamine biosynthetic enzyme dopamine-beta-hydroxylase (DβH) protein [Cherian and Briski, 2011] during IIH [Briski et al, 2020]. In male rats, hypoglycemia-associated up-regulation of DβH protein is attributed to diminished lactate supply, which infers that these cells engage in increased GI signaling in response to IIH [Shrestha et al., 2014]. On the other hand, IIH decreases female A2 nerve cell DβH protein content [Briski et al., 2020], which may indicate suppression of GE function, but it is unclear if hypoglycemic patterns of lactate signaling regulate expression of this catecholamine pathway marker in this sex. Divergent DβH responsiveness to IIH correlates with observations of increased or decreased VMN NE content in hypoglycemic male versus female rats [Ali et al., 2019; Napit et al., 2019].
Current research used retrograde neuronal tracing and combinatory single-cell dual-label immunocytochemistry/multiplex qPCR techniques to address the premise that in each sex, A2 neurons that innervate the VMN express gene transcripts that encode metabolic-sensory molecular machinery, and that lactate imposes sex-specific control of basal and/or hypoglycemic patterns of transcription of DβH, the glucose sensor GCK, and the energy sensor KATP. Glucokinase regulatory protein (GKRP) regulates GCK enzyme activity and subcellular localization through formation of GKRP-GCK complexes [Agius, 2008; Agius 2016; Sternisha and Miller, 2019]. Glucose and GKRP compete for binding to GCK; GKRP-GCK complexes are formed when cellular glucose levels wane, causing deactivation of GCK, and then translocate to the nucleus. Our working premise here was that the presence versus absence of nuclear GKRP immunostaining of VMN-projecting A2 neurons would differentiate these cells into subtypes that 1) express GCK and engage in metabolic-sensory function or 2) lack GCK. A2 neurons express the classical nuclear estrogen receptor (ER) variants ER-alpha (ERα) and -beta (ERβ) [Ibrahim et al., 2013] and G-protein-coupled estrogen receptor-1 (GPER) [Briski et al., 2020], and integrate steroid and metabolic cues [Ibrahim et al., 2014]. Estradiol administration to the caudal fourth ventricle regulates blood glucose levels in hypoglycemic ovariectomized (OVX) female rats [Nedungadi and Briski, 2012]. This steroid hormone modulates hindbrain AMPK regulation of hypothalamic Fos immunostaining [Ibrahim et al., 2013] and phosphoAMPK (pAMPK) and metabolic transmitter protein expression [Alenazi et al., 2014]. A corollary objective of the present study was to determine, for each sex, if lactate controls A2 nerve cell ERα, ERβ, and/or GPER gene transcription during eu- and hypoglycemia.
Methods and Materials:
Animals:
Adult male and female Sprague Dawley rats (2-3 months of age) were housed prior to experimentation in groups of 2-3 per cage, according to sex, under a 14 hr light/10 hr dark cycle (lights on at 05.00 hr). Animals were allowed free access to standard laboratory chow and tap water, and were gentled on a daily basis to facilitate acclimation to handling.
Experimental Design:
All surgical and experimental protocols were performed in compliance with the NIH Guide for the Care and Use of Laboratory Animals, 8th Edition, under approval by the ULM Institutional Animal Care and Use Committee (protocol no. 19AUG-KPB-01). Animals of each sex were randomly divided into four treatment groups, with n=6 male and n=6 female rats assigned to each group. On Study Day 1, animals were anesthetized by subcutaneous (sc) injection of ketamine/xylazine anesthesia (0.1 mL/100 g bw; 90 mg ketamine:10 mg xylazine/mL; Covetrus, Portland, ME) prior to stereotaxic implantation of a PE-20 cannula into the caudal fourth ventricle (CV4) [Singh and Briski, 2004], and bilateral injection of Retrobead retrograde tracer (1.0 μL, rate: 3.6 μL/min, Lumafluor Corp., Durham, NC) into the VMN by stereotaxic Drill and Injection Robot (Neurostar, Tubingen, Germany) [Uddin et al., 2021]. While under anesthesia, female rats were bilaterally ovariectomized (OVX). Animals were injected with ketoprofen sc and enrofloxacin IM and treated by topical administration of 0.25% bupivacaine to closed incisions prior to transferred to individual cages. On Study Day 7, female rats were implanted, under isoflurane anesthesia, with a sc silastic capsule (10 mm/100 g bw, 0.062 in. i.d, 0.125 in. o.d.) containing 30 μg 17β estradiol-3-benzoate/mL safflower oil [Briski et al., 2001]. This steroid replacement regimen yields approximate plasma estradiol concentrations of 22 pg/mL to replicate circulating hormone levels characteristic of metestrus in a 4-day cycle [Butcher et al., 1974]. On Study Day 11, L-lactate (25 μM/2.0 μL/hr, Sigma-Aldrich, St. Louis, MO) or the vehicle artificial cerebrospinal fluid (aCSF) was continuously infused into the CV4 between 08.50 hr and 10.00 hr [Patil and Briski, 2005b]. At 09.00 hr on Day 11, rats were injected sc with the vehicle sterile diluent (V; Eli Lilly & Co., Indianapolis, IN) or neutral protamine Hagedorn insulin (INS, 10.0 U/kg bw; Eli Lilly [Ali et al., 2019; Napit et al., 2019], then sacrificed by decapitation at 10:00 hr. Individual dissected brains were snap-frozen in liquid nitrogen-cooled isopentane for storage at −80°C. Plasma glucose levels were measured by glucometer, as described [Ali et al., 2019; Napit et al., 2019].
Hindbrain A2 Noradrenergic Neuron In Situ Immunolabeling and Laser-Catapult Microdissection:
Ten micron-thick frozen sections were cut from each hindbrain between 14.36 to 14.86 mm posterior to bregma and mounted on polyethylene naphthalate membrane slides (Carl Zeiss MicroImaging, Inc., White Plains, NY), as described [Briski et al., 2009] for epifluorescence visualization of cytoplasmic retrograde tracer and dual-label immunohistochemical staining for cytoplasmic tyrosine hydroxylase (TH)-immunoreactivity (-ir) and nuclear glucokinase regulatory protein (GCKR)-ir. Briefly, sections were fixed with ice-cold acetone (5 min), blocked with 4.0% normal donkey serum (prod. No. S30; EMD Millipore, Burlington, MA) in 0.01 M Tris-buffered saline, pH 7.6 (TBS), containing 0.05% Triton X-100 (30 min), then exposed (48 hr; 4°C) to a mouse monoclonal antiserum against TH (prod. no. 22941, 1:600; Immunostar, Hudson, WI; RRID: AB_572268), as described [Briski et al., 2009], followed by overnight incubation with AlexaFluor® 488 donkey anti-mouse secondary antibody (prod. no. 715-545-151, 1:400; Jackson ImmunoResearch Laboratories, Inc., West Grove, PA). Tissues were next treated with endogenous peroxidase blocking solution (prod. no. SP-6000; Vector Laboratories, Inc., Burlingame, CA; 10 min) before incubation (72 hr; 4°C) with a rabbit polyclonal anti-GCKR antiserum (prod. no. NBP2-16623, 1:500; Novus Biologicals LLC, Littleton, CO), then exposed (2 hr) to peroxidase-labeled donkey anti-rabbit secondary antibodies (prod. No. 711-035-152, 1:200; Jackson ImmunoRes.) prior to processing with ImmPACT® DAB EqV peroxidase substrate kit reagents (prod. no. SK-4103; Vector Lab.). Individual A2 neurons exhibiting both red cytoplasmic Retrobead epifluorescence and green cytoplasmic TH-ir, with or without nuclear GCKR-immunostaining were harvested by laser-microdissection using a P.A.L.M. UV-A microlaser IV system (Carl Zeiss MicroImaging) [Briski et al., 2009], and each collected into an adhesive cap (prod. no. 415190-9181-000; Carl Zeiss MicroImaging) containing 4.0 uL cell lysis buffer (SingleShot Cell Lysis kit; prod. No. 1725080; Bio-Rad Laboratories, Hercules, CA). For each treatment group within each sex, a total of n=18 triple- (i.e. cytoplasmic epifluorescence-positive, cytoplasmic TH-ir-positive, nuclear GKRP-ir-positive) and n=18 double-labeled (i.e. cytoplasmic epifluorescence-positive, cytoplasmic TH-ir-positive; nuclear GKRP-ir-negative) A2 neurons were collected for gene expression analysis by methods established in our laboratory [Vavaiya and Briski, 2008; Briski et al., 2009; Genabai et al., 2009; Cherian and Briski, 2011].
Single-Cell Multiplex Quantitative Reverse Transcription PCR (RT-qPCR) Analysis:
Complementary DNA (cDNA) Synthesis and Amplification:
Individual cell lysates were obtained by centrifugation (3000 rpm; 4°C), then incubated at 25°C (10 min) and at 75°C (5 min) in an iQ5 iCycler (Bio-Rad, Hercules, CA) to remove genomic DNA. Sample RNA integrity, purity, and quantity was determined in a Bio-Rad Experion gel-based electrophoresis system, as described [Vavaiya and Briski, 2008]. RNA was reverse-transcribed to cDNA by addition of 1.5 uL cDNA synthesis buffer (iScript™ Advanced cDNA Synthesis Kit; prod. no. 1725038; Bio-Rad), followed by sequential incubation at 46°C (20 min) and 95°C (1 min). A preamplification master mix was created by pooling PrimePCR™ PreAmp for SYBR® Green Assays for DβH (prod. no. qRnoCED0002996; Bio-Rad), TH (prod. no. qRnoCID0002299; Bio-Rad), GCK (prod. no. qRnoCID0009394; Bio-Rad), SUR-1 (prod. no. qRnoCED0001490; Bio-Rad), ERα (prod. no. qRnoCID0009588; Bio-Rad), ERβ (prod. no. qRnoCID0008785; Bio-Rad), GPER (prod. no. qRnoCED0007818; Bio-Rad), and GAPDH (prod. no. qRnoCID0057018; Bio-Rad) with SsoAdvanced™ PreAmp Supermix (prod. no. 1725160; Bio-Rad). Pre-amplified cDNA was generated by addition of 9.5 μL preamplification master mix to each cDNA sample prior to thermal cycler incubation at 95°C (3 min), followed by 10 cycles of incubation at 95°C (15 sec), then 60°C (4 min). Pre-amplified cDNA samples were diluted by addition of 185 μL IDTE (prod. no. 11-05-01-05; 1X TE solution; Integrated DNA Technologies, Inc., Coralville, IA). qPCR Analysis: PCR samples were prepared by combining primers [GCK (0.5 μL; prod. no. qRnoCID0009394; Bio-Rad), SUR-1 (0.5 μL; prod. no. qRnoCED0001490; Bio-Rad), DβH (0.5 μL; prod. no. qRnoCED0002996; Bio-Rad), TH (0.5 μL; prod. no. qRnoCID0002299; Bio-Rad), GPER (0.5 μL; prod. no. qRnoCED0007818; Bio-Rad), ERα (0.5 μL; prod. no. qRnoCID0009588; Bio-Rad), ERβ (0.5 μL; prod. no. qRnoCID0008785; Bio-Rad) and GAPDH (0.5 μL; prod. no. qRnoCID0057018; Bio-Rad)], cDNA sample (2 μL), and iTaq™ Universal SYBR® Green Supermix (5 μL, prod. no. 1725121; Bio-Rad). Samples were added to individual wells of hard-shell 384-well PCR plates (prod. no. HSP3805, Bio-Rad) for analysis in a CFX384™ Touch Real-Time PCR Detection System (Bio-Rad) by initial denaturation at 95°C (30 sec), followed by 40 cycles of 1) 3 sec incubation at 95°C and 2) 30 sec incubation at 59°C for DβH, 60°C for TH, 58.8°C for GCK, 59.1°C for SUR1, 58°C for ERα, 59.2°C for ERβ, 59.8°C for GPER, or 57.3°C for GAPDH, respectively. Melt curve analyses were performed to identify non-specific products and primer dimers. mRNA data were analyzed by the comparative Ct, i.e. 2ΔΔCt method [Livak and Schmittgen, 2001].
Statistical Analyses:
Mean normalized DβH, TH, GCK, SUR-1, ERα, ERβ, and GPER gene expression for A2 noradrenergic neurons that were positive for cytoplasmic retrobead epifluorescence, cytoplasmic TH-ir, and nuclear GKRP-ir or positive for cytoplasmic retrobead epifluorescence and TH-ir, but negative for nuclear GKRP-ir were analyzed by three-way analysis of variance and Student Newman Keuls post-hoc test. Plasma glucose levels were also evaluated by three-way analysis of variance and Student Newman Keuls post-hoc test. Differences of p<0.05 were considered significant. In each figure, statistical differences between specific pairs of treatment groups are mentioned with the following symbols: *p < 0.05; **p < 0.01, ***p < 0.001.
Results:
Figure 1A and 1B depict the orientation of the caudal DVC within the dorsomedial hindbrain, and the location of TH-ir-positive neurons that were immunolabeled in situ prior to laser-microdissection. Figures 1C and 1D show representative A2 neurons that exhibit dual cytoplasmic Retrobead retrograde tracer epifluorescence and TH-ir-positive immunostaining in the presence or absence of nuclear GKRP-ir, respectively. Figure 2 illustrates effects of sc INS injection on DβH (Figures 2A and 2B) or TH (Figures 2C and 2D) gene expression in nuclear GKRP (nGKRP)-ir-positive or nGKRP-ir-negative hindbrain A2 noradrenergic neurons that innervate the male versus female rat VMN. Data in Figure 2A [F(7,136)=7.04, p<0.001; Sex main effect: F(1,136)=9.82, p=0.002; Lactate effect: F(1,136)=0.29, p=0.593; Insulin effect main effect: F(1,136)=5.15, p=0.025; Sex/lactate interaction: F(1,136)=3.60, p=0.06; Sex/insulin interaction: F(1,136)=13.98, p<0.001; Lactate/insulin interaction: F(1,136)=0.19, p=0.658; Sex/lactate/insulin interaction: F(1,136)=16.26, p<0.001] show that IIH caused significant up- or down-regulation of DβH mRNA levels in GKRP-ir-positive VMN-projecting A2 neurons collected from male [INS/aCSF (diagonal-striped white bar) versus V/aCSF (solid white bar)] versus female [INS/aCSF (diagonal-striped gray bar) versus V/aCSF (solid gray bar)] rats, respectively. Infusion of L-lactate into the CV4 did not alter this gene profile in V-injected rats of either sex [V/L-lactate (male: cross-hatched white bar; female: cross-hatched gray bar) versus V/aCSF (male: solid white bar; female: solid gray bar)]. Animals infused with L-lactate exhibited no change in DβH transcript profiles after INS treatment [INS/L-lactate (male: horizontal-striped white bar; female: horizontal-striped gray bar)versus V/L-lactate (male: cross-hatched white bar; female: cross-hatched gray bar)]. Results presented in Figure 2B [F(7,136)=1.37, p=0.225; Sex main effect: F(1,136)=0.127, p=0.722; Lactate effect: F(1,136)=1.34, p=0.250; Insulin effect main effect: F(1,136)=6.66, p=0.011; Sex/lactate interaction: F(1,136)=0.67, p=0.414; Sex/insulin interaction: F(1,136)=0.45, p=0.505; Lactate/insulin interaction: F(1,136)=0.023, p=0.880; Sex/lactate/insulin interaction: F(1,136)=0.29, p=0.593] indicate that DβH gene expression in nGKRP-ir-negative A2 neurons from either sex was unaffected by INS treatment alone or in conjunction with intra-CV4 L-lactate infusion.
Figure 1. Identification of Ventromedial Hypothalamic Nucleus (VMN)-Projecting A2 Noradrenergic Neurons by Dual Cytoplasmic Retrobead Epifluorescence and Tyrosine Hydroxylase (TH)-Immunoreactivity (-ir) and Their Sub-Categorization According to Presence versus Absence of Nuclear Glucokinase Regulatory Protein (GKRP) Immunolabeling.
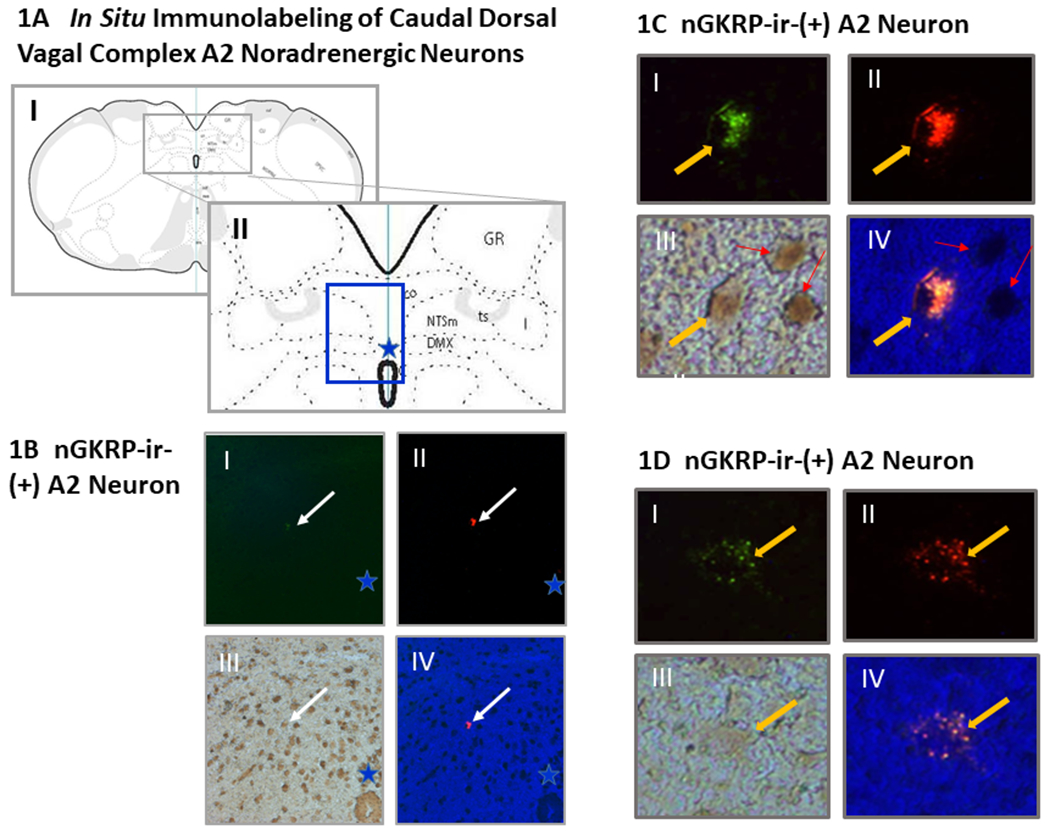
Testes-intact and estradiol-implanted ovariectomized (OVX) female rats were injected with Retrobead retrograde tracer into the VMN ahead of subcutaneous (sc) neutral protamine Hagedorn insulin (INS; 10.0 U/kg bw) and intra-CV4 infusion of L-lactate or the vehicle artificial cerebrospinal fluid (aCSF). Hindbrain TH-ir A2 neurons exhibiting red cytoplasmic tracer epifluorescence were individually laser-catapult-microdissected for single-cell multiplex qPCR, and subcategorized according to the presence or absence of nGCKR-ir. In Figure 1A, rat brain coronal sections depict the orientation of the caudal dorsal vagal complex (located inside the rectangle in Panel I, enlarged as Panel II) within the dorsomedial hindbrain. In Figures 1A and 1B, the blue star denotes the location of the central canal. Figure 1B shows low magnification images of a TH-ir-positive neuron (Panel I; white arrow) that contains cytoplasmic Retrobead epifluoresence (Panel II) as well as nuclear GKRP (nGCKR)-ir (Panel III). At lower right-hand, Panel IV presents a merged image of cytoplasmic and nuclear staining in this cell. Figures 1C and 1D depict at high-magnification representative Retrobead epifluorescence- and TH-ir-positive hindbrain A2 neurons, indicated by a yellow arrow, that exhibit or lack nuclear GKRP-ir, respectively. In figures 1C and 1D, Panels I, II, and III depict cytoplasmic TH-ir, cytoplasmic red Retrobead epifluorescence, and the presence or absence of nuclear GKRP-ir, in that order, whereas Panel IV presents a merged image of cytoplasmic and nuclear staining patterns. Red arrows in Panels III and IV of Figure 1A denote GKRP-ir-positive, TH-ir-negative neurons. Abbreviations in Figure 1A, Panel II: NTSco,m,l: commissural, medial and lateral parts of the nucleus of the solitary tract; ts: solitary tract; C: central canal; GR: gracile nucleus.
Figure 2. Effects of Insulin (INS) Injection on Dopamine-Beta-Hydroxylase (DβH) and TH Gene Expression in A2 Noradrenergic Neurons Innervating the Ventromedial Hypothalamic Nucleus (VMN of Male and Female Rats; Impact of L-Lactate Infusion into the Caudal Fourth Ventricle (CV4).
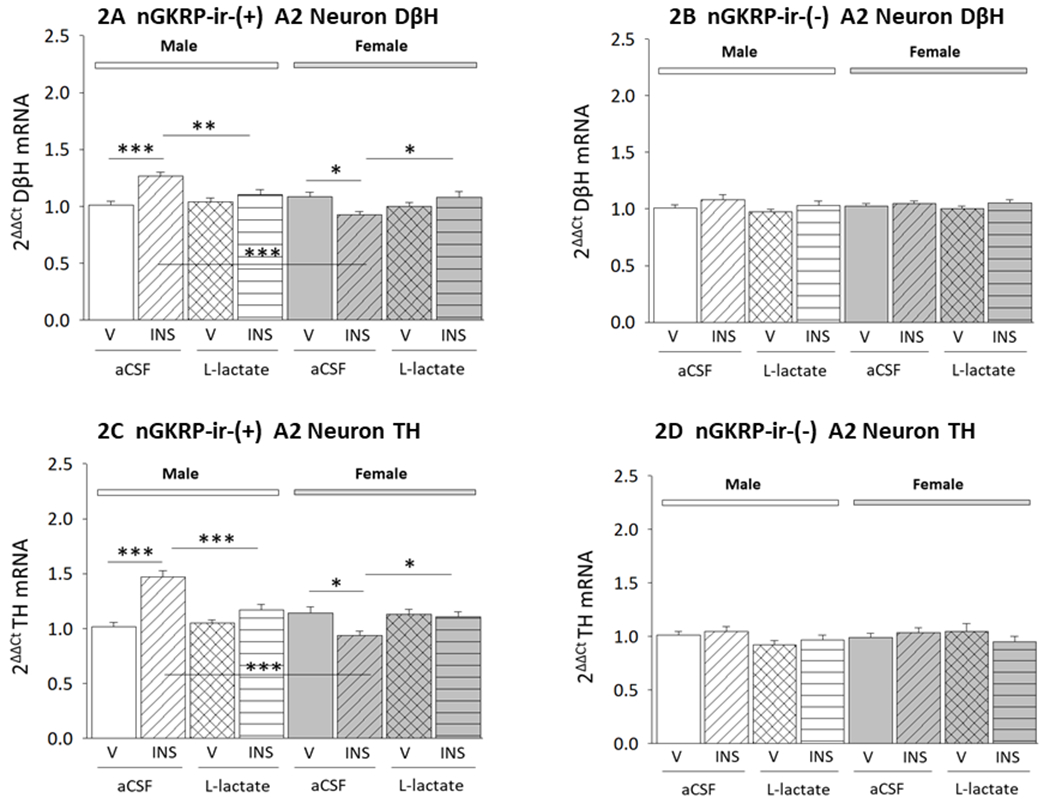
Data depict mean normalized DβH or TH mRNA levels ± S.E.M. measured in cytoplasmic epifluorescence-positive, cytoplasmic TH-ir-positive, nGKRP-ir-positive A2 neurons (Figures 2A and 2C) or cytoplasmic epifluorescence-positive, cytoplasmic TH-ir-positive, nGKRP-ir-negative (Figures 2B and 2D) A2 neurons harvested from the following groups of male (left-hand side) or female (right-hand side) rats: V/aCSF (male: solid white bars, female: solid gray bars; n=18 nGKRP-ir-positive A2 nerve cells per sex; n=18 nGKRP-ir-negative A2 neurons per sex), INS/aCSF (male: diagonal-striped white bars, female: diagonal-striped gray bars; n=18 nGKRP-ir-positive A2 nerve cells per sex; n=18 nGKRP-ir-negative A2 neurons per sex), V/L-lactate (male: cross-hatched white bars, female: cross-hatched gray bars; n=18 nGKRP-ir-positive A2 nerve cells per sex; n=4 nGKRP-ir-negative A2 neurons per sex), or INS/L-lactate (male: horizontal-striped white bars, female: horizontal-striped gray bars; n=18 nGKRP-ir-positive A2 nerve cells per sex; n=18 nGKRP-ir-negative A2 neurons per sex) treatment groups. *p<0.05; **p<0.01; ***p<0.001.
Data in Figures 2C and 2D portray effects of INS injection on TH gene transcripts in nGKRP-ir-positive or nGKRP-ir-negative VMN-projecting A2 neurons, respectively. Data in the former figure show that in cells exhibiting nGKRP-immunostaining, TH mRNA levels were correspondingly increased or decreased in male versus female rats [F(7,136)=12.20, p<0.001; Sex main effect: F(1,136)=9.31, p=0.003; Lactate effect: F(1,136)=0.74, p=0.391; Insulin effect main effect: F(1,136)=7.32, p=0.008; Sex/lactate interaction: F(1,136)=10.86, p=0.001; Sex/insulin interaction: F(1,136)=39.23, p<0.001; Lactate/insulin interaction: F(1,136)=1.35, p=0.248; Sex/lactate/insulin interaction: F(1,136)=16.60, p<0.001]. As shown in the latter figure, these sex-specific divergent TH gene transcriptional responses to IIH were prevented by intra-CV4 L-lactate infusion [F(7,136)=0.96, p=0.467; Sex main effect: F(1,136)=0.34, p=0.559; Lactate effect: F(1,136)=1.93, p=0.167; Insulin effect main effect: F(1,136)=0.06, p=0.802; Sex/lactate interaction: F(1,136)=1.17, p=0.281; Sex/insulin interaction: F(1,136)=1.01, p=0.317; Lactate/insulin interaction: F(1,136)=0.88, p=0.350; Sex/lactate/insulin interaction: F(1,136)=1.29, p=0.259].
Figure 3 illustrates effects of IIH with or without L-lactate infusion to the CV4 on patterns of GCK (Figures 3A and 3B) and SUR-1 (Figures 3C and 3D) gene expression in nGKRP-ir-positive versus nGKRP-ir-negative A2 neurons innervating the male or female VMN. Data presented in Figure 3A show that in each sex, nGKRP-ir-positive A2 nerve cell GCK mRNA levels were elevated in response to INS [F(7,136)=5.29, p<0.001; Sex main effect: F(1,136)=6.32, p=0.013; Lactate effect: F(1,136)=9.70, p=0.002; Insulin effect main effect: F(1,136)=12.91, p<0.001; Sex/lactate interaction: F(1,136)=0.03, p=0.866; Sex/insulin interaction: F(1,136)=0.02, p=0.888; Lactate/insulin interaction: F(1,136)=7.98, p=0.005; Sex/lactate/insulin interaction: F(1,136)=0.05, p=0.820]. In each sex, this stimulatory transcriptional response was averted by L-lactate infusion. As shown in Figure 3B, IIH did not modify GCK gene expression in nGKRP-ir-negative A2 cells from male or female rats [F(7,136)=1.36, p=0.230; Sex main effect: F(1,136)=0.091, p=0.764; Lactate effect: F(1,136)=0.02, p=0.885; Insulin effect main effect: F(1,136)=5.19, p=0.024; Sex/lactate interaction: F(1,136)=0.95, p=0.332; Sex/insulin interaction: F(1,136)=0.01, p=0.951; Lactate/insulin interaction: F(1,136)=0.53, p=0.468; Sex/lactate/insulin interaction: F(1,136)=2.69, p=0.103].
Figure 3. Effects of L-Lactate on Glucokinase (GCK) and Sulfonylurea receptor-1 (SUR-1) Gene Expression in VMN-Projecting A2 Noradrenergic Neurons from INS- or V-Injected Male versus Female Rats.

Data depict mean normalized GCK or SUR-1 mRNA levels ± S.E.M. measured in cytoplasmic epifluorescence-positive, cytoplasmic TH-ir-positive, nGKRP-ir-positive A2 neurons (Figures 3A and 3C) or cytoplasmic epifluorescence-positive, cytoplasmic TH-ir-positive, nGKRP-ir-negative (Figures 3B and 3D) A2 neurons harvested from V/aCSF (male: solid white bars, female: solid gray bars; n=18 nGKRP-ir-positive A2 nerve cells per sex; n=18 nGKRP-ir-negative A2 neurons per sex), INS/aCSF (male: diagonal-striped white bars, female: diagonal-striped gray bars; n=18 nGKRP-ir-positive A2 nerve cells per sex; n=18 nGKRP-ir-negative A2 neurons per sex), V/L-lactate (male: cross-hatched white bars, female: cross-hatched gray bars; n=18 nGKRP-ir-positive A2 nerve cells per sex; n=4 nGKRP-ir-negative A2 neurons per sex), and INS/L-lactate (male: horizontal-striped white bars, female: horizontal-striped gray bars; n=18 nGKRP-ir-positive A2 nerve cells per sex; n=18 nGKRP-ir-negative A2 neurons per sex) treatment groups. *p<0.05; **p<0.01; ***p<0.001.
Results presented in Figure 3C indicate that SUR-1 gene expression was up-regulated in VMN-projecting nGKRP-ir-positive A2 neurons from either sex [F(7,136)=4.53, p<0.001; Sex main effect: F(1,136)=4.59, p=0.034; Lactate effect: F(1,136)=5.86, p=0.017; Insulin effect main effect: F(1,136)=11.26, p=0.001; Sex/lactate interaction: F(1,136)=0.04, p=0.849; Sex/insulin interaction: F(1,136)=0.02, p=0.882; Lactate/insulin interaction: F(1,136)=9.23, p=0.003; Sex/lactate/insulin interaction: F(1,136)=0.62, p=0.434]. Whereas L-lactate infusion into the CV4 of V-injected rats did not modify this gene profile in nGKRP-ir-positive A2 cells, L-lactate administration prevented IIH-associated augmentation of SUR-1 mRNA levels in male and female rats. Data shown in Figure 3D indicate that nGKRP-ir-negative A2 neuron SUR-1 gene transcription was unaffected by IIH in each sex [F(7,136)=0.64, p=0.772; Sex main effect: F(1,136)=0.70, p=0.403; Lactate effect: F(1,136)=0.12, p=0.727; Insulin effect main effect: F(1,136)=3.09, p=0.081; Sex/lactate interaction: F(1,136)=0.24, p=0.625; Sex/insulin interaction: F(1,136)=0.03, p=0.859; Lactate/insulin interaction: F(1,136)=0.24, p=0.652; Sex/lactate/insulin interaction: F(1,136)=0.08, p=0.781].
Figure 4 illustrates patterns of ERα (Figures 4A and 4B), ERβ (Figures 4C and 4D), and GPER (Figures 4E and 4F) gene expression in nGKRP-ir-positive versus -ir-negative A2 neurons projecting to the male or female VMN after treatment with INS alone or with CV4 L-lactate infusion. As shown in Figure 4A, IIH up-regulated ERα mRNA levels in nGKRP-ir-positive A2 cells taken from male, but not female hindbrain [F(7,136)=3.03, p=0.005; Sex main effect: F(1,136)=0.82, p=0.366; Lactate effect: F(1,136)=1.04, p=0.310; Insulin effect main effect: F(1,136)=0.04, p=0.848; Sex/lactate interaction: F(1,136)=2.32, p=0.13; Sex/insulin interaction: F(1,136)=7.76, p=0.006; Lactate/insulin interaction: F(1,136)=2.49, p=0.117; Sex/lactate/insulin interaction: F(1,136)=6.72, p=0.011]. This sex-specific transcriptional response to INS injection was averted by intra-CV4 L-lactate infusion. Data presented in Figure 4B show that INS treatment also caused L-lactate-reversible augmentation of ERα transcripts in nGKRP-ir-negative neurons in the male rat, but had no effect on this gene profile in cells acquired from the female [F(7,136)=2.75, p=0.010; Sex main effect: F(1,136)=1.44, p=0.232; Lactate effect: F(1,136)=7.59, p=0.007; Insulin effect main effect: F(1,136)=7.23, p=0.008; Sex/lactate interaction: F(1,136)=0.00, p=0.959; Sex/insulin interaction: F(1,136)=1.60, p=0.208; Lactate/insulin interaction: F(1,136)=0.76, p=0.385; Sex/lactate/insulin interaction: F(1,136)=0.65, p=0.422].
Figure 4. Effects of L-Lactate on INS-Induced Patterns of Estrogen Receptor-Alpha (ERα), Estrogen Receptor-Beta (ERβ), and G-Protein-Coupled Estrogen Receptor-1 (GPER) Gene Expression in VMN-Projecting A2 Noradrenergic Neurons from Male versus Female Rats.

Data depict mean normalized ERα, ERβ, or GPER mRNA levels ± S.E.M. measured in cytoplasmic epifluorescence-positive, cytoplasmic TH-ir-positive, nGKRP-ir-positive A2 neurons (Figures 4A, 4C, and 4E) or cytoplasmic epifluorescence-positive, cytoplasmic TH-ir-positive, nGKRP-ir-negative (Figures 4B, 4D, and 4F) A2 neurons harvested from V/aCSF (male: solid white bars, female: solid gray bars; n=18 nGKRP-ir-positive A2 nerve cells per sex; n=18 nGKRP-ir-negative A2 neurons per sex), INS/aCSF (male: diagonal-striped white bars, female: diagonal-striped gray bars; n=18 nGKRP-ir-positive A2 nerve cells per sex; n=18 nGKRP-ir-negative A2 neurons per sex), V/L-lactate (male: cross-hatched white bars, female: cross-hatched gray bars; n=18 nGKRP-ir-positive A2 nerve cells per sex; n=4 nGKRP-ir-negative A2 neurons per sex), and INS/L-lactate (male: horizontal-striped white bars, female: horizontal-striped gray bars; n=18 nGKRP-ir-positive A2 nerve cells per sex; n=18 nGKRP-ir-negative A2 neurons per sex) treatment groups. *p<0.05; **p<0.01; ***p<0.001.
Figures 4C and 4D depict effects of IIH on ERβ gene expression in nGKRP-ir-positive versus nGKRP-ir-negative A2 neurons, respectively. Data show that INS injection increased ERβ mRNA levels in nGKRP-ir-positive A2 cells from each sex [F(7,136)=6.56, p<0.001; Sex main effect: F(1,136)=20.17, p<0.001; Lactate effect: F(1,136)=6.12, p=0.015; Insulin effect main effect: F(1,136)=8.20, p=0.005; Sex/lactate interaction: F(1,136)=0.13, p=0.719; Sex/insulin interaction: F(1,136)=0.34, p=0.561; Lactate/insulin interaction: F(1,136)=10.55, p=0.001; Sex/lactate/insulin interaction: F(1,136)=0.42, p=0.519]. This stimulatory transcriptional response was prevented in each by L-lactate delivery to the CV4. As shown in Figure 4D, this gene profile was increased in response to IIH in nGKRP-ir-negative A2 neurons from female, but not male rats [F(7,136)=2.61, p=0.015; Sex main effect: F(1,136)=3.86, p=0.052; Lactate effect: F(1,136)=0.66, p=0.418; Insulin effect main effect: F(1,136)=5.73, p=0.018; Sex/lactate interaction: F(1,136)=0.88, p=0.351; Sex/insulin interaction: F(1,136)=2.54, p=0.114; Lactate/insulin interaction: F(1,136)=4.52, p=0.035; Sex/lactate/insulin interaction: F(1,136)=0.06, p=0.813].
Patterns of A2 nerve cell GPER gene transcription in INS-injected male and female rats are shown in Figures 4E (nGKRP-ir-positive) and 4F (nGKRP-ir-negative). Results indicate that this gene profile was elevated or suppressed in nGKRP-ir-positive A2 neurons from male versus female rat, respectively [F(7,136)=13.06, p<0.001; Sex main effect: F(1,136)=61.85, p<0.001; Lactate effect: F(1,136)=3.56, p=0.061; Insulin effect main effect: F(1,136)=1.49, p=0.224; Sex/lactate interaction: F(1,136)=0.44, p=0.510; Sex/insulin interaction: F(1,136)=20.52, p<0.001; Lactate/insulin interaction: F(1,136)=0.21, p=0.649; Sex/lactate/insulin interaction: F(1,136)=3.34, p=0.070]. These sex-specific IIH-associated patterns of GPER mRNA expression were prevented by L-lactate infusion to the CV4. Meanwhile, INS treatment had no effect on GPER gene transcription in nGKRP-ir-negative A2 cells from either sex [F(7,136)=1.38, p=0.220; Sex main effect: F(1,136)=0.076, p=0.783; Lactate effect: F(1,136)=1.41, p=0.237; Insulin effect main effect: F(1,136)=0.30, p=0.584; Sex/lactate interaction: F(1,136)=0.33, p=0.569; Sex/insulin interaction: F(1,136)=0.98, p=0.324; Lactate/insulin interaction: F(1,136)=0.03, p=0.863; Sex/lactate/insulin interaction: F(1,136)=6.51, p=0.012].
Data in Table 1 show that plasma glucose levels were not significantly different between male versus female V/aCSF treatment groups. INS injection decreased circulating glucose to an equivalent extent in both sexes. L-lactate infusion to the CV4 did not alter baseline glucose profiles. In each sex, plasma glucose values did not differ between INS/aCSF versus INS/L-lactate groups.
Table 1.
Effect of Insulin Injection on Plasma Glucose Levels in Male versus Female Rats Infused into the Caudal Fourth Ventricle with L-Lactate or Vehicle
| Treatment Groups | ||||
|---|---|---|---|---|
| Sex | Va/aCSFc | INSb/aCSF | V/L-lactated | INS/L-lactate |
| Male | 116.0 ± 5.6e | 40.7 ± 2.7f | 119.3 ± 2.8 | 41.7 ± 1.6f |
| Female | 119.7 ± 4.1 | 46.0 ± 4.4f | 123.2 ± 4.4 | 45.17 ± 3.4f |
subcutaneous (sc) vehicle (V; sterile diluent) injection
sc injection of neutral protamine Hagedorn insulin (INS; 10.0 U/kg bw)
Intra-caudal fourth ventricular (CV4) infusion of vehicle, i.e. artificial cerebrospinal fluid (aCSF)
Intra-CV4 infusion of L-lactate (25 μM/2.0 μL/hr)
mean plasma glucose (mg/dL) +/− S.E.M. for n=6 rats sex per group
p<0.05 versus matched V-injected aCSF- or L-lactate-infused controls
Discussion:
Current research provides unique evidence that in each sex hindbrain A2 neurons that innervate the VMN exhibit hypoglycemia-responsive (nGKRP-ir-positive A2 neurons) or -refractory (nGKRP-ir-negative A2 neurons) noradrenergic transmission. Exogenous lactate infusion to the CV4 reversed sex-dimorphic adjustments in DβH gene transcription and sex-monomorphic augmentation of GCK and SUR-1 mRNAs in nGKRP-ir-positive A2 cells acquired from hypoglycemic rats. These A2 cells conceivably react to hypoglycemia-associated lactate deficiency by increasing GI or decreasing GE metabolic-sensory signaling in male versus female A2 neurons, respectively. Interestingly, DβH gene transcription in nGKRP-ir-negative A2 neurons is unaffected by IIH despite the presence of GCK and KATP sensors. Lactate-associated attenuation of ER gene responses to hypoglycemia in male (ERα and ERβ) and female (ERβ and GPER) nGKRP-ir-positive A2 neurons suggests that this substrate fuel may regulate A2 reactivity to IIH, in part, through control of ER-specific estradiol input to these cells. Further studies are needed to investigate the role of GKRP in assimilating metabolic cues into A2 noradrenergic transmission to the VMN, and to determine how bi-directional metabolic-sensory signaling by these neurons affects VMN target cell function.
Application here of retrograde neuron tracing and single-cell laser microdissection/multiplex qPCR techniques uniquely documents uniform expression of mRNAs encoding the metabolic sensors GCK and KATP in A2 neurons that innervate the VMN. In each sex, subsets of these A2 neurons are evidently responsive or refractory to cellular metabolic imbalance due to IIH, or alternatively, experience a disparate magnitude of adjustment in energy stability, as these two populations exhibit change versus no change in these gene profiles. As quantitative measures of change in mRNA expression do not constitute confirmation of parallel adjustments in gene product protein profiles, data here do not exclude the prospect that IIH may alter GCK and/or KATP subunit protein expression in the absence of change in gene transcription. It is intriguing to speculate whether nGKRP-ir-positive and nGKRP-ir-negative A2 neurons each engage in metabolic-sensory function, but report on different intensities, duration, and/or nature of cellular energy instability to the VMN. These distinct A2 cell populations may accordingly exhibit disparate time frames for transcription reactivity. As target mRNAs were analyzed here at a single time point, i.e. +1 hr after induction of hypoglycemia, the prospect remains that nGKRP-ir-negative A2 cells may show alterations in GCK and/or SUR-1 mRNA gene expression at later post-injection time points.
CV4 lactate infusion did not modify nGKRP-ir-positive or ir-negative A2 nerve cell GCK or SUR-1 gene expression in euglycemic male or female rats, but prevented hypoglycemic regulation of these gene profiles in nGKRP-ir-positive A2 neurons from each sex. Hypoglycemia-associated changes in astrocyte-derived substrate fuel stream to this A2 cell subpopulation evidently affect metabolic variables screened by GCK and KATP. A2 nerve cell monocarboxyate transporter-2 (MCT2) and glucose transporter-3 (GlUT3) proteins exhibit sex-dimorphic acclimation to IIH, resulting in bi-directional shifts in lactate uptake [Cherian and Briski, 2011; 2012]. Down- versus up-regulated MCT2 and GLUT3 proteins in hypoglycemic male rat A2 cells implies that glucose uptake may be augmented during IIH as compensation for diminished astrocyte lactate trafficking. Indeed, our studies support the view that glucose may be a primary energy source to A2 neurons cells during IIH, while decreased lactate uptake, alone or relative to glucose uptake, may be a critical manifestation of systemic glucose deficiency at the cellular level [Briski et al., 2009]. On the other hand, female A2 neurons exhibit elevated MCT2 protein content alongside sustained GLUT3 expression, indicating that the ratio of lactate:glucose utilized by A2 cells is increased in this sex, whereas this ratio is reduced in male. As A2 cells evaluated in the above-referenced work were not characterized by neuroanatomical projection, it can only be speculated that VMN-projecting A2 cells exhibit sex-specific MCT2 and GLUT3 expression patterns similar to those described above. It remains to be clarified how, during IIH, divergent adjustments in lactate uptake in male versus female A2 neurons each up-regulate GCK and SUR-1 mRNA profiles. Whereas exogenous lactate-mediated reversal of hypoglycemic up-regulation of these gene profiles likely reflects, in the male, restored volume of this substrate fuel stream, mechanisms by which putative amplification of lactate supply to female A2 neurons may abolish metabolic sensor gene responses to IIH are less clear. A substantial proportion of lactate trafficked from astrocytes to neurons is derived from glucose molecules after their passage through glycogen shunt [Schousboe et al., 2010]. Our studies show that glycogen turnover is a critical monitored variable that controls A2 nerve cell transmission [Alshamrani et al., 2020]. As lactate is internalized by astrocytes [Horvat et al., 2021], a plausible scenario in the current experimental context is that enhanced astrocyte lactate uptake during lactate infusion could, by as-yet-unknown mechanisms, stimulate astrocyte glycogen metabolism and storage, thereby promoting signaling of heightened energy reserves to neurons which could modulate metabolic sensor reactivity to IIH by upstream regulatory mechanisms.
Evidence here that retrograde tracer-labeled nGKRP-ir-positive A2 neurons exhibit concurrent DβH and metabolic sensor transcriptional reactivity to IIH implies that these cells convey metabolic regulatory cues to the VMN. The notion that metabolic cues drive nGKRP-ir-positive A2 cell DβH gene responses is bolstered by findings that exogenous lactate abolishes hypoglycemic patterns of DβH as well as GCK and SUR-1 gene transcription. Curiously, the direction of hypoglycemia-induced change in DβH gene expression in this A2 cell population is sex-dependent, as these transcripts are up- or down-regulated in cells from INS-injected male versus female rats, respectively. These data align with recent reports that IIH augments or inhibits A2 nerve cell DβH protein levels according to sex [Briski et al., 2020], and extend observations that VMN NA activity is elevated or diminished in hypoglycemic male versus female rats [Ali et al., 2019; Napit et al., 2019]. It is worth noting that in each sex, cellular profiles for transcripts encoding the rate-limiting catecholamine biosynthetic enzyme TH mirror that of DβH in terms of lactate-reversible sensitivity to IIH. Up- (male) versus down- (female) regulated patterns of DβH gene expression in A2 neurons that express IIH-sensitive metabolic-sensors may reflect signaling of lactate or net energy deficiency by GI versus GE metabolic-sensory transmission mode in male versus female, respectively. This premise raises the notable question of the factors that may establish metabolic signaling modes in each sex, including the role of gonadal steroids, and the corollary issue of whether baseline metabolic conditions are similar or different in GI versus GE neurons. The latter issue remains speculative as technology with requisite sensitivity for quantification of ATP in neurotransmitter-specific nerve cell tissue samples is not currently available. There is also a need to consider if amplified noradrenergic activity (e.g. increased GI signaling) in male versus diminution of this transmitter signal (e.g. decreased GE signaling) in female communicates similar or different metabolic information to the VMN.
GKRP regulates GCK enzyme activity and subcellular localization through formation of GKRP-GCK complexes [Agius, 2008; Agius 2016; Sternisha and Miller, 2019]. Glucose and GKRP compete for binding to GCK; GKRP-GCK complexes are formed when cellular glucose levels wane, deactivating bound GCK, and are translocated to the nucleus. GKRP expression occurs in the brain [Alvarez et al., 2002; Roncero et al., 2009], but the brain cell types that express this protein have not been identified. A novel discovery here is that in each sex, nuclear staining GKRP-ir is observed in a subpopulation of A2 neurons that innervate the VMN, and is a marker for metabolic sensor and catecholamine biosynthetic enzyme gene sensitivity to IIH regardless of GI versus GE mode of metabolic-sensory signaling. Observations of nGKRP-ir in A2 neurons from vehicle- and INS-injected rats align with reports that GKRP is primarily localized to the nucleus of cultured hepatocytes at both low and high glucose concentrations [de la Iglesia et al., 1999]. Ongoing research seeks to examine how GKRP control of GCK activity enables A2 cell sensitivity to metabolic regulatory cues. A plausible theory is that complexation and deactivation of unoccupied GCK by GKRP may create close coupling of active cytoplasmic GCK and glucose concentrations, thereby allowing a sensitive readout of cellular metabolizable glucose; alternatively, GKRP may regulate GCK activity by as-yet-undiscovered mechanisms.
Study outcomes show that VMN-projecting nGKRP-ir-positive A2 neurons exhibit sex-dependent alterations in ER variant gene expression (ERα, ERβ, and GPER profiles in males versus ERβ and GPER transcription in females) in response to IIH, and that these transcriptional responses are primarily reversible by lactate in each sex. The premise that hypoglycemia-associated alterations in lactate fuel stream may control A2 metabolic sensor and/or DβH gene responses to IIH, in part, by regulating ER-specific input to these cells will require further experimentation. It is unclear if sex-specific patterns of ER variant gene transcription determine whether nGKRP-ir-positive neurons, in each sex, signal hypoglycemia-associated metabolic imbalance by GI versus GE transmission mode. Observations here that IIH causes lactate-reversible up- versus down-regulated GPER gene expression in this A2 cell subtype support the possibility that sex-specific patterns of metabolic signaling may involve this ER variant.
It should be noted that the current study design does not rule out the prospect that elevated circulating insulin levels ensuing from sc injection may directly affect one or more experimental endpoints investigated here, aside from hypoglycemia per se, in one or both sexes. It remains to be established whether hyperinsulinemia may attenuate or amplify the impact of glucose deficiency on gene expression in nGKRP-ir-positive and/or nGKRP-ir-negative A2 neurons.
The current study utilized an ovariectomized, estradiol-treated animal model to standardize plasma estradiol levels in female study subjects at an equivalent physiological level corresponding to a specific stage of the estrous cycle. This steroid replacement paradigm circumvents the significant potential for confounding effects of dissimilar patterns of endogenous estradiol secretion that occur between various stages of the estrous cycle in ovary-intact adult female rats. Present outcomes justify investigation of the interesting question of whether estradiol output at peak (proestrus) versus nadir (metestrus) levels may differentially modulate A2 nerve cell target gene responses to hypoglycemia with or without lactate repletion.
A critical unanswered question that emerges from current work concerns the neurochemical identity and connectivity of VMN neurons in each sex that are innervated by GKRP-expressing A2 neurons. It would be enlightening to learn if VMN nerve cells that are targets for this input operate with local neural circuitries that control glucose counter-regulatory outflow. It would also be useful to discover if and by what receptor mechanisms estradiol may modulate VMN neuron receptivity to GKRP-dependent glucose-sensitive noradrenergic signaling.
In summary, present studies show that nGKRP-ir-positive hindbrain A2 noradrenergic neurons comprise a IIH-sensitive subpopulation providing innervation to the VMN, whereas nGKRP-ir-negative A2 nerve cell transmission to that structure is apparently refractory to this metabolic challenge. A2 nGKRP-ir-positive neurons in INS-injected male and female rats exhibit divergent, lactate-reversible adjustments in DβH gene expression, inferring that these cells may engage in GI versus GE metabolic-sensory transmission mode, respectively, in response to hypoglycemic patterns of lactate substrate fuel stream. Sex-specific lactate-sensitive ER transcriptional reactivity to IIH infers that lactate may control A2 metabolic sensor and DβH gene responses to IIH, in part, by regulating ER-specific estradiol signaling to these neurons. Further effort is required to elucidate the role of GKRP in assimilating metabolic cues into A2 noradrenergic transmission to the VMN, and to determine how bi-directional metabolic-sensory signaling by these neurons affects VMN target cell function. There is also a need for additional research to address whether lactate attenuates A2 nerve cell gene responses to hypoglycemia in its capacity as an energy source and/or by action as a volume transmitter on lactate receptor.
Abbreviations:
- 4-CIN
alpha-cyano-4-hydroxycinnamate
- AMPK
adenosine 5’-monophosphate-activated protein kinase
- DβH
dopamine-beta-hydroxylase
- DVC
dorsal vagal complex
- E
estradiol
- ER
estrogen receptor
- ERα
estrogen receptor-alpha
- ERβ
estrogen receptor-beta
- GCK
glucokinase
- GKRP
glucokinase regulatory protein
- GPER
G-protein-coupled estrogen receptor-1
- IIH
insulin-induced hypoglycemia
- -ir
-immunoreactive
- KATP
ATP-sensitive potassium channel
- NA
noradrenaline
- OVX
ovariectomy
- O.D.
optical density
- pAMPK
phosphoAMPK
- SUR-1
sulfonylurea receptor-1
- TH
tyrosine hydroxylase
- VMN
ventromedial hypothalamic nucleus
References:
- Agius L Glucokinase and molecular aspects of liver glycogen metabolism. Biochem J. 2008; 414: 1–18. doi: 10.1042/BJ20080595. [DOI] [PubMed] [Google Scholar]
- Agius L Hormonal and metabolite regulation of hepatic glucokinase. Annu. Rev. Nutr 2016; 36: 389–415. doi: 10.1146/annurev-nutr-071715-051145. [DOI] [PubMed] [Google Scholar]
- Alenazi FSH, Ibrahim BA, Briski KP. Estradiol regulates effects of hindbrain activator 5-aminoimidazole-4-carboxamide-riboside administration on hypothalamic adenosine 5’-monophosphate-activated protein kinase activity and metabolic neurotransmitter mRNA and protein expression. J. Neurosci. Res 2014; 93: 651–659. doi: 10.1002/jnr.23520. doi: 10.1002/jnr.23520. [DOI] [PubMed] [Google Scholar]
- Ali MH, Napit PR, Mahmood ASMH, Bheemanapally K, Alhamami HN, Uddin MM, Mandal KS, Ibrahim MMH, Briski KP. Hindbrain estrogen receptor regulation of ventromedial hypothalamic glycogen metabolism and glucoregulatory transmitter expression in the hypoglycemic male rat. Neuroscience 2019; 409:253–260. doi: 10.1016/j.neuroscience.2019.03.053. [DOI] [PMC free article] [PubMed] [Google Scholar]
- Alshamrani A, Bheemanapally K, Ibrahim MMH, Briski KP. Impact of caudal hindbrain glycogen metabolism on A2 noradrenergic neuron AMPK activation and ventromedial hypothalamic nucleus norepinephrine activity and glucoregulatory neuro-transmitter marker protein expression. Neuropeptides 2020; 82:102055. [DOI] [PMC free article] [PubMed] [Google Scholar]
- Briski KP, Koshy Cherian A, Genabai NK, Vavaiya KV. In situ coexpression of glucose and monocarboxylate transporter mRNAs in metabolic-sensitive dorsal vagal complex catecholaminergic neurons: transcriptional reactivity to insulin-induced hypoglycemia (IIH) and caudal hindbrain glucose or lactate repletion during IIH. Neuroscience 2009; 164: 1152–1160. [DOI] [PubMed] [Google Scholar]
- Briski KP, Ali MH, Napit PR. Sex-specific acclimation of A2 noradrenergic neuron dopamine-β-hydroxylase and estrogen receptor variant protein and 5’-AMP-activated protein kinase reactivity to recurring hypoglycemia in the rat. J. Chem. Neuroanat 2020; 109:101845. doi: 10.1016/j.jchemneu.2020.101845. [DOI] [PMC free article] [PubMed] [Google Scholar]
- Briski KP, Ali MH, Napit PR, Mahmood ASMH, Alhamyani AR, Alshamrani AA. Sex differences in ventromedial hypothalamic nucleus glucoregulatory transmitter biomarker protein during recurring insulin-induced hypoglycemia. Brain Struct. Funct 2021; 226(4):1053–1065. doi: 10.1007/s00429-021-02225-8. [DOI] [PMC free article] [PubMed] [Google Scholar]
- Briski KP, Marshall ES, Sylvester PW. Effects of estradiol on glucoprivic transactivation of catecholaminergic neurons in the female rat caudal brainstem. Neuroendocrinology 2001; 73: 369–377. [DOI] [PubMed] [Google Scholar]
- Briski KP, Patil GD. Induction of Fos immunoreactivity labeling in forebrain metabolic loci by caudal fourth ventricular administration of the monocarboxyate transporter inhibitor, α-cyano-4-hydroxycinnamic acid. Neuroendocrinology 2005; 82: 49–57. [DOI] [PubMed] [Google Scholar]
- Butcher RL, Collins WE, Fugo NW. Plasma concentrations of LH, FSH, progesterone, and estradiol-17beta throughout the 4-day estrous cycle of the rat. Endocrinology 1974; 94: 1704–1708. [DOI] [PubMed] [Google Scholar]
- Chaudhari P, Madaan A, Rivera JC, Charfi I, Habelrih T, Hou X, Nezhady M, Lodygensky G, Pineyro G, Muanza T, Chemtob S. Neuronal GPR81 regulates developmental brain angiogenesis and promotes brain recovery after a hypoxic ischemic insult. J. Cereb. Blood Flow Metab 2022; 271678X221077499. doi: 10.1177/0271678X221077499. [DOI] [PMC free article] [PubMed] [Google Scholar]
- Cherian A, Briski KP. Quantitative RT PCR and immunoblot analyses reveal acclimated A2 noradrenergic neuron substrate fuel transporter, glucokinase, phospho-AMPK, and dopamine-beta-hydroxylase responses to hypoglycemia. J. Neurosci. Res, 2011; 89: 1114–1124. doi: 10.1002/jnr.22632. [DOI] [PubMed] [Google Scholar]
- Cherian A, Briski KP. A2 noradrenergic nerve cell metabolic transducer and nutrient transporter adaptation to hypoglycemia: Impact of estrogen. J. Neurosci. Res 2012; 90: 1347–1358. doi: 10.1002/jnr.23032. [DOI] [PubMed] [Google Scholar]
- Cotero VE, Routh VH. Insulin blunts the response of glucose-excited neurons in the ventrolateral-ventromedial hypothalamic nucleus to decreased glucose. Amer. J. Physiol. Endocrinol. Metab 2009; 296(5): E1101–9. doi: 10.1152/ajpendo.90932.2008. [DOI] [PMC free article] [PubMed] [Google Scholar]
- de la Iglesia N, Veiga-da-Cunha M, Van Schaftingen E, Guinovart JJ, Ferrer JC. Glucokinase regulatory protein is essential for proper subcellular localization of liver glucokinase. FEBS Lett. 1999; 456: 332–338. 10.1016/S0014-5793(99)00971-0 [DOI] [PubMed] [Google Scholar]
- Donovan CM, Watts AG. Peripheral and central glucose sensing in hypoglycemic detection. Physiology 2014; 29: 314–324. doi: 10.1152/physiol.00069.2013. [DOI] [PMC free article] [PubMed] [Google Scholar]
- Genabai NK, Vavaiya KV, Briski KP. Adaptation of glucokinase gene expression in the rat dorsal vagal complex in a model for recurrent intermediate insulin-induced hypoglycemia: impact of gender. J. Mol. Neurosci 2009; 37: 80–86. doi: 10.1007/s12031-008-9126-y. [DOI] [PubMed] [Google Scholar]
- Gonzàlez JA, Reimann F, Burdakov D. Dissociation between sensing and metabolism of glucose in sugar sensing neurones. J. Physiol 2009; 587: 41–48. doi: 10.1113/jphysiol.2008.163410. [DOI] [PMC free article] [PubMed] [Google Scholar]
- Hardie DG, Lin SC. AMP-activated protein kinase – not just an energy sensor. F1000R 2017; 6: 1724. doi: 10.12688/f1000research.11960.1. [DOI] [PMC free article] [PubMed] [Google Scholar]
- Hardie DG, Schaffer BE, Brunet A. AMPK: An Energy-Sensing Pathway with Multiple Inputs and Outputs. Trends Cell Biol. 2016; 26(3): 190–201. doi: 10.1016/j.tcb.2015.10.013. [DOI] [PMC free article] [PubMed] [Google Scholar]
- Horvat A, Zorec R, Vardjan N. Lactate as an astroglial signal augmenting aerobic glycolysis and lipid metabolism. Front Physiol. 2021; 12: 735532. doi: 10.3389/fphys.2021.735532. [DOI] [PMC free article] [PubMed] [Google Scholar]
- Ibrahim BA, Briski KP. Role of dorsal vagal complex A2 noradrenergic neurons in hindbrain glucoprivic inhibition of the luteinizing hormone surge in the steroid-primed ovariectomized female rat: Effects of 5-thioglucose on A2 functional biomarker and AMPK activity. Neuroscience 2014; 269: 199–214. [DOI] [PMC free article] [PubMed] [Google Scholar]
- Ibrahim BA, Tamrakar P, Gujar AD, Koshy Cherian A, Briski KP. Caudal fourth ventricular administration of the AMPK activator 5-aminoimiazole-4-carboxamide-riboside regulates glucose and counterregulatory hormone profiles, dorsal vagal complex metabolosensory neuron function, and hypothalamic Fos expression. J. Neurosci. Res 2013; 91: 1226–1238. [DOI] [PubMed] [Google Scholar]
- Lin SC, Hardie AMPK: Sensing glucose as well as cellular energy status. Cell Metab. 2018; 27: 299–313. doi: 10.1016/j.cmet.2017.10.009. [DOI] [PubMed] [Google Scholar]
- Livak KJ, Schmittgen TD. Analysis of relative gene expression data using real-time quantitative PCR and the 2−Delta Delta C(t) method. Methods 2001; 25:402–408. [DOI] [PubMed] [Google Scholar]
- Matschinsky F, Wilson DF. The central role of glucokinase in glucose homeostasis: A perspective 50 years After demonstrating the presence of the enzyme in Islets of Langerhans. Front. Physiol 2019; 10:148. doi: 10.3389/fphys.2019.00148. [DOI] [PMC free article] [PubMed] [Google Scholar]
- Mizuno Y, Oomura Y. Glucose responding neurons in the nucleus tractus solitarius of the rat: in vitro study. Brain Res. 1984; 307:109–116. [DOI] [PubMed] [Google Scholar]
- Napit PR, Ali MH, Shakya M, Mandal SK, Bheemanapally K, Mahmood ASMH, Ibrahim MMH, Briski KP. Hindbrain estrogen receptor regulation of counter-regulatory hormone secretion and ventromedial hypothalamic nucleus glycogen content and glucoregulatory transmitter signaling in hypoglycemic female rats. Neuroscience 2019; 411: 211–221. doi: 10.1016/j.neuroscience.2019.05.007. [DOI] [PMC free article] [PubMed] [Google Scholar]
- Nedungadi TP, Briski KP. Site-specific effects of intracranial estradiol administration on recurrent insulin-induced hypoglycemia in the ovariectomized female rat. Neuroendocrinology. 2012;96(4):311–23. doi: 10.1159/000338407. [DOI] [PubMed] [Google Scholar]
- Oomura Y, Yoshimatsu H. Neural network of glucose monitoring system. J. Auton. Nerv. Syst 1984; 10: 359–372. [DOI] [PubMed] [Google Scholar]
- Patil GD, Briski KP. Transcriptional activation of nucleus tractus solitarii/area postrema catecholaminergic neurons by pharmacological inhibition of caudal hindbrain monocarboxylate transporter function. Neuroendocrinology 2005a; 81:96–102. [DOI] [PubMed] [Google Scholar]
- Patil GD, Briski KP. Lactate is a critical ‘sensed’ variable in caudal hindbrain monitoring of CNS metabolic stasis. Amer. J. Physiol. Regul. Integr. Physiol 2005b; 289: R1777–86. [DOI] [PubMed] [Google Scholar]
- Schousboe A, Sickmann HM, Walls AB, Bak LK, Waagepetersen HS. Functional importance of the astrocytic glycogen-shunt and glycolysis for maintenance of an intact intra/extracellular glutamate gradient. Neurotox. Res 2010; 18: 94–99. [DOI] [PubMed] [Google Scholar]
- Shrestha PK, Tanarkar P, Ibrahim BA, Briski KP. Hindbrain medulla catecholamine cell group involvement in lactate-sensitive hypoglycemia-associated patterns of hypothalamic norepinephrine and epinephrine activity. Neuroscience 2014; 278: 20–30. [DOI] [PubMed] [Google Scholar]
- Singh SR, Briski KP. Septopreoptic mu opioid receptor mediation of hindbrain glucoprivic inhibition of reproductive neuroendocrine function in the female rat. Endocrinology 2004; 145: 5322–5331. [DOI] [PubMed] [Google Scholar]
- Sternisha SM, Miller BG. Molecular and cellular regulation of human glucokinase. Arch Biochem Biophys. 2019; 663: 199–213. doi: 10.1016/j.abb.2019.01.011. [DOI] [PMC free article] [PubMed] [Google Scholar]
- Uddin MM, Ibrahim MMH, Briski KP. Glycogen phosphorylase isoform regulation of ventromedial hypothalamic nucleus glucoregulatory neuron 5’-AMP-activated protein kinase and transmitter marker protein expression. ASN Neuro 2021; 13:17590914211035020. doi: 10.1177/1759091421035020. [DOI] [PMC free article] [PubMed] [Google Scholar]
- Vavaiya KV, Briski KP. Caudal hindbrain lactate administration alters glucokinase, SUR1, and neuronal substrate fuel transporter gene expression in the dorsal vagal complex, lateral hypothalamic area, and ventromedial nucleus hypothalamus of hypoglycemic male rats. Brain Research 2007; 1176: 62–70. [DOI] [PubMed] [Google Scholar]
- Vavaiya KV, Briski KP. Effects of caudal hindbrain lactate infusion on insulin-induced hypoglycemia and neuronal substrate transporter glucokinase and sulfonylurea receptor-1 gene expression in the ovariectomized female rat dorsal vagal complex: Impact of estradiol. J. Neurosci. Res 2008; 86: 694–701. doi: 10.1002/jnr.21530. [DOI] [PubMed] [Google Scholar]
- Watts AG, Donovan CM. Sweet talk in the brain: glucosensing, neural networks, and hypoglycemic counterregulation. Front Neuroendocrinol 2010; 31:32–43. doi: 10.1016/j.yfrne.2009.10.006. [DOI] [PMC free article] [PubMed] [Google Scholar]
- Yettefti K, Orsini JC, Perrin J. Characteristics of glycemia-sensitive neurons in the nucleus tractus solitarii: possible involvement in nutritional regulation. Physiol. Behav 1997; 61: 93–100. [DOI] [PubMed] [Google Scholar]