Abstract
The aroma compositions and essential oil contents extracted from small cardamom (Elettaria cardamomum Maton) dried at three temperatures using a hot air convective dryer was studied by chromatographic methods. The major compounds in the dried samples were 1,8-cineole (7.23–11.76%) and α-Terpinyl acetate (61.65–68.19%) that were responsible for the specific aroma. The extracted essential oil was found to be majorly composed of alkenes (33–42%), alcohols (18–30%) and esters (18–22%) with acids, alkyls and ketones. The changes in esters and alcohols with drying time were more significant (p < 0.05) than acids, alkenes and aldehydes at all three temperatures. The data were analysed using Principal Component Analysis (PCA) and Hierarchical Cluster Analysis. The analyses indicated that the compounds varied significantly (p < 0.05) with drying temperatures. The PCA revealed that there was overall 66.47, 75.96 and 78.25% cumulative data variance among the constituents of essential oils of cardamom samples dried at 40, 50 and 60 °C respectively. The samples showed a significant (p < 0.05) reduction in aroma constituents after 26, 18 and 16 h of drying at 40, 50 and 60 °C respectively.
Supplementary Information
The online version contains supplementary material available at 10.1007/s13197-022-05560-8.
Keywords: Small cardamom, Essential oil, Principal component analysis
Introduction
Small cardamom (Elettaria cardamomum Maton) is a perennial tropical herb belonging to Zingibaraceae family, which is mostly confined to Guatemala, India, Sri Lanka, Tanzania, Uganda, and Laos. Cardamom is the third most expensive spice after saffron and vanilla. The essential oils are a complex mixture of secondary metabolites obtained from the aromatic plants that are responsible for aroma and flavour (Jena et al. 2021). Cardamom essential oil is reported to induce medicinal properties as it is considered to be antioxidant, anti-inflammatory, anticarcinogenic, antidiabetic, hypocholesterolemic, cardioprotective and antimicrobial properties (Ashokkumar et al. 2020a, b). Apart from its utilisation due to these medicinal values, cardamom essential oil is also widely consumed in food and flavouring industries.
The strength, colour and aroma of spices are responsible for primarily assessing quality of volatile essential oils (Rajpur and Samratha 2018). In case of cardamom, retention of green colour and aroma is the key deciding factor for the acceptability of cardamom in the domestic and international market. Cardamom capsules are usually dried using curing chambers at 50 °C for 28 to 32 h (Rajpur and Samratha 2018). Drying methods and conditions significantly affect the aroma and colour of cardamom. Mathematical modelling of colour and aroma kinetics small cardamom drying in a hot air convective dryer has been previously reported in our study (Mishra et al. 2021). However, the losses or changes in volatile compounds of cardamom is required to be analysed systematically in order to investigate the effects of different drying temperatures on the aroma of cardamom.
Chemometrics is described as the use of mathematical and statistical approaches to extract additional information from large datasets. Chemometrics is a crucial tool for unravelling patterns in complex chemical matrices. Also, statistical methods used for perplexing volume of data generated in flavour chemistry studies are recently gaining popularity due to high decoding capabilities. Generally, simple correlation techniques and univariate analysis like t-test or chi-square (χ2) are used to determine the statistical relationship and significance respectively. However, the complexity in experimental designs increases with the rising number of variable dependencies. Sophisticated approaches like multivariate analysis of variance (MANOVA) are required for decoding the influence of multiple covariates on a dependent variable. The multiple regression and discriminant analysis have emerged as two popular methods used for characterization of multivariate data in flavour chemistry (Sun et al. 2019; Makarichian et al. 2021). These are effective techniques used for interpretation on relative importance of gas chromatographic peaks and volatiles in the overall flavour response. Statistical methods with ability to classify large dataset are widely used in quality classification of commodities according to their aroma profiles, e.g., Principal component analysis (PCA), Hierarchical cluster analysis (HCA), and Linear discrimination analysis (LDA) among others. These methods work with the approach to simplify multivariate data by dimension reduction to reach discriminating ability. Multivariate studies are ideal for comparing complicated spectrum data, detecting patterns of compound co-occurrence, and revealing chemical compositional differences across samples.
The composition of small cardamom essential oil has been reported by many authors (Sardar et al. 2013; Husain and Ali 2014; Jena et al. 2021). However, previous studies have mainly focused on the overall composition of small cardamom essential oil, however, changes in cardamom aroma during the course of drying has been scarcely reported. Therefore, the present study was investigated to classify aroma and/or flavour profile of essential oil of small cardamom dried at different temperatures. To the best of our knowledge, the aroma dynamics of small cardamom with respect to drying time and temperature have not yet been reported in literature in order to select an optimum time–temperature combination for the maximum retention of aroma profile during a hot air convective drying. The changes in aroma with drying time and temperature was further discriminated and analysed using multivariate analyses i.e., PCA and HCA. This study would help in the further research on formation pathways of cardamom aroma compounds throughout drying, thereby making it possible to monitor or manage aroma generation by adjusting the drying conditions.
Material and methods
Sample procurement
Fresh green cardamom capsules of Njallani variety were harvested from a cardamom grower in Wayanad District, Kerala, India. In order to remove extraneous materials, the samples were immersed in a sodium meta-bisulphite solution (0.1% w/v) for 15 min immediately after procurement. The average length and diameter of small cardamom were found out to be 20.99 ± 3.06 mm and 14.31 ± 1.54 mm respectively. The moisture content of fresh cardamom was 78.02 ± 0.85% (wb).
Drying and essential oil extraction
The cardamom samples were dried in a lab-scale hot air oven (Jaisbo, Delhi) at a constant air velocity of 1.5 m.s−1 at 40, 50 and 60 °C. Aroma change was determined by collecting dried samples at regular drying time (DT) intervals i.e. 0, 13, 26, 39 and 52 h, 0, 9, 18, 21 and 36 h, and 0, 8, 16, 24 and 30 h at 40, 50 and 60 °C respectively. These time intervals were denoted as DT1, DT2, DT3, DT4 and DT5 respectively. These drying intervals were decided based on the total drying time required (52, 36, and 30 h at 40, 50 and 60 °C respectively) to bring the moisture content of the dried samples to a safe storage level of 12 ± 0.5% (wet basis) which was reported in our previous study (Mishra et al. 2021). The essential oils from raw and dried cardamom samples were extracted using hydro-distillation method (Mande and Sekar 2021) using Clevenger Apparatus by dispersing 25 g ground cardamom sample in 500 mL distilled water and allowing the process for 3 to 4 h until no more essential oil was obtained according to the European Pharmacopoeia (Conseil de l’ Europe 1996). The extracted condensed essential oil was collected in a volatile oil trap and was dehydrated over anhydrous Na2SO4 which was stored further in an amber glass vial at–20 °C until further analysis. The amount of essential oil was expressed as volume by dry solid mass (mL/100 g dry matter).
GC–MS analysis of aroma compounds
The essential oil composition of fresh and dried samples was identified by Gas chromatography-mass spectrometry (Shimadzu QP2010 Ultra High-End GC–MS system) equipped with low polarity, Crossband 1,4-bis (dimethylsiloxy) phenylene dimethyl polysiloxane based Rxi-5Sil MS Column (30 m × 0.25 mm internal diameter, film thickness 0.25 μm) and coupled with Shimadzu QP2010 mass spectrometer. Helium was used as carrier gas at a total flow rate of 1.0 mL min−1 and inlet temperature was adjusted to 260v °C. The gradient temperature for the essential oil composition analysis was set as: initial oven temperature was 50 °C, then was elevated to 210 °C at the rate of 3 °C min−1, then was retained for 2 min, and finally raised to 281 °C at the rate of 8 °C min−1, and maintained for 2 min. The HP quadruple MS was operated in EI mode and scanned at 70 eV over a range of m/z 40–650. The rod temperature was 220 °C and interface temperature was 270 °C. The aroma compounds were identified by comparing their mass spectra and retention indices with those available in NIST14/Wiley8 library attached to GC/MS analyser, and further confirmed using published literature. Peak area normalisation method was used to quantify each constituent.
Classification of components as per functional group
Cardamom essential oil were grouped into various functional groups such as alcohol, aldehydes, alkenes, esters, acids, and ketones based on their chemical structure. Then these respective percentage contributions were put into radar chart by using Origin pro of version 2020.
Multivariate data analysis using PCA and HCA
The data obtained in this study was subjected to two commonly used chemometric techniques, i.e., principal component analysis (PCA) and hierarchical clustering analysis (HCA). The constituents obtained using GC–MS was subjected to classification based on the type of functional groups and the classified data used for both PCA and HCA. PCA was used to establish a relationship between the small cardamom compounds and the interaction between the drying variables (temperature and duration). While HCA was used to classify the small cardamom compounds in a given sample set, where the drying variables were used to define these compounds by their similarities. In the present study, the PCA was carried out using Minitab 18 and the HCA was conducted using Origin 2022 software.
Statistical analysis
All experiments were performed in triplicates and the results were expressed as mean ± standard error. Significant difference was evaluated using one-way analysis of variance (ANOVA) followed by the Duncan's multiple-range tests with a 95% confidence level (p < 0.05). All statistical analyses were carried out using Minitab 18.
Result and discussion
Quantification of essential oil components
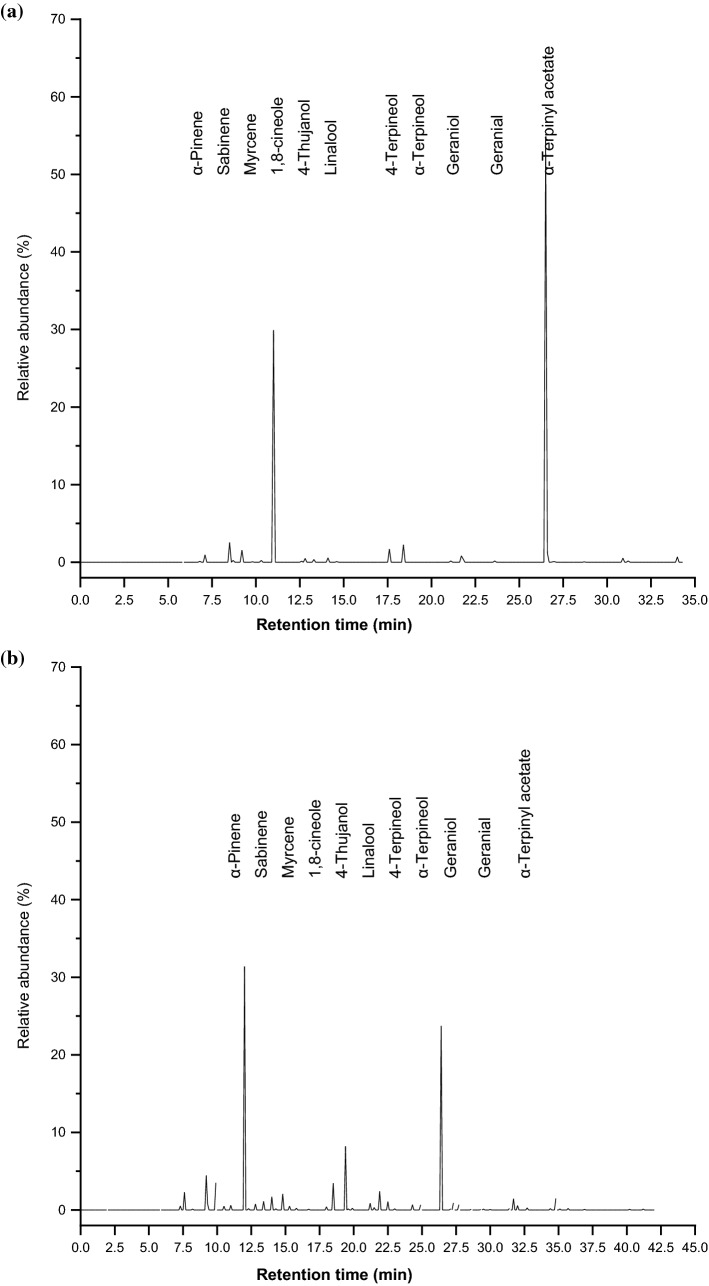
Figure 1 shows the images of raw and samples dried small cardamom samples at three temperatures. The aroma profiles of essential oils of the cardamom samples collected at different time intervals upon the drying at 40, 50 and 60 °C were analysed using GC–MS technique. The volatile analysis of essential oil of the freshly harvested cardamom samples resulted in the identification of 27, 50 and 54 aroma components those were classified according to their functional groups such as alkene, alcohol, ester, aldehyde, acid, alkyls and ketones (Table S1, S2 and S3). Figure 2a–c show a typical chromatogram of fresh small cardamom essential oil hat was further used for drying experiments at 40, 50 and 60 °C, respectively. The values of each component in Table S1, S2 and S3 were the relative peak areas of the total area of all constituents’ peaks. Although fresh small cardamom samples were collected from a single farmer and from a specific location, the variation in the number of volatile components in each sample could be attributed to cultivar, cultivation and harvesting conditions, including, geographic origin of plant, soil and climatic conditions, maturity stage of capsules, season of harvesting and methods of processing (Ashokkumar et al. 2020a; 2021). Further, it was observed that the essential oil constituents significantly (p < 0.05) changed with increasing drying temperature and duration. The release of volatile compounds intensified as the drying conditions changed from mild to severe. These changes leading to decrease or increase in oil constituents with drying time was owed to esterification, oxidation and/or hydrolysis (Munda et al. 2018a; Sun et al. 2019). Similar increase in the content of essential oil constituents with drying as compared to their fresh counterparts, was observed for spices like dried coriander ariel parts (Ghasemi Pirbalouti et al. 2017), oregano leaves (Caputo et al. 2022) and Zanthoxylum myriacanthum (makwhaen) dried fruits (Sriwichai et al. 2019).
Fig. 1.
Fresh and dried small cardamom samples
Fig. 2.
Gas chromatogram of essential oil obtained from small cardamom drying at a 40 °C, b 50 °C, and c 60 °C
The most prevalent components in most of the small cardamom samples at almost all drying conditions was found to be 1,8-cineole and α-Terpinyl acetate. These components have been reported to be responsible for the specific aroma of small cardamom (Ashokkumar et al. 2020a, b; 2021). These results were in agreement with a study on chemical compositions of essential oils of small cardamom produced in three different zones of Cardamom Hill Reserve of Idukki district in Kerala, India (Oommen et al. 2018). Here, the authors quantified the contents of 1,8-cineole and α-terpinyl acetate in the range of 25.51–27.14% and 45.18–45.95% respectively. Another study conducted by Alagupalamuthirsolai et al. (2020) also reported about 29.0–41.6% of α-terpinyl acetate, 26.4–43.9% of 1,8-cineole, 3.9–6.4% of α-terpineol and 1.5–11.1% of linalool of the total essential oil components in six cardamom genotypes collected from three ecotypes of Western Ghats, India.
Classification of essential oil components
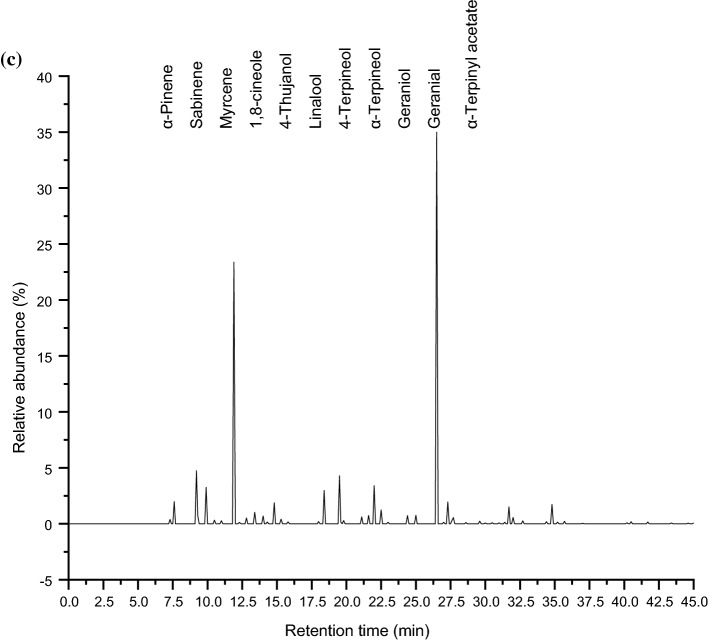
As can be interpreted from Fig. 3, small cardamom essential oil is mainly composed of esters, alcohols and alkenes contributing a major portion of aroma i.e., around 18–22%, 18–30%, 33–42% respectively (Fig. 3) in the fresh cardamom oil. Other aroma compounds found in the essential oil were acids, alkyls and ketones. As depicted in Fig. 3, the change in esters and alcohols with drying time were more significant than acids, alkenes and aldehydes at all three temperatures.
Fig. 3.
Radar chart of chemical compounds of essential oil obtained from small cardamom drying at a 40 °C, b 50 °C, and c 60 °C at different drying intervals
Cardamom oil contains a greater number of alkenes; however, their contribution is less towards the aroma. Alkene is a hydrocarbon containing a carbon–carbon double bond. Sabinene (an alkene) was reported to a major aroma component in cardamom essential oil (Alagupalamuthirsolai et al. 2020). It is a natural bicyclic monoterpene, one of the chemical compounds that also contributes to the spiciness of black pepper (Dosoky et al. 2019). In the present study, sabinene was found to be in the range of 2.53–4.75%. Second major aroma contributing compound was alcohol, amounting to approximately 18–30%. 1,8-cineole was found to be the second main alcoholic volatile constituent of cardamom essential oil. As per Paul et al. (2020), 1,8-cineole added camphorous note to the cardamom aroma and is an important ingredient which is reported in preventing the deadly Alzheimer disease. In our study, the content of 1,8-cineole decreased from 29.92 to 28.83, 31.38 to 27.12 and 23.38 to 19.18 when small cardamom was dried at 40, 50 and 60 °C respectively. Esters are another significant aroma constituents which amounted for about 18–22% accounting for the cardamom aroma. Interestingly, the concentration of esters suffered a significant upward trend as drying air temperature increased. This is probably because the drying process promoted the esterification reaction of alcohols, reducing alcohol content and increasing content of esters (Munda et al. 2018b; Sun et al. 2019). Terpinyl acetate and geranyl acetate are monoterpene ester which decides the sweetness of the essential oil. Terpinyl acetate, being one of the primary aroma constituent of cardamom essential oil, is an commercially important fragrance molecule with herbaceous floral and lavender odor (Vaičiulytė et al. 2021). The relative content of terpinyl acetate was observed to increase with the increase in drying time at three temperatures; however, it slightly decreased at 60 °C. Aldehydes contributed a range of 11–18% towards small cardamom aroma. Notably, there is release of more aldehydes with drying time. Geranial and neral both generated during the oxidation process of geraniol (an alcohol), but notably the former was found to decrease and the later was found to increase with drying time. Similar results have been reported by Wang et al., (2021) while drying black cardamom using an electro-thermostatic blast oven from 25 to 100 °C. According to the authors, high drying temperatures (85 °C and 100 °C) produced dried samples richer in monoterpene hydrocarbons, but lower temperatures yielded (E)-2 unsaturated aldehydes. Apart from this, some other compounds that had less contribution towards the cardamom aroma are acid, alkyls, and ketones. However, these compounds did not present a regular trend and did not exhibit significant variation after drying in the present study. This phenomenon is probably due to various isomerization, degradation, and rearrangement reactions of these compounds taking place during the process of dying (Gong et al. 2004).
Multivariate analysis of chemometric data
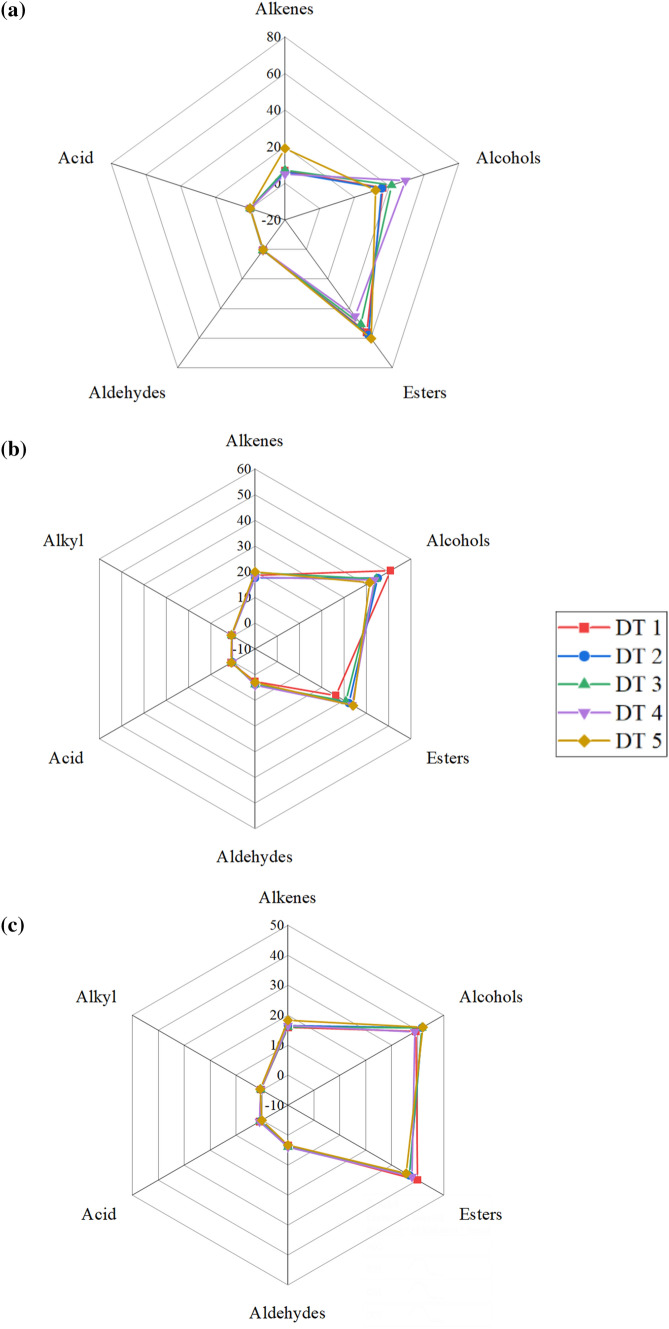
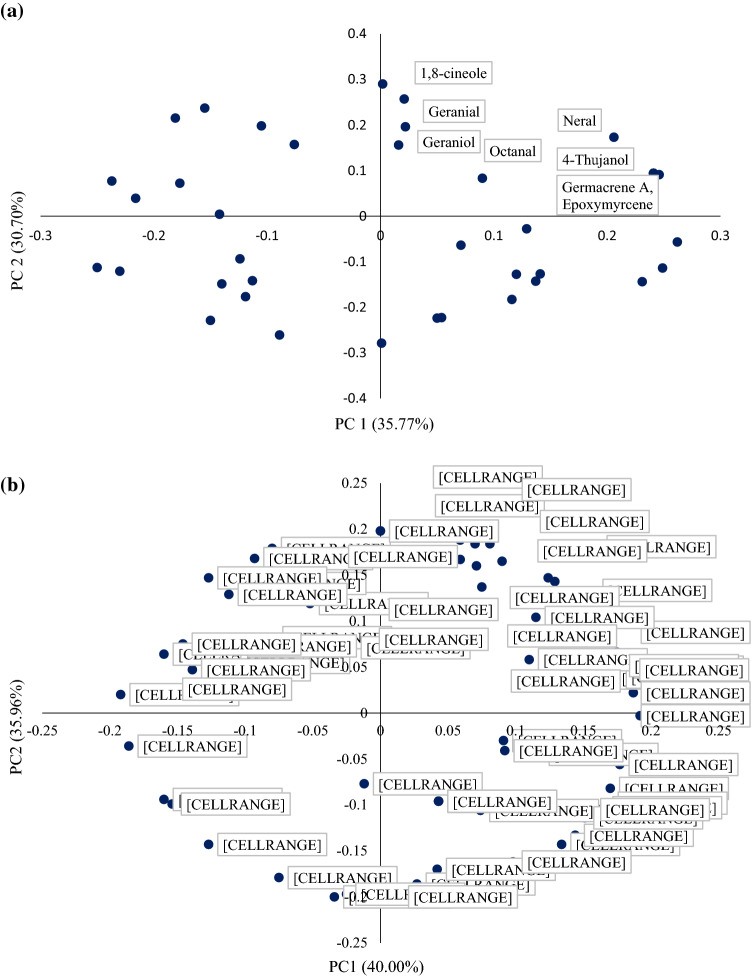
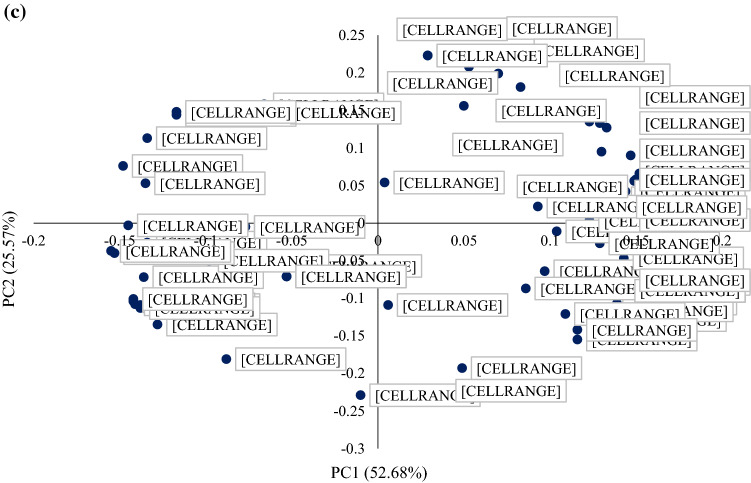
Principal component analysis (PCA) of small cardamom aroma compounds obtained at different drying times and temperatures is depicted in Fig. 4. The loading plot of the compounds at all three temperatures shows that esters, alcohols, and alkenes were the majorly affected compounds of small cardamom with increasing drying time. A clear separation was observed based on the first two principal components (PC1 and PC2), which accounted for the following variance in data- 66.47% (PC1 = 35.77% and PC2 = 30.70%) for 40 °C, 75.96% (PC1 = 40.00% and PC2 = 35.96%) for 50 °C and 78.25% (PC1 = 52.68% and PC2 = 25.57%) for 60 °C. The coefficients with higher positive values were taken into consideration as a significant factor. At 40 °C, significant changes in aromatic compounds are due to neral, germacrene and thujanol. Similarly, at 50 °C and 60 °C, the significant changes owed to compounds- α-terpinyl acetate, trimethyltrideca, germacrene; and cadinene, trimethyltrideca, panasinsen respectively.
Fig. 4.
PCA loading plot of essential oil constituents obtained from small cardamom drying at a 40 °C, b 50 °C, and c 60 °C
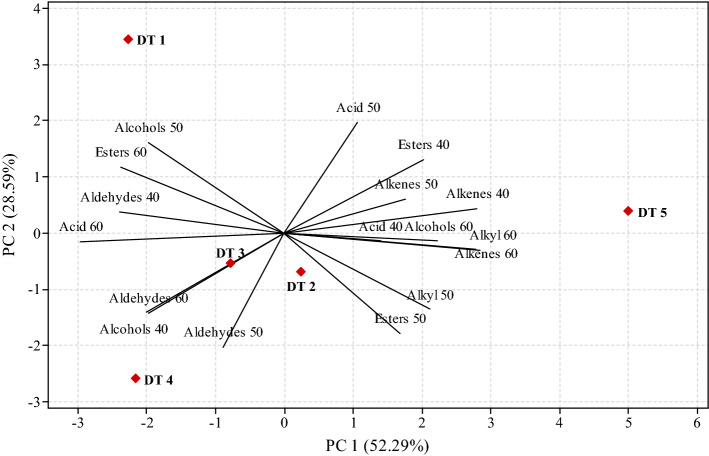
Figure 5 illustrates the variation in aroma compounds of small cardamom essential oil with drying time at 40, 50 and 60 °C. PC1 and PC2 accounted for 52.29 and 28.59% of total variance respectively. The plot clearly depicted the highest variation during the final stages of drying, i.e., in the samples collected in the final drying times (DT5). The highest variation was owed to compounds esters and alkenes, alkenes and alcohols at 40 °C, 50 °C and 60 °C respectively. These results were in agreement with the results obtained in this study.
Fig. 5.
PCA biplot of small cardamom essential oil compounds with different drying times
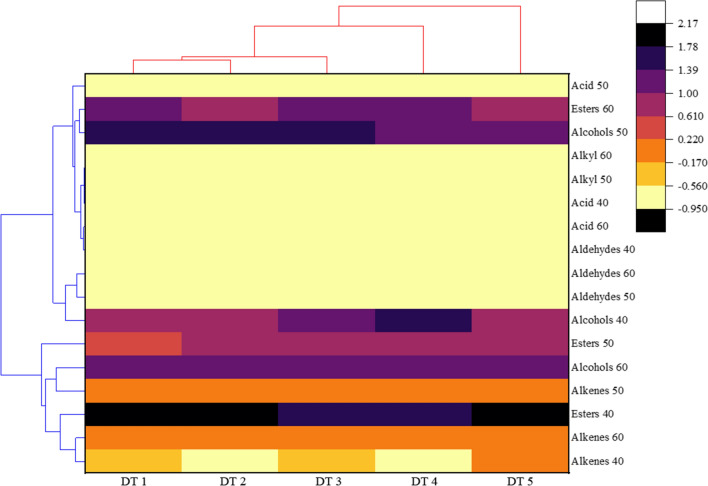
HCA analysis was carried out for the aromatic compounds obtained from cardamom samples with increasing drying times (DT1 to DT5) at three temperatures (40, 50 and 60 °C) and clear separation of drying times was obtained in the HCA-heatmap dendrogram (Fig. 6). Highest similarity level and shortest distance method were adopted to identify more similar and closer observations in each cluster. At 40 °C, aroma components of fresh cardamom showed similarity with the components obtained at 13 h drying time and placed farthest distance that of the final dried cardamom. But this was not the case with the samples dried at 50 °C. The aroma components released at 18 h and 21 h drying time had the similarity. However, at 60 °C, the flavours released at 8 h and 16 h, and 24 h and 30 h of drying time placed into two groups indicating a clear separation from the flavours of essential oils obtained from the fresh cardamom samples.
Fig. 6.
HCA-heatmap dendrogram for essential oil compounds obtained from small cardamom drying at different drying times and temperatures
Li et al. (2021) evaluated the effect of different drying times on aroma profile of garlic seasoning powder and identified 49 volatile compounds in the dried samples using GC–MS analysis. Based on the data obtained, the authors used PCA and HCA techniques to establish that all both raw and dried samples possessed different volatile flavour profiles and presented different sensory behaviour during the drying. Apart from the drying studies, PCA and HCA has also been used to characterize spices based on other parameters. For instance, Farag et al. (2020) classified saffron based on their freshness, origin and roasting indices and Zhang et al. (2022) characterized three kinds of ginger oil in Xilin fire ginger (ginger essential oil, ginger oleoresin extracted with petroleum ether, and ginger oleoresin extracted with absolute ethanol).
Conclusion
To investigate the effects of different drying times on the aroma constituents of small cardamom during hot air convective drying were analysed by gas chromatography-mass spectrometry. 1,8-cineole (> 25%) and α-Terpinyl acetate (> 25%) were major dominating components present in most samples, hence responsible for small cardamom aroma. The release of number of volatile components were enhanced during the drying process. Volatile analysis of fresh cardamom essential oil resulted identification of about 27, 50 and 54 components which were further used for drying experiments at 40, 50 and 60 °C. These compounds were classified according to their functional groups: alkene, alcohol, ester, aldehyde, acid, alkyls and ketones. The PCA loading plot of the compounds at all three temperatures shows that esters, alcohols and alkenes were the majorly affected compounds of small cardamom with increasing drying time. Small cardamom shows a reduction of essential oil constituents after 26, 18 and 16 h of drying when dried at 40, 50 and 60 °C. The chemometrics combined with multivariate statistical techniques provides a detailed profiling of the difference in aroma compounds of small cardamom samples dried at different drying conditions. These results would provide an optimum drying conditions that would help in better retention of aroma compounds of small cardamom during drying.
Supplementary Information
Below is the link to the electronic supplementary material.
Acknowledgements
Financial support of Science and Engineering Research Board (Sanction No. YSS/2015/001756), Ministry of Science and Technology, Govt. of India to carry out the current research is highly acknowledged.
Abbreviations
- ANOVA
Analysis of variance
- DT
Drying time
- h
Hour
- HCA
Hierarchical cluster analysis
- LDA
Linear discrimination analysis
- PC
Principal component
- PCA
Principal component analysis
Author contributions
SM: Conceptualization, Experimentation, Data Curation, Data Analysis, Writing, Editing, and Reviewing; JKS: Supervision, Editing, Reviewing, and Resource arrangement; NS: Date Analysis, Editing, and Reviewing; NS: Experimentation and Data curation.
Funding
Science and Engineering Research Board (Sanction No. YSS/2015/001756), Ministry of Science and Technology, Govt. of India.
Data availability
All data points are included in Table and Figure forms. They will be made available on request.
Declarations
Conflict of interest
There is no conflict of interest to declare.
Footnotes
Publisher's Note
Springer Nature remains neutral with regard to jurisdictional claims in published maps and institutional affiliations.
References
- Alagupalamuthirsolai M, Sivaranjani R, Ankegowda SJ, et al. A study of essential oil constituents from capsules, physiological and quality parameters of small cardamom ecotypes [Elettaria cardamomum (L.) Maton] growing in the Western Ghats, India. J Essent Oil Bear Plants. 2020 doi: 10.1080/0972060X.2020.1869105. [DOI] [Google Scholar]
- Ashokkumar K, Murugan M, Dhanya MK, Warkentin TD. Botany, traditional uses, phytochemistry and biological activities of cardamom [Elettaria cardamomum (L) Maton]–A critical review. J Ethnopharmacol. 2020;246:112244. doi: 10.1016/j.jep.2019.112244. [DOI] [PubMed] [Google Scholar]
- Ashokkumar K, Murugan M, Dhanya MK, Raj S, Kamaraj D. Phytochemical variations among four distinct varieties of Indian cardamom Elettaria cardamomum (L.) Maton. Nat Prod Res. 2020;34(13):1919–1922. doi: 10.1080/14786419.2018.1561687. [DOI] [PubMed] [Google Scholar]
- Ashokkumar K, Vellaikumar S, Murugan M, Dhanya MK, Ariharasutharsan G, Aiswarya S, Karthikeyan A. Essential oil profile diversity in cardamom accessions from southern India. Front Sustain Food Syst. 2021;5:137. doi: 10.3389/fsufs.2021.639619. [DOI] [Google Scholar]
- Caputo L, Amato G, de Bartolomeis P, De Martino L, Manna F, Nazzaro F, Barba AA. Impact of drying methods on the yield and chemistry of Origanum vulgare L. essential oil. Sci Rep. 2022;12(1):1–11. doi: 10.1038/s41598-022-07841-w. [DOI] [PMC free article] [PubMed] [Google Scholar]
- Dosoky NS, Satyal P, Barata LM, et al. Volatiles of black pepper fruits (Piper nigrum L.) Molecules. 2019 doi: 10.3390/MOLECULES24234244. [DOI] [PMC free article] [PubMed] [Google Scholar]
- Farag MA, Hegazi N, Dokhalahy E, Khattab AR. Chemometrics based GC-MS aroma profiling for revealing freshness, origin and roasting indices in saffron spice and its adulteration. Food Chem. 2020;331:127358. doi: 10.1016/j.foodchem.2020.127358. [DOI] [PubMed] [Google Scholar]
- Ghasemi Pirbalouti A, Salehi S, Craker L. Effect of drying methods on qualitative and quantitative properties of essential oil from the aerial parts of coriander. J Appl Res Med Aromat Plants. 2017;4:35–40. doi: 10.1016/J.JARMAP.2016.07.006. [DOI] [Google Scholar]
- Gong F, Fung YS, Liang YZ. Determination of volatile components in ginger using gas chromatography− mass spectrometry with resolution improved by data processing techniques. J Agri Food Chem. 2004;52(21):6378–6383. doi: 10.1021/jf040102z. [DOI] [PubMed] [Google Scholar]
- Husain SS, Ali M. Analysis of volatile oil of the fruits of Elettaria cardamomum (L.) maton and its antimicrobial activity. World J Pharm Pharm Sci. 2014;3:1798–1808. [Google Scholar]
- Jena S, Ray A, Sahoo A, et al. Chemical composition and antioxidant activities of essential oil from leaf and stem of elettaria cardamomum from Eastern India. J Essent Oil-Bearing Plants. 2021;24:538–546. doi: 10.1080/0972060X.2021.1937335. [DOI] [Google Scholar]
- Li K, Zhan P, Tian H, Wang P, Ji Y. Effects of drying time on the aroma of garlic (Allium sativum L.) seasoning powder. Flav Frag J. 2021;36(1):99–110. doi: 10.1002/ffj.3620. [DOI] [Google Scholar]
- Makarichian A, Amiri Chayjan R, Ahmadi E, Mohtasebi SS. Assessment the influence of different drying methods and pre-storage periods on garlic (Allium Sativum L.) aroma using electronic nose. Food Bioprod Process. 2021;127:198–211. doi: 10.1016/j.fbp.2021.02.016. [DOI] [Google Scholar]
- Mande P, Sekar N. Comparative study of chemical composition, antibacterial and antioxidant activity of essential oils isolated from the seeds of Amomum subulatum by using microwave extraction and hydro-distillation methods. J Indian Chem Soc. 2021;98(11):100201. doi: 10.1016/j.jics.2021.100201. [DOI] [Google Scholar]
- Mishra S, Sahu JK, Sanwal N, Sharma N. Hot air convective drying of small cardamom (Elettaria cardamomum Maton): Evaluation of drying, color, and aroma kinetics. J Food Process Eng. 2021;44:e13649. doi: 10.1111/JFPE.13649. [DOI] [Google Scholar]
- Munda S, Dutta S, Haldar S, Lal M. Chemical analysis and therapeutic uses of ginger (Zingiber officinale Rosc.) essential oil: a review. J Essent Oil-Bear Plants. 2018;21:994–1002. doi: 10.1080/0972060X.2018.1524794. [DOI] [Google Scholar]
- Munda S, Saikia P, Lal M. Chemical composition and biological activity of essential oil of Kaempferia galanga: a review. J Essent Oil Res. 2018;30(5):303–308. doi: 10.1080/10412905.2018.1486240. [DOI] [Google Scholar]
- Oommen M, Reivax X, Vadiraj BA, Suresh Kumar PM, Remashree AB. Quality appraisal of small cardamom (Elettaria cardamomum Maton) sourced from A, B and C Zones of CHR in Idukki district of Kerala, India. J Essen Oil Bear Plants. 2018;21(5):1315–1326. doi: 10.1080/0972060X.2018.1538821. [DOI] [Google Scholar]
- Paul K, Ganguly U, Chakrabarti S, Bhattacharjee P. Is 1,8-Cineole-Rich extract of small cardamom seeds more effective in preventing alzheimer’s disease than 1,8-Cineole Alone? Neuromolecular Med. 2020;22:150–158. doi: 10.1007/S12017-019-08574-2. [DOI] [PubMed] [Google Scholar]
- Conseil de l’ Europe (1996) Pharmacop’e Europ’enne. Sainte Ruffine
- Rajpur A, Samratha K. Cardamom: a multipurpose species in food and commercial needs. In: Mohana Roopan S, Madhumitha G, editors. Bioorganic phase in natural food: an overview. Cham: Springer; 2018. pp. 89–102. [Google Scholar]
- Sardar BR, Tarade KM, Singhal RS. Stability of active components of cardamom oleoresin in co-crystallized sugar cube during storage. J Food Eng. 2013;117:530–537. doi: 10.1016/J.JFOODENG.2013.03.035. [DOI] [Google Scholar]
- Sriwichai T, Sookwong P, Siddiqui MW, Sommano SR. Aromatic profiling of Zanthoxylum myriacanthum (makwhaen) essential oils from dried fruits using different initial drying techniques. Ind Crop Prod. 2019;133:284–291. doi: 10.1016/j.indcrop.2019.03.031. [DOI] [Google Scholar]
- Sun Y, Zhang M, Bhandari B, Yang P. Intelligent detection of flavor changes in ginger during microwave vacuum drying based on LF-NMR. Food Res Int. 2019;119:417–425. doi: 10.1016/j.foodres.2019.02.019. [DOI] [PubMed] [Google Scholar]
- Vaičiulytė V, Ložienė K, Švedienė J, et al. α-terpinyl acetate: occurrence in essential oils bearing thymus pulegioides, phytotoxicity, and antimicrobial effects. Molecules. 2021 doi: 10.3390/MOLECULES26041065. [DOI] [PMC free article] [PubMed] [Google Scholar]
- Wang J, Li Y, Lu Q, et al. Drying temperature affects essential oil yield and composition of black cardamom (Amomum tsao-ko) Ind Crops Prod. 2021;168:113580. doi: 10.1016/J.INDCROP.2021.113580. [DOI] [Google Scholar]
- Zhang L, Wang H, Tang X, Lu S, Tan Y, Li Q, Wu J. Characterization of aroma volatiles in xilin fire ginger oils by HS-SPME-GC-MS. Intl J Food Prop. 2022;25(1):53–64. doi: 10.1080/10942912.2021.2019267. [DOI] [Google Scholar]
Associated Data
This section collects any data citations, data availability statements, or supplementary materials included in this article.
Supplementary Materials
Data Availability Statement
All data points are included in Table and Figure forms. They will be made available on request.


