

Summary
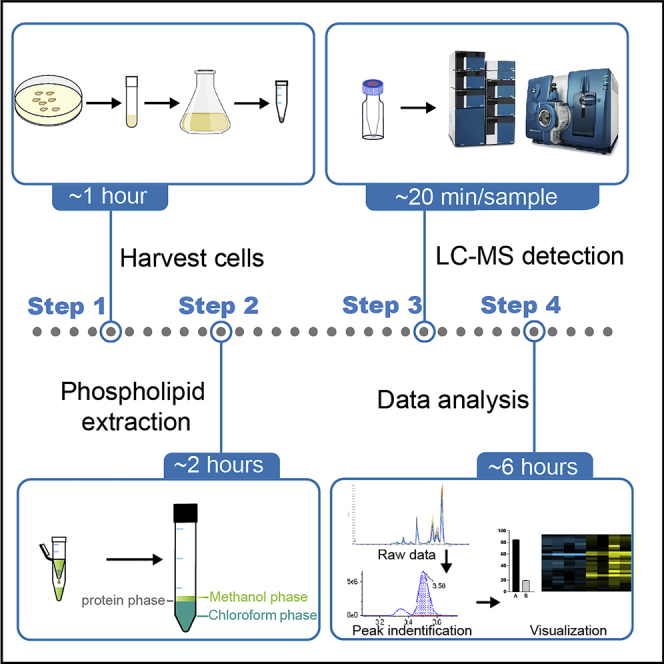
We describe a protocol for measuring phospholipid class and fatty acid composition in the budding yeast Saccharomyces cerevisiae using a liquid chromatography-mass spectrometry (LC-MS)-based approach. We compile a mass spectral-retention time library verified for major phospholipids in the budding yeast and showcase the profiling process of phospholipid compositions in mutants with defective syntheses of phosphatidylethanolamine (PE) and phosphatidylcholine (PC). We further provide methods for extracting and quantifying phospholipids in mammalian systems.
For complete details on the use and execution of this protocol, please refer to Fang et al. (2022).
Subject areas: Cell biology, Metabolomics, Model organisms, Mass spectrometry
Graphical abstract
Highlights
-
•
LC-MS-based analysis of phospholipid (PL) compositions from various sample types
-
•
PL extraction is optimized for a targeted MS method for phospholipid analysis
-
•
PL mutants confirm a mass spectral-retention time library for quantitative accuracy
Publisher’s note: Undertaking any experimental protocol requires adherence to local institutional guidelines for laboratory safety and ethics.
We describe a protocol for measuring phospholipid class and fatty acid composition in the budding yeast Saccharomyces cerevisiae using a liquid chromatography-mass spectrometry (LC-MS)-based approach. We compile a mass spectral-retention time library verified for major phospholipids in the budding yeast and showcase the profiling process of phospholipid compositions in mutants with defective syntheses of phosphatidylethanolamine (PE) and phosphatidylcholine (PC). We further provide methods for extracting and quantifying phospholipids in mammalian systems.
Before you begin
Because phospholipids are amphipathic molecules, their extraction requires a mixture of polar and nonpolar organic solvents. In this protocol, we adapt a widely used method using chloroform/methanol (2:1, v/v) as the extraction solvent (Bligh and Dyer, 1959; Folch et al., 1957). Adding the weak acid citric acid provides an acidic condition favorable for extracting a spectrum of phospholipids without undesirable lipid hydrolysis (Ye et al., 2013; Zhao and Xu, 2010). Detailed extraction methods herein are described for yeast cells, serum, mammalian cells, and tissue samples. Phospholipid molecular classes are separated chromatographically and quantified by a multiple reaction monitoring (MRM)-based targeted method using commercially available lipid internal standards. Peak identification for each phospholipid species is performed according to the information on retention time. We employ a traditional approach to annotating peaks based on phospholipid structural information, such as the phospholipid class, total carbon numbers of fatty acids, and double bonds. We also use yeast phospholipid mutants to confirm peak identity.
Preparation of culture medium
Timing: ∼20 min
This step describes how to prepare yeast culture medium.
Prepare yeast cell growth medium. Synthetic defined (SD) medium is used in this protocol as described in the “materials and equipment” section.
Preparation of phospholipid extraction
This step describes how to prepare glass materials and a spike-in standard mixture for phospholipid extraction.
-
1.
Prepare and label tubes needed for lipid extraction. Each sample needs one screw-cap microtube, four microcentrifuge tubes, and two glass tubes (15 mL). Make sure that the glass tubes are clean. We recommend using ethanol to rinse glass tubes and air-dry before lipid extraction.
-
2.
Set a microcentrifuge to 4°C.
-
3.
Prepare a phospholipid spike-in standard mixture as described in the “materials and equipment” section.
Note: Glass materials should be used throughout the procedure. Plastic materials contain low molecular-weight polymers that will dissolve in organic solvents and interfere with lipid analysis.
Key resources table
| REAGENT or RESOURCE | SOURCE | IDENTIFIER |
|---|---|---|
| Chemicals, peptides, and recombinant proteins | ||
| D-glucose | Sangon Biotech | Cat#A100188-0005; CAS: 50-99-7 |
| Yeast nitrogen base | BD Difco | Cat#11743014 |
| Ammonium sulfate | Sangon Biotech | Cat#A100191-0500; CAS: 7783-20-2 |
| Acetonitrile (LC-MS grade) | Merck | Cat#1590142500; CAS: 75-05-8 |
| Methanol (LC-MS grade) | Merck | Cat#1.06035.2500; CAS: 67-56-1 |
| 2-Propanol (LC-MS grade) | Merck | Cat#1.02781.2500; CAS: 67-63-0 |
| Water (LC-MS grade) | Merck | Cat#1.15333.2500; CAS: 7732-18-5 |
| Ammonium acetate (LC-MS grade) | Sigma-Aldrich | Cat#73594-100G-F; CAS: 631-61-8 |
| Chloroform | Sinopharm Chemical Reagent Co., Ltd. | Cat#151902104; CAS: 67-66-3 |
| Citric acid | Sangon Biotech | Cat#A610055-0500; CAS: 77-92-9 |
| 17:0 PC (1,2-diheptadecanoyl-sn-glycero-3-phosphocholine) | Avanti | Cat#850360C-25MG; CAS: 70897-27-7 |
| 17:0 PE (1,2-diheptadecanoyl-sn-glycero-3-phosphoethanolamine) | Avanti | Cat#830756P-25MG; CAS: 140219-78-9 |
| 14:0 PS (1,2-dimyristoyl-sn-glycero-3-phospho-L-serine sodium salt) | Avanti | Cat#840033P-25MG; CAS: 105405-50-3 |
| LIPIDOMIX® Standards (methanol solution) | Avanti | Cat#330707-1EA |
| Experimental models: Organisms/strains | ||
| S. cerevisiae: CEN.PK: MAT a | (van Dijken et al., 2000) | N/A |
| S. cerevisiae: CEN.PK: MAT a; cho2Δ:: KanMX | This paper | N/A |
| S. cerevisiae: CEN.PK: MAT a; opi3Δ:: KanMX | This paper | N/A |
| S. cerevisiae: CEN.PK: MAT a; psd1Δ:: HYGMX | This paper | N/A |
| Software and algorithms | ||
| Analyst v1.7.2 | SCIEX | https://sciex.com/products/software/analyst-software |
| OS v1.7 | SCIEX | https://sciex.com/products/software/sciex-os-software |
| Other | ||
| Triple Quad 6500+ QTRAP mass spectrometer | SCIEX | N/A |
| ACQUITY UPLC BEH C18 column (1.7 μm, 2.1 × 50 mm) | Waters | 186002350 |
| ACQUITY UPLC BEH C18 vanguard pre-column (1.7 μm 2.1 × 5 mm) | Waters | 186003975 |
| 0.55 mm Glass beads | Sigma-Aldrich | Z250465 |
| 15 mL Glass tubes | N/A | N/A |
| 5 mL Glass pipettes | N/A | N/A |
| 2 mL clear screw-top sample vials with patch | HAMAG | HM-0713 |
| 250 μL glass insert | HAMAG | HM-2085 |
| Sterile syringe filter, 0.22 μm (PES), 33 mm | Merck Millipore | Cat#SLGP033RB-1 |
| Acid-Resistant CentriVap Centrifugal Vacuum Concentrator | Labconco | Cat#7810033 |
| Dual-position snap cap | Crystalgen | 23-2059 |
| Screw-cap tubes | NEST | 634101-B |
| 26G needle | KDL | N/A |
| Bead-beater (Automatic sample fast grinder-24 L) | Shanghai Jingxin | JXFSTPRP-24 |
| 1.5 mL microcentrifuge tube | VWR | 10025-724 |
| 15 mL centrifuge tube | VWR | 10025-686 |
Materials and equipment
Mass spectrometer: A Triple Quad 6500+ QTRAP mass spectrometer (SCIEX) was used in this protocol. Although this method was developed on a SCIEX QTRAP 6500+ mass spectrometer, instruments from any vendor can be used for this work after performing appropriate ionization source and molecule-specific parameter optimizations for each of the lipids quantified using this method. The sensitivity of mass spectrometers affects the minimum amount of a sample required for quantitative accuracy. As listed in Table 1, the starting amounts of samples used empirically in our laboratory are based on the Triple Quad 6500+ System.
Synthetic defined (SD) medium
| Reagent | Final concentration | Amount |
|---|---|---|
| Yeast nitrogen base w/o amino acids | 0.17% (w/v) | 0.85 g |
| Ammonium sulfate | 0.5% (w/v) | 2.5 g |
| 50% (w/v) D-glucose | 2% (w/v) | 20 mL |
| Millipore water | N/A | 480 mL |
| Total | N/A | 500 mL |
Note: 50% D-glucose stock solution is sterilized by autoclaving and stored at 25°C. SD medium can be stored at 4°C for a month.
Spike-in phospholipid mixture preparation
| Reagent | Final concentration | Amount |
|---|---|---|
| 5 mg/mL 17:0/17:0 PC (chloroform solution) | 420 μg/mL | 84 μL |
| 5 mg/mL 17:0/17:0 PE (chloroform solution) | 420 μg/mL | 84 μL |
| 5 mg/mL 14:0/14:0 PS (chloroform solution) | 420 μg/mL | 84 μL |
| chloroform | 100% (v/v) | 748 μL |
| Total | N/A | 1 mL |
Note: Each stock solution is stored at −20°C for 1 year and sealed with a Teflon film tape (PTFE sealing tape) to prevent evaporation.
CRITICAL: Do not individually add the phospholipid standard mixture to each sample, which may increase experimental errors. Instead, make a master mix with methanol by adding total amounts needed for all samples.
Solvent A for LC-MS
| Reagent | Final concentration | Amount |
|---|---|---|
| Methanol | 33.3% (v/v) | 333 mL |
| Acetonitrile | 33.3% (v/v) | 333 mL |
| Water | 33.4% (v/v) | 334 mL |
| Ammonium acetate | 5 mM | 385.4 mg |
| Total | N/A | 1 L |
Solvent B for LC-MS
| Reagent | Final concentration | Amount |
|---|---|---|
| 2-Propanol | 100% (v/v) | 1 L |
| Ammonium acetate | 5 mM | 385.4 mg |
| Total | N/A | 1 L |
Note: Use LC-MS-grade reagents for making these solvents. Dissolving ammonium acetate in 2-propanol takes time. We keep the solution stirring for at least 6 h to fully dissolve ammonium acetate in 2-propanol. Prepare all solvents before use and store at 25°C.
Table 1.
Estimated amounts for sample preparation
| Sample | Amount for extraction | Injection volume (μL) | Actual sampling amount | Peak intensitya | Identified number of phospholipids species |
|---|---|---|---|---|---|
| Yeast cells | 1–4 OD600 units | 5 | <0.01 OD unit | 105–106 | ∼80 |
| Mammalian cells (e.g., HEK293T) | ≥100,000 cells | 5 | >20 cells | 105–106 | ∼300 |
| Mouse serum | 5 μL | 5 | ∼0.1 μL | 105–106 | ∼100 |
| Tissue (e.g., kidney) | 5 mg | 5 | ∼10 μg | 105–106 | ∼200 |
Note: The actual sampling amount is calculated according to a dilution rate used in this protocol. We usually take a 200 μL aliquot from 2.8 mL of the chloroform fraction of the extraction solution. The lipid extract is dried and re-dissolved in a 200 μL sampling buffer. 5 μL is injected for analysis.
Peak intensity designates an estimated range for phospholipid peaks with high signals.
LC setup for phospholipid analysis
Note: Check the needle wash solution in the LC autosampler. Fill with 100% 2-propanol if necessary.
Table 2.
LC gradient condition
| Column | ACQUITY UPLC BEH C18 column (1.7 μm, 2.1 × 50 mm), ACQUITY UPLC BEH C18 vanguard pre-column (1.7 μm, 2.1 × 5 mm) |
| Column temperature | 45°C |
| Injecting volume | 5.0 μL |
| Flow rate | 0.15 mL/min |
| Time (min) | Gradient B % |
| 0 | 20.0 |
| 1.0 | 20.0 |
| 3.0 | 60.0 |
| 20.0 | 98.0 |
| 20.1 | 20.0 |
| 22.0 | 20.0 |
| 25.0 | 20.0 |
| Diverter time program | |
| Time (min) | Position |
| 0.0 | B |
| 3.0 | A |
| 15.0 | B |
See also Table S1.
MS setup for phospholipid analysis
Table 3.
MS parameter setting
| Parameters | |
|---|---|
| Scan type | MRM |
| Polarity | Negative |
| Ion source | Electrospray ionization (ESI) |
| Source/Gas Parameters | Value |
| Curtain Gas (CUR) | 40 psi |
| Collision Gas (CAD) | Medium |
| Ion spray voltage (IS) | -4500.0 eV |
| Temperature (TEM) | 400°C |
| Ion Source Gas 1 (GAS1) | 40 psi |
| Ion Source Gas 2 (GAS2) | 40 psi |
| Compound MRM Parameters | Value |
| Declustering Potential (DP) | -80.0 eV |
| Entrance Potential (EP) | -10.0 eV |
| Collision Energy (CE) | -50.0 eV |
| Collision Cell Exit Potential (CXP) | -10.0 eV |
Step-by-step method details
In this section, we first describe the workflow of phospholipid extraction from yeast cells and next provide procedures for the extraction of phospholipids from other sample types. Lastly, we provide detailed steps for setting up MS programs to examine phospholipid compositions. An extended library for LC-MS parameters is provided in the supplemental information.
Cell culture and yeast sample preparation
This step describes preparation of yeast cells for phospholipid extraction.
-
1.
Inoculation. Inoculate from a single colony grown on a newly streaked plate into a 2 mL SD medium in the culture tube with dual-position snap cap. Cultivate at 30°C.
-
2.
Dilution. The saturated yeast culture is diluted in 20 mL fresh SD medium in a flask at an OD600 of 0.1.
-
3.Harvest cells. Collect 4 OD600 units of cells growing logarithmically in a 15 mL centrifuge tube for lipid extraction.
-
a.Spin down cells at 3,750 g for 3 min at 4°C.
-
b.Wash cells with 1 mL ice-cold Millipore water, transfer to a 1.5 mL microcentrifuge tube, centrifuge at 3,750 g for 1 min at 4°C, and collect the cell pellets.
-
a.
Note: It takes about 6.5 h to reach OD600 1.0 in SD medium for wild-type (WT) prototrophic yeast cells in the CEN.PK background.
Pause point: Snap-freeze the cell pellets in liquid nitrogen and store them at −80°C if extraction procedures are not immediately followed.
Phospholipid extraction
This step describes a procedure for phospholipid extraction from yeast cells.
The overview of this procedure is summarized in Figures 1 and 2.
-
4.
Prepare a homogenization solution. Prepare 500 μL ice-cold methanol (LC-MS grade) solution for every sample by adding 10 μL of the spike-in phospholipid standard mixture.
Note: Including the phospholipid standard mixture during phospholipid extraction is sufficient for relative quantification. This helps to monitor and normalize extraction efficiency. Add LIPIDOMIX® Standards if absolute quantification is required. The mixture standards of deuterium-labeled lipids can be added to the homogenization solution or be included later at the reconstitution step (step 22) before MS injection.
-
5.
Add 400 μL glass beads to empty screw-cap tubes.
-
6.
Resuspend the cells in 500 μL of the homogenization solution containing the spike-in standards, transfer them to the tubes filled with glass beads, and ensure that each tube cap is tightened.
Note: The samples should be kept cold before adding chloroform.
-
7.As shown in Figure 1, disrupt the cells using a bead-beater.
-
a.Place the sample tubes axis-symmetrically in the pre-cooled holder.
-
b.Set up a bead-beating program at 67 Hz for 300 s.
-
c.Repeat twice for a 30-s interval of ice incubation.
-
a.
-
8.
As shown in Figure 2, punch a hole at the bottom of the screw-cap tube with a 26G needle and insert the tube halfway into a new 1.5 mL microcentrifuge tube.
-
9.
Spin at 4,500 g for 1 min at 4°C.
-
10.
Collect the flow-through, including the cell lysate, and transfer it to a 15 mL glass tube.
-
11.
Wash the glass beads with 500 μL ice-cold methanol and collect the flow-through after 1-min centrifugation at 4,500 g.
-
12.
Combine this flow-through with the flow-through collected at step 10 in the 15 mL glass tube.
Note: The total volume for each sample should be around 1 mL. Add ice-cold methanol to adjust if necessary.
-
13.
Add 2 mL chloroform to the 15 mL glass tubes and vortex vigorously for 30 s.
Note: Use glass pipettes to transfer chloroform.
-
14.
Spin for 3 min at 1,000 g, transfer all the supernatant to a new 15 mL glass tube, and discard the cell pellet.
-
15.
Add 400 μL of 50 mM citric acid and 800 μL chloroform, and vortex for 30 s.
-
16.
Spin at 1,000 g for 5 min to achieve phase separation.
-
17.
Carefully aspirate off the upper phase, including the protein layer formed at the phase boundary, and save the bottom organic phase.
Optional: Wash the bottom phase with an artificial upper phase (chloroform/methanol/water; 3/38/47; v/v/v) (Folch et al., 1957).
Note: The total volume of the organic phase is about 2.8 mL. Save 3 aliquots of 200 μL of this phase and proceed to step 18.
-
18.
Dry lipid samples in the organic phase using the vacuum concentrator system. It takes about 15–20 min.
Note: This phospholipid extraction procedure is adapted from previous methods (Vaden et al., 2005; Ye et al., 2013, 2017) and modified for the targeted MS method for phospholipid quantification.
Figure 1.

A workflow for disruption of yeast cells
Figure 2.

A workflow for extraction of yeast phospholipids
Phospholipid extraction for other sample types
This step describes phospholipid extraction from other types of samples.
Note: Please refer to Table 1 for the preparation of starting amounts of samples.
-
19.Mammalian cells (HEK293T).
-
a.Aspirate off culture medium and quickly wash with pre-warmed phosphate-buffered saline (PBS) buffer if necessary.
-
b.Scrape off the cells in PBS buffer, transfer to the 1.5 mL screw-cap tube, and remove PBS after centrifugation.
-
c.Add 500 μL homogenization solution containing a 10 μL phospholipid standard mixture.
-
d.Perform the freeze-thaw cycle in liquid nitrogen and a 37°C water bath 5 times. Homogenize the cells using a bead-beater without glass beads.
-
e.Transfer to 15 mL glass tubes and add 500 μL ice-cold methanol.
-
f.Continue to step 13 in “phospholipid extraction” for the subsequent procedures.
-
a.
-
20.Tissue samples (kidney).
-
a.Add 400 μL glass beads to screw-cap tubes and put frozen tissue samples in.
-
b.Add 500 μL of the homogenization solution containing a 10 μL phospholipid standard mixture.
-
c.Homogenize the tissue samples as described for yeast cells in step 7.
-
d.Perform the freeze-thaw cycle in liquid nitrogen and a 37°C water bath 5 times.
-
e.Continue to step 8 in “phospholipid extraction” for the subsequent procedures.
-
a.
Note: Some tissue samples may be challenging to homogenize with glass beads. Alternative methods can be used (Jenkins et al., 2020; Tani et al., 2022; van Smeden et al., 2011).
-
21.Mouse serum.
-
a.Add 100 μL of the homogenization solution containing a 1 μL phospholipid standard mixture to a 5 μL serum sample.
-
b.Add 200 μL chloroform.Note: A small extraction buffer system is used to extract phospholipids from fluid samples like serum. All other solvents are reduced to 10%, accordingly.
-
c.Set up a vibrating program at 67 Hz for 60 s using the bead-beater.
-
d.Spin at 2,000 g for 1 min at 4°C.
-
e.Transfer the supernatant to a new 1.5 mL microcentrifuge tube.
-
f.Add 40 μL of 50 mM citric acid and 80 μL chloroform.
-
g.Vibrate at 67 Hz for 1 min to mix.
-
h.Spin at 2,000 g for 1 min to achieve phase separation.
-
i.Aspirate off the upper phase carefully and save 2 aliquots of 100 μL from the bottom organic phase.
-
j.Dry the lipid samples using the vacuum concentrator system.
-
a.
Sample preparation for LC-MS detection
Protocol for detailed steps of sample reconstitution for LC-MS. The overview of this procedure is summarized in Figure 3.
-
22.
Phospholipid extracts are reconstituted in 200 μL 2-propanol/acetonitrile/H2O (2:1:1, v/v/v).
Note: 2 μL of LIPIDOMIX® Standards (LIPIDOMIX® Standards/re-suspension=1:100 (v/v)) is included at this step if having not been included as internal standards during lipid extraction.
-
23.
Gently shake at 20 Hz for 10 min.
-
24.
Place at 25°C for 30 min.
-
25.
Centrifuge at 15,000 g for 15 min at 25°C.
-
26.
Transfer 150 μL of the supernatant to a new 1.5 mL microcentrifuge tube.
-
27.
Repeat step 25.
-
28.
Transfer 120 μL of the supernatant to another new 1.5 mL microcentrifuge tube.
-
29.
Transfer 100 μL into a glass insert placed in a glass sampling vial.
-
30.
Prepare a quality control (QC) sample from sample residuals. Take an equal volume from each sample, making a 100 μL mixture as the QC sample.
Figure 3.

A workflow of sample reconstitution for LC-MS analysis
Preparation of LC-MS for acquisition
Protocol for establishing an instrument method in MRM mode.
-
31.
Create an instrument method in MRM mode using the LC-MS system.
-
32.
Enter the transition for precursor ion Q1 and fragment ion Q3, the name, the dwell time, and the appropriate collision energy (CE) and declustering potential (DP) for each phospholipid species.
Note: Please refer to Table 4 and Table S2 for phospholipid-specific MRM settings.
Note: The ion source conditions and the LC program are set up as described in the “materials and equipment” section.
-
33.Equilibrate the LC system, and run a blank and a phospholipid standard mixture sample.
-
a.Check the LC pressure after the system is equilibrated. For the ACQUITY UPLC BEH C18 column, the pressure at equilibrium is about 1,800 psi/125 bar for a flow of 0.15 mL/min with 20% Buffer B.
-
b.Check background signals and if there are miscellaneous peaks on the chromatograms for the blank sample. Some background noises and miscellaneous peaks can be simply reduced or cleared by running extra blank samples. If not, flush the LC system thoroughly. Request maintenance service to clean the LC lining system or the mass spectrometer ion source if the interferences remain unresolved.
-
c.Inspect the retention times for phospholipid standards. Because retention time is important for phospholipid peak annotation, maintaining identical chromatographic conditions is critical for reproducible retention times.
-
a.
Table 4.
Phospholipid-specific MRM settings
| Compound name | Q1 | Q3 | DP | EP | CE | CXP | Dwell time (ms) | Retention time (min) |
|---|---|---|---|---|---|---|---|---|
| LPC(16:0) | 554.346 | 255.233 | -80 | -10 | -50 | -10 | 1 | 4.1 |
| LPC(16:1) | 552.331 | 253.217 | -80 | -10 | -50 | -10 | 1 | 3.3 |
| LPC(18:1) | 580.362 | 281.249 | -80 | -10 | -50 | -10 | 1 | 4.1 |
| PC(14:0-14:0) | 736.513 | 227.202 | -80 | -10 | -50 | -10 | 1 | 6.1 |
| PC(14:0-16:0) | 764.545 | 227.202 | -80 | -10 | -50 | -10 | 1 | 6.5 |
| PC(14:0-18:0) | 792.576 | 227.202 | -80 | -10 | -50 | -10 | 1 | 7.1 |
| PC(16:0-16:0) | 792.576 | 255.233 | -80 | -10 | -50 | -10 | 1 | 7.0 |
| PC(16:0-18:0) | 820.607 | 255.233 | -80 | -10 | -50 | -10 | 1 | 7.2 |
| PC(14:0-14:1) | 734.498 | 225.186 | -80 | -10 | -50 | -10 | 1 | 5.6 |
| PC(14:0-16:1) | 762.529 | 227.202 | -80 | -10 | -50 | -10 | 1 | 6.1 |
| PC(14:0-18:1) | 790.56 | 281.249 | -80 | -10 | -50 | -10 | 1 | 6.6 |
| PC(14:1-16:0) | 762.529 | 255.233 | -80 | -10 | -50 | -10 | 1 | 6.1 |
| PC(14:1-16:1) | 760.514 | 225.186 | -80 | -10 | -50 | -10 | 1 | 5.5 |
| PC(14:1-18:1) | 788.545 | 281.249 | -80 | -10 | -50 | -10 | 1 | 5.9 |
| PC(16:0-16:1) | 790.56 | 253.217 | -80 | -10 | -50 | -10 | 1 | 6.5 |
| PC(16:0-18:1) | 818.592 | 281.249 | -80 | -10 | -50 | -10 | 1 | 7.1 |
| PC(16:1-18:0) | 818.592 | 253.217 | -80 | -10 | -50 | -10 | 1 | 7.1 |
| PC(16:1-16:1) | 788.545 | 253.217 | -80 | -10 | -50 | -10 | 1 | 6.2 |
| PC(16:1-18:1) | 816.576 | 281.249 | -80 | -10 | -50 | -10 | 1 | 6.7 |
| PC(18:0-18:1) | 846.623 | 281.249 | -80 | -10 | -50 | -10 | 1 | 7.8 |
| PC(18:1-18:1) | 844.607 | 281.249 | -80 | -10 | -50 | -10 | 1 | 7.2 |
| LPE(16:1) | 450.263 | 253.217 | -80 | -10 | -50 | -10 | 1 | 3.3 |
| LPE(18:1) | 478.293 | 281.249 | -80 | -10 | -50 | -10 | 1 | 4.2 |
| PE(14:0/16:1) | 660.461 | 253.217 | -80 | -10 | -43 | -10 | 1 | 6.2 |
| PE(14:0/18:1) | 688.492 | 281.249 | -80 | -10 | -43 | -10 | 1 | 6.6 |
| PE(14:1/18:0) | 688.492 | 283.264 | -80 | -10 | -43 | -10 | 1 | 5.0 |
| PE(14:1/16:1) | 658.446 | 253.217 | -80 | -10 | -43 | -10 | 1 | 5.8 |
| PE(14:1/18:1) | 686.476 | 281.249 | -80 | -10 | -43 | -10 | 1 | 6.1 |
| PE(16:0/16:0) | 690.508 | 255.233 | -80 | -10 | -50 | -10 | 1 | 6.5 |
| PE(16:0/16:1) | 688.492 | 253.217 | -80 | -10 | -50 | -10 | 1 | 6.6 |
| PE(16:0/18:1) | 716.524 | 281.249 | -80 | -10 | -50 | -10 | 1 | 7.2 |
| PE(16:1/18:0) | 716.524 | 283.264 | -80 | -10 | -50 | -10 | 1 | 6.7 |
| PE(16:1/16:1) | 686.476 | 253.217 | -80 | -10 | -50 | -10 | 1 | 6.1 |
| PE(16:1/18:1) | 714.508 | 281.249 | -80 | -10 | -50 | -10 | 1 | 6.6 |
| PE(18:0/18:1) | 744.555 | 281.249 | -80 | -10 | -50 | -10 | 1 | 7.2 |
| PE(18:1/18:1) | 742.539 | 281.249 | -80 | -10 | -50 | -10 | 1 | 6.6 |
| PE(O-16:1/16:0) | 674.513 | 253.217 | -80 | -10 | -50 | -10 | 1 | 6.3 |
| PE(O-16:0/18:1) | 702.544 | 281.249 | -80 | -10 | -50 | -10 | 1 | 6.9 |
| PE(O-18:0/16:1) | 702.544 | 253.217 | -80 | -10 | -50 | -10 | 1 | 6.3 |
| PE(O-16:1/16:1) | 672.498 | 253.217 | -80 | -10 | -50 | -10 | 1 | 5.9 |
| PE(O-18:1/16:1) | 700.529 | 253.217 | -80 | -10 | -50 | -10 | 1 | 6.3 |
| PE(O-18:1/18:1) | 728.561 | 281.249 | -80 | -10 | -50 | -10 | 1 | 6.8 |
| PE(P-14:1/16:0) | 644.5 | 255.233 | -80 | -10 | -50 | -10 | 1 | 4.3 |
| PE(P-16:0/16:1) | 672.5 | 253.217 | -80 | -10 | -50 | -10 | 1 | 6.0 |
| PE(P-16:0/18:1) | 700.5 | 281.249 | -80 | -10 | -50 | -10 | 1 | 6.5 |
| PE(P-18:0/16:1) | 700.5 | 253.217 | -80 | -10 | -50 | -10 | 1 | 6.5 |
| PE(P-18:0/18:1) | 728.6 | 281.249 | -80 | -10 | -50 | -10 | 1 | 6.9 |
| PI(14:0/14:0) | 753.456 | 227.202 | -80 | -10 | -50 | -10 | 1 | 5.2 |
| PI(16:0/14:0) | 781.487 | 255.233 | -80 | -10 | -50 | -10 | 1 | 5.5 |
| PI(14:0/18:0) | 809.518 | 227.202 | -80 | -10 | -50 | -10 | 1 | 5.8 |
| PI(16:0/16:0) | 809.518 | 255.233 | -80 | -10 | -50 | -10 | 1 | 5.8 |
| PI(16:0/18:0) | 837.55 | 255.233 | -80 | -10 | -50 | -10 | 1 | 5.9 |
| PI(18:0/18:0) | 865.581 | 283.264 | -80 | -10 | -50 | -10 | 1 | 6.3 |
| PI(14:0/14:1) | 751.441 | 227.202 | -80 | -10 | -50 | -10 | 1 | 5.0 |
| PI(14:0/16:1) | 779.472 | 227.202 | -80 | -10 | -50 | -10 | 1 | 5.2 |
| PI(14:0/18:1) | 807.503 | 227.202 | -80 | -10 | -50 | -10 | 1 | 5.5 |
| PI(16:0/14:1) | 779.472 | 255.233 | -80 | -10 | -50 | -10 | 1 | 5.3 |
| PI(18:0/14:1) | 807.503 | 283.264 | -80 | -10 | -50 | -10 | 1 | 5.6 |
| PI(16:1/14:1) | 777.456 | 253.217 | -80 | -10 | -50 | -10 | 1 | 5.0 |
| PI(16:0/16:1) | 807.503 | 255.233 | -80 | -10 | -50 | -10 | 1 | 5.5 |
| PI(16:0/18:1) | 835.534 | 255.233 | -80 | -10 | -50 | -10 | 1 | 5.9 |
| PI(18:0/16:1) | 835.534 | 283.264 | -80 | -10 | -50 | -10 | 1 | 5.9 |
| PI(16:1/16:1) | 805.487 | 253.217 | -80 | -10 | -50 | -10 | 1 | 5.3 |
| PI(16:1/18:1) | 833.518 | 253.217 | -80 | -10 | -50 | -10 | 1 | 5.6 |
| PI(18:0/18:1) | 863.565 | 283.264 | -80 | -10 | -50 | -10 | 1 | 6.3 |
| PI(18:1/18:1) | 861.55 | 281.249 | -80 | -10 | -50 | -10 | 1 | 5.9 |
| PS(14:0/16:1) | 704.451 | 227.202 | -80 | -10 | -50 | -10 | 1 | 5.3 |
| PS(14:0/18:1) | 732.482 | 227.202 | -80 | -10 | -50 | -10 | 1 | 5.6 |
| PS(14:1/18:1) | 730.476 | 225.186 | -80 | -10 | -50 | -10 | 1 | 5.2 |
| PS(16:0/16:0) | 734.498 | 255.233 | -80 | -10 | -50 | -10 | 1 | 5.6 |
| PS(16:0/18:0) | 762.529 | 255.233 | -80 | -10 | -50 | -10 | 1 | 5.9 |
| PS(16:1/14:1) | 702.436 | 253.217 | -80 | -10 | -50 | -10 | 1 | 5.1 |
| PS(16:0/16:1) | 732.482 | 255.233 | -80 | -10 | -50 | -10 | 1 | 5.6 |
| PS(16:0/18:1) | 760.513 | 255.233 | -80 | -10 | -50 | -10 | 1 | 5.9 |
| PS(16:1/18:0) | 760.513 | 253.217 | -80 | -10 | -50 | -10 | 1 | 5.7 |
| PS(16:1/16:1) | 730.476 | 253.217 | -80 | -10 | -50 | -10 | 1 | 5.3 |
| PS(16:1/18:1) | 758.498 | 253.217 | -80 | -10 | -50 | -10 | 1 | 5.6 |
| PS(18:1/18:0) | 788.545 | 281.249 | -80 | -10 | -50 | -10 | 1 | 6.1 |
| PS(18:1/18:1) | 786.529 | 281.249 | -80 | -10 | -50 | -10 | 1 | 5.7 |
| PG(16:0/16:1) | 719.487 | 253.217 | -80 | -10 | -50 | -10 | 1 | 5.6 |
| PG(16:0/18:1) | 747.518 | 281.249 | -80 | -10 | -50 | -10 | 1 | 5.9 |
| PA(14:0/14:0) | 591.403 | 227.202 | -80 | -10 | -50 | -10 | 1 | 5.3 |
| PA(16:1/18:0) | 673.481 | 253.217 | -80 | -10 | -50 | -10 | 1 | 5.9 |
| PA(18:1/18:0) | 701.513 | 281.249 | -80 | -10 | -50 | -10 | 1 | 6.5 |
| PE(17:0/17:0) | 718.57 | 269.264 | -80 | -10 | -50 | -10 | 1 | 7.9 |
| PC(17:0-17:0) | 820.6 | 269.2 | -80 | -10 | -50 | -10 | 1 | 7.8 |
| PS(14:0/14:0) | 678.6 | 227.1 | -80 | -10 | -50 | -10 | 1 | 5.3 |
| PI(17:0/14:1) | 793.49 | 269.25 | -80 | -10 | -50 | -10 | 1 | 5.4 |
| PC(15:0-18:1(d7)) | 811.592 | 288.249 | -80 | -10 | -50 | -10 | 1 | 6.3 |
| PE(15:0/18:1(d7)) | 709.524 | 288.249 | -80 | -10 | -50 | -10 | 1 | 5.7 |
| PS(18:1(d7)/15:0) | 753.531 | 288.249 | -80 | -10 | -50 | -10 | 1 | 6.9 |
| PG(15:0/18:1(d7)) | 740.518 | 288.249 | -80 | -10 | -50 | -10 | 1 | 7.0 |
| PI(18:1(d7)/15:0) | 828.534 | 288.249 | -80 | -10 | -50 | -10 | 1 | 5.7 |
| PA(18:1(d7)/15:0) | 666.481 | 288.249 | -80 | -10 | -50 | -10 | 1 | 5.6 |
| LPC18:1(d7) | 587.362 | 288.249 | -80 | -10 | -50 | -10 | 1 | 4.2 |
| LPE18:1(d7) | 485.293 | 288.249 | -80 | -10 | -50 | -10 | 1 | 4.3 |
Note: When the location of fatty acid chains in a phospholipid is known, the fatty acids are separated by “sn-1/sn-2”. For an unknown location, the fatty acids are separated by a “-” (Buré et al., 2013). The alkyl and alkenyl ether phospholipids are denoted by the “O-” and “P-” prefixes.
See also Table S2.
LC-MS detection
This step describes how to create an acquisition batch.
-
34.
Put the samples into the sample holder in the auto-sampler. Write down the vial position for each sample.
-
35.
Create an acquisition batch. Select the acquisition method that has been established in “Preparation of LC-MS for acquisition.” Enter sample names, vial positions, data file paths, and injection volumes, as shown in Figure 4.
-
36.
Submit this acquisition batch.
Note: Queue a QC sample every 5–10 samples.
-
37.
During acquisition, check retention times and the intensities of internal standards for each QC samples.
Note: Make sure that there are no major peak shifts or signal drop-offs during acquisition.
Figure 4.

Build an acquisition batch
Data analysis
This step describes a workflow for data validation, quantification, and visualization (Figure 5).
-
38.
Use SCIEX OS to open a data set.
-
39.
Inspect the peaks. Integrate peaks manually when necessary.
-
40.
Export raw data files.
-
41.
Normalize the spectral intensities of each sample to the spike-in standards.
Note: Monitor extraction efficiency by examining the spectral signal of each phospholipid species in the spike-in standards. Different classes of spike-in phospholipids should not vary much among samples. If so, the spectral intensity of each phospholipid in the samples can be normalized by dividing either a single or total intensity of the standard phospholipids.
-
42.
Use the normalized values to calculate relative abundances of phospholipids.
-
43.
Molar concentrations for each phospholipid species are calculated using the following formula based on the signal intensities of deuterium-labeled phospholipid standards:
Figure 5.

A workflow for data analysis
C (S)∗=peak area (S) × C (Std)∗/peak area (Std).
Note: ∗C (S): Molar concentration of a phospholipid species in a sample; C (Std): Molar concentration of the same class of phospholipids in the deuterium-labeled standards.
-
44.
Phospholipid abundances can be further estimated in terms of the head group class (LPC, LPE, PC, PE, PS, PI, PA, PG), the number of carbons (28, 30, 32, 34, 36), and the number of double bonds (0, 1, 2) in their acyl chains.
Optional: We recommend the web-based platform MetaboAnalyst for further data analysis and visualization. MetaboAnalyst supports raw MS spectra processing, data normalization, statistical analysis, and functional analysis.
Expected outcomes
Upon the completion of this protocol, we detected around 80 and more than 200 phospholipid species in yeast and mammalian samples. Phospholipid repertoires are much more diverse in higher eukaryotes (Dowhan, 1997; van Meer et al., 2008), and hence more species can be detected using the extended library of MRM transitions (Table S2). Phospholipid classes were chromatographically separated under the LC condition used in this protocol (Figure 6). Correct annotation of phospholipid peaks is crucial for reproducible findings. However, it is sometimes difficult to do so owing to isobaric interference. We used yeast deletion mutants to help confirm peak annotation. As shown in Figure 7, we observed that the peak heights of phosphatidylethanolamine (PE) were increased in cho2Δ, the mutant that blocks the first step of PE to phosphatiylcholine (PC) conversion, and were decreased by psd1Δ, the mutant that abrogates phosphatidylserine (PS) decarboxylation for PE production. The correct peaks for PC disappeared in opi3Δ while PS peak heights were increased in psd1Δ. These expected changes (Ye et al., 2017) improved the analytic confidence, rendering our method for an accurate determination of phospholipid compositions.
Figure 6.

Total ion chromatogram of mass spectrometry data
(A and B) Total ion chromatogram of a QC sample (A) and the internal standard (B).
Figure 7.

Ion chromatograms of PE, PC, and PS in yeast WT and mutant cells
Limitations
This ESI-MS-based method described here is a targeted method for analyzing phospholipid compositions. Unlike untargeted lipidomics analysis, fewer lipid species are identified and quantified. Although the targeted approach often yields an overall quantitative accuracy better than the untargeted method, these analytic results do not reflect truly quantitative compositional data (Koivusalo et al., 2001). This is because not all phospholipid species are ionized with equal efficiency. Importantly, many factors such as lipid structural features, total lipid concentration, solvent composition, and instrument settings will affect the instrument response (Koivusalo et al., 2001). Therefore, it is recommended to include internal standards for each phospholipid class to improve data accuracy.
Troubleshooting
Problem 1
LC pressure increases after running several samples (step 37).
Potential solution
This is likely due to impurities in samples that clog the LC lines. Wash the lines and the column thoroughly using a flow of 2-propanol.
Problem 2
Spike-in standards show spectral signals markedly different among samples (step 4 or step 37).
Potential solution
This is usually caused by the incorrect handling of the phospholipid standard mixture. One possibility is that the standard mixture stored in freezers is not warmed up, leaving it not being fully homogenized before the spike-in step. Another pitfall is that the standard mixture is individually added but not as a master mix, which can increase experimental errors.
Problem 3
Retention time shifts (steps 33 and 37).
Potential solution
This problem usually indicates a poor state of the LC column. Performing column cleaning regularly can extend the usage life of a column.
Problem 4
Sensitivity decreases (step 33).
Potential solution
First check if the column leaks. If not, the ion source may be contaminated. Use clean paper soaked in 50% methanol to thoroughly clean the MS inlet. If the problem persists, there might be a mass shift. Perform instrument calibration according to the instruction manual or request maintenance service.
Problem 5
Gradual shifts in retention time when running a large number of samples (step 37).
Potential solution
We observed this phenomenon when running with a large number of samples (>50). This is often caused by column overload. Dilute injection samples if possible. Otherwise, add 2–3 blank samples for every 10 samples.
Resource availability
Lead contact
Further information and requests for resources and reagents should be directed to and will be fulfilled by the lead contact, Cunqi Ye (yecunqi@zju.edu.cn).
Materials availability
This study did not generate new unique reagents.
Acknowledgments
We thank the Core Facility of Life Sciences Institute, Zhejiang University for technical support. This work was supported by grants from the National Natural Science Foundation China (92057102), a research fund from Zhejiang Provincial Key Laboratory for Cancer Molecular Cell Biology, the startup fund from the Life Sciences Institute of Zhejiang University, and the 1000 Talents Program for Young Scholars to C.Y.
Author contributions
Conceptualization and methodology, S.Y., J.X., and C.Y.; investigation and data curation, S.Y. and J.X.; writing, S.Y., J.X., and C.Y.; funding acquisition and supervision, C.Y.
Declaration of interests
The authors declare no competing interests.
Footnotes
Supplemental information can be found online at https://doi.org/10.1016/j.xpro.2022.101769.
Supplemental information
Data and code availability
This study did not generate new unique reagents.
References
- Bligh E.G., Dyer W.J. A rapid method of total lipid extraction and purification. Can. J. Biochem. Physiol. 1959;37:911–917. doi: 10.1139/o59-099. [DOI] [PubMed] [Google Scholar]
- Buré C., Ayciriex S., Testet E., Schmitter J.-M. A single run LC-MS/MS method for phospholipidomics. Anal. Bioanal. Chem. 2013;405:203–213. doi: 10.1007/s00216-012-6466-9. [DOI] [PubMed] [Google Scholar]
- Dowhan W. Molecular basis for membrane phospholipid diversity: why are there so many lipids? Annu. Rev. Biochem. 1997;66:199–232. doi: 10.1146/annurev.biochem.66.1.199. [DOI] [PubMed] [Google Scholar]
- Fang W., Zhu Y., Yang S., Tong X., Ye C. Reciprocal regulation of phosphatidylcholine synthesis and H3K36 methylation programs metabolic adaptation. Cell Rep. 2022;39:110672. doi: 10.1016/j.celrep.2022.110672. [DOI] [PubMed] [Google Scholar]
- Folch J., Lees M., Stanley G.H.S. A simple method for the isolation and purification of total lipides from animal tissues. J. Biol. Chem. 1957;226:497–509. [PubMed] [Google Scholar]
- Jenkins B., Ronis M., Koulman A. LC-MS lipidomics: exploiting a simple high-throughput method for the comprehensive extraction of lipids in a ruminant fat dose-response study. Metabolites. 2020;10:E296. doi: 10.3390/metabo10070296. [DOI] [PMC free article] [PubMed] [Google Scholar]
- Koivusalo M., Haimi P., Heikinheimo L., Kostiainen R., Somerharju P. Quantitative determination of phospholipid compositions by ESI-MS: effects of acyl chain length, unsaturation, and lipid concentration on instrument response. J. Lipid Res. 2001;42:663–672. [PubMed] [Google Scholar]
- Tani N., Tanno N., Ishiguro K.-i. Tandem immuno-purification of affinity-tagged proteins from mouse testis extracts for MS analysis. STAR Protoc. 2022;3:101452. doi: 10.1016/j.xpro.2022.101452. [DOI] [PMC free article] [PubMed] [Google Scholar]
- Vaden D.L., Gohil V.M., Gu Z., Greenberg M.L. Separation of yeast phospholipids using one-dimensional thin-layer chromatography. Anal. Biochem. 2005;338:162–164. doi: 10.1016/j.ab.2004.11.020. [DOI] [PubMed] [Google Scholar]
- van Dijken J.P., Bauer J., Brambilla L., Duboc P., Francois J.M., Gancedo C., Giuseppin M.L.F., Heijnen J.J., Hoare M., Lange H.C., et al. An interlaboratory comparison of physiological and genetic properties of four Saccharomyces cerevisiae strains. Enzyme Microb. Technol. 2000;26:706–714. doi: 10.1016/s0141-0229(00)00162-9. [DOI] [PubMed] [Google Scholar]
- van Meer G., Voelker D.R., Feigenson G.W. Membrane lipids: where they are and how they behave. Nat. Rev. Mol. Cell Biol. 2008;9:112–124. doi: 10.1038/nrm2330. [DOI] [PMC free article] [PubMed] [Google Scholar]
- van Smeden J., Hoppel L., van der Heijden R., Hankemeier T., Vreeken R.J., Bouwstra J.A. LC/MS analysis of stratum corneum lipids: ceramide profiling and discovery[S] J. Lipid Res. 2011;52:1211–1221. doi: 10.1194/jlr.M014456. [DOI] [PMC free article] [PubMed] [Google Scholar]
- Ye C., Bandara W.M.M.S., Greenberg M.L. Regulation of inositol metabolism is fine-tuned by inositol pyrophosphates in Saccharomyces cerevisiae. J. Biol. Chem. 2013;288:24898–24908. doi: 10.1074/jbc.M113.493353. [DOI] [PMC free article] [PubMed] [Google Scholar]
- Ye C., Sutter B.M., Wang Y., Kuang Z., Tu B.P. A metabolic function for phospholipid and histone methylation. Mol. Cell. 2017;66:180–193.e8. doi: 10.1016/j.molcel.2017.02.026. [DOI] [PMC free article] [PubMed] [Google Scholar]
- Zhao Z., Xu Y. An extremely simple method for extraction of lysophospholipids and phospholipids from blood samples. J. Lipid Res. 2010;51:652–659. doi: 10.1194/jlr.D001503. [DOI] [PMC free article] [PubMed] [Google Scholar]
Associated Data
This section collects any data citations, data availability statements, or supplementary materials included in this article.
Supplementary Materials
Data Availability Statement
This study did not generate new unique reagents.