Abstract
CD8+ T cell homeostasis is maintained by the IL-7 and IL-15 cytokines. Here we show that transcription factors Tcf1 and Lef1 were intrinsically required for homeostatic proliferation of CD8+ T cells. Multiomics analyses showed that Tcf1 recruited the genome organizer CTCF, and that homeostatic cytokines induced Tcf1-dependent CTCF redistribution in the CD8+ T cell genome. Hi-C coupled with network analyses indicated that Tcf1 and CTCF acted cooperatively to promote chromatin interactions and form highly connected, dynamic interaction hubs in CD8+ T cells before and after cytokine stimulation. Ablating CTCF phenocopied the proliferative defects caused by Tcf1 and Lef1 deficiency, and Tcf1 and CTCF controlled a similar set of genes that regulated cell cycle progression and promoted CD8+ homeostatic proliferation in vivo. These findings identified CTCF as a Tcf1 cofactor and uncovered an intricate interplay between Tcf1 and CTCF that modulates the genomic architecture of CD8+ T cells to preserve homeostasis.
CD8+ T lymphocytes are cytotoxic cells that lyse cells infected with intracellular pathogens and malignantly transformed cells. The naïve CD8+ T cell pool must be maintained at a stable size to sustain immunocompetence1. The homeostasis of naïve CD8+ T cells depends on cytokines including IL-7 and IL-152, 3, 4, which activate Jak kinases and Stat5 transcription factors5. Deletion of Stat5a and Stat5b severely depletes mature CD8+ T cells6. Despite the clearly mapped IL-7/IL-15-Stat5 pathway that connects environmental input to nuclear transcriptional activity, intrinsic determinants that control CD8+ T cell homeostasis remain incompletely understood.
Tcf1 and Lef1 are abundantly expressed in T lineage cells and have versatile functions in T cell biology7, 8. In CD8+ T lineage cells, Tcf1 and Lef1 are critical for establishing CD8+ T cell identity by suppressing CD4+ lineage-associated genes during late stages of thymic development9. In antigen-experienced CD8+ T cells, Tcf1 is essential for longevity and recall capacity of memory CD8+ T cells generated in response to acute infections10, 11, 12, and for self-renewal of stem-like exhausted CD8+ T cells generated in the context of chronic viral infection13, 14, 15, 16. Tcf1 and Lef1 contain a highly conserved high-mobility-group (HMG) DNA binding domain, and HMG proteins are known to cause DNA bending upon binding to the minor grooves of DNA double helix17. Lef1 binds to a minimal TCRα enhancer and causes a sharp DNA bending in vitro18, 19. Because Tcf1- and Lef1-mediated DNA bending occurs at minor grooves of ≤10 bp resolution, even if Tcf1 has close to 20,000 binding sites in naïve CD8+ T cell genome20, its broad impact on genomic structure cannot be solely explained by the DNA bending effects.
The postulated structural roles of Tcf1 and Lef1 have been investigated in naive CD8+ T cells using Hi-C coupled with other multiomics approaches20, and these factors modulate the genomic organization at multiple scales, including topologically associated domains (TADs) and focal chromatin loops, providing constant supervision of CD8+ T cell identity20. In this work, we show that Tcf1 physically interacted with and recruited CTCF, a well-characterized architectural protein and a versatile transcription regulator21, 22. Tcf1 and CTCF cooperatively promoted chromatin interactions and formation of highly connected, dynamic interaction hubs in CD8+ T cells at naïve state and in response to homeostatic cytokines. Our findings indicate a potent Tcf1-CTCF cooperativity that orchestrates the genomic architecture of CD8+ T cells to coordinately promote their homeostatic proliferation.
Results
Tcf1 and Lef1 are required for CD8+ T cell homeostasis.
Tcf1 and/or Lef1 proteins were specifically ablated in mature T cells in mice with a hCD2-Cre transgene, without affecting thymic development23 (Extended Data Fig. 1a). hCD2-Cre+Rosa26GFPTcf7+/+Lef1+/+ (wild-type) and hCD2-Cre+Rosa26GFPTcf7FL/FLLef1FL/FL (dKO) mice had similar numbers of splenic CD8+ T cells at 6-12 weeks old, but dKO CD8+ T cell numbers were less than half of wild-type cells in 41-45 weeks old mice (Fig. 1a). When mixed with wild-type CD45.1+CD8+ competitor cells at 1:1 ratio and transferred into replete CD45.2+ mice, wild-type CD45.2+CD8+ T cells persisted at a relatively stable level for at least 3 weeks; in contrast, dKO CD45.2+CD8+ T cells exhibited progressive decline, with dKO/WT ratio reaching <0.4:1 by 3 weeks post-transfer (Fig. 1b). These data indicated that Tcf1+Lef1 deficiency compromised the maintenance of the CD8+ T cell pool.
Figure 1. Tcf1 and Lef1 are required for homeostatic proliferation of CD8+ T cells.
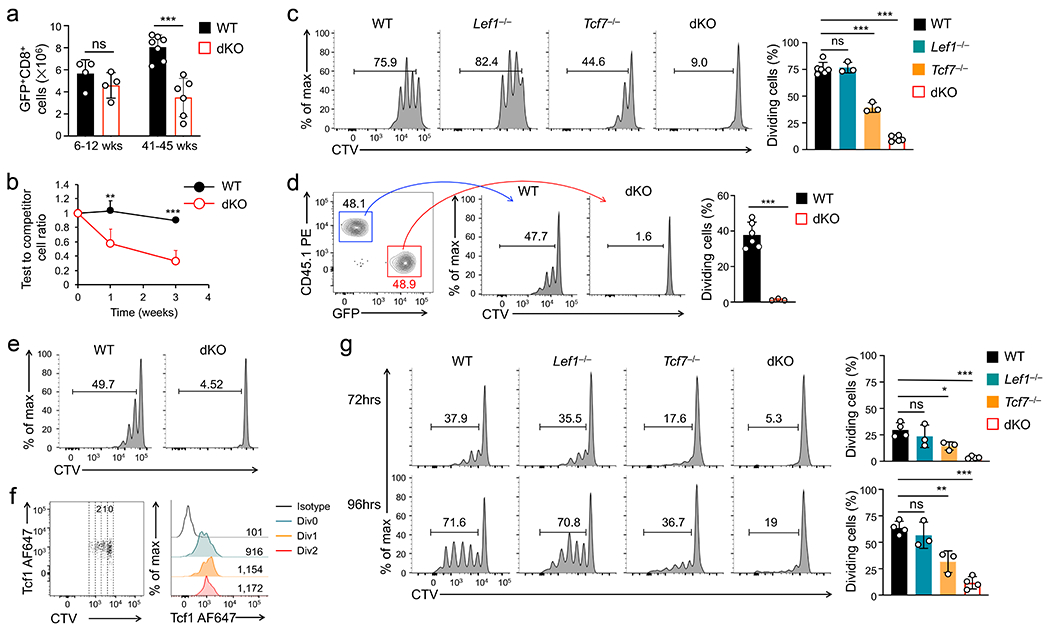
a. Numbers of splenic naive GFP+CD8+ T cells in wild-type (WT) and dKO mice in young (≤12 wks) and old (>40 weeks) age groups. b. The ratio of WT or dKO CD45.2+GFP+CD8+ T cells (test) to WT CD45.1+CD8+ T cells (competitor) from time 0 (1:1 mixture) to 1 or 3 weeks post-transfer into CD45.1+ B6.SJL mice as replete hosts (n=6/time point/genotype). c. Cell division of CTV-labeled naïve CD45.2+GFP+CD8+ T cells at 72 hrs after separate transfer into Rag1−/− mice, with frequency of cells showing ≥1 division summarized (bottom). d. Cell division of CTV-labeled WT and dKO CD45.2+GFP+CD8+ T cells at 72 hrs after co-transfer into Rag1−/− mice, with frequency of cells showing ≥1 division summarized (right). e. Cell division of CTV-labeled WT or dKO CD45.2+GFP+CD8+ T cells at 72 hrs after separate transfer into 650 Rad-irradiated CD45.1+ B6.SJL mice as acutely induced lymphopenic hosts. f. Tcf1 expression in CTV-labeled naïve WT CD8+ T cells at 72 hrs post-transfer into Rag1−/− mice, with values in scatterplot denoting numbers of cell division and those in half-stacked histogram denoting gMFI. g. Cell division of CTV-labeled naïve GFP+CD8+ T cells at 72 (top) or 96 hrs (bottom) after ex vivo culture with IL-7 and IL-15, with frequency of cells showing ≥1 division summarized (right). Data in a, b, c and g are from 3, and data in d, e and f from 2 independent experiments. Data in a–d and g are means ± s.d. *, p<0.05; **, p<0.01; ***, p<0.001; ns, not statistically significant by two-tailed Student’s t-test (a,d) or one-way ANOVA coupled with Tukey’s correction (c,g).
Most dKO CD8+ T cells in aged mice remained in CD44loCD62L+ naïve phenotype, showing neither aberrant induction of activation markers nor excessive AnnexinV+ apoptotic phenotypes (Extended Data Fig. 1b–d), suggesting that Tcf1+Lef1 deficiency impacted homeostatic proliferation. To directly test this, cell-trace violet (CTV)-labeled CD8+ T cells were transferred into lymphopenic Rag1−/− mice and tracked for cell division. At 72 hrs post-transfer, fewer Tcf1-deficient CD8+ cells were dividing compared with wild-type and Lef1-deficient cells, and the proliferative defect was exacerbated in dKO CD8+ T cells (Fig. 1c, Extended Data Fig. 1e). The impaired proliferation of dKO CD8+ T cells was consistently observed when co-transferred with wild-type cells into Rag1−/− recipients, or separately into irradiated mice (Fig. 1d, 1e). During this process, Tcf1 expression was sustained (Fig. 1f). These observations indicated that Tcf1 and Lef1 were intrinsically required for homeostatic proliferation of naive CD8+ T cells.
Tcf1 regulates responsiveness to homeostatic cytokines.
Both IL-7 and IL-15 promote homeostatic proliferation of CD8+ T cells, with IL-7 having a stronger pro-survival and IL-15 showing a stronger pro-proliferative effect24. CD8+ T cells lacking Tcf1 and/or Lef1 proliferated similarly as wild-type cells in response to ex vivo TCR stimulation (Extended Data Fig. 2a); however, when cultured ex vivo with IL-7+IL-15 for 72–96 hrs, <40% of Tcf1-deficient and <20% of dKO CD8+ T cells underwent cell division, while >70% of wild-type and Lef1-deficient cells proliferated (Fig. 1g), recapitulating the in vivo requirement for Tcf1+Lef1 in responding to homeostatic cytokines. IL-7 and IL-15 receptor components, such as γc, IL-2Rβ and IL-7Rα, were similarly expressed in wild-type and Tcf1- and/or Lef1-deficient CD8+ T cells (Extended Data Fig. 2b). IL-7+IL-15-induced phosphorylation of Stat5a at Tyr694 and Akt at Ser473 showed similar magnitude and kinetics in wild-type and dKO CD8+ T cells (Extended Data Fig. 2c). These data suggested that Tcf1+Lef1 deficiency affected nuclear integration of the signals derived from homeostatic cytokines, but not the signaling pathways.
We then performed RNA-seq on naïve wild-type and dKO CD8+ T cells and after ex vivo stimulation with IL-7+IL-15 for 72 hrs, a time point when cells were not all committed to cycling and remained responsive to cytokines. Each group of cells was segregated in distinct clusters, and key pairwise comparisons identified 2,110 differentially expressed genes (DEGs) (Extended Data Fig. 3a,b, Supplementary Table 1). K-means clustering analysis resolved the DEGs into 7 distinct clusters (Fig. 2a). Expression cluster 1 (ExpC1) and ExpC2 genes were induced by IL-7+IL-15 stimulation, and were enriched in cell cycle, DNA replication, lipid metabolism and mitochondrion functions, with ExpC1 showing stronger enrichment than ExpC2 (Fig. 2b). ExpC1 genes were similarly expressed between naïve wild-type and dKO CD8+ T cells, but showed impaired induction in stimulated dKO CD8+ T cells compared to stimulated wild-type cells (Fig. 2a). ExpC1 genes were predominantly regulators of cell cycle and DNA replication, such as those encoding cyclins, cyclin-dependent kinases, Foxm1, Eomes and E2F family transcription factors (Fig. 2c). ExpC6-ExpC7 genes were repressed similarly in IL-7+IL-15-stimulated wild-type and dKO CD8+ T cells, and were enriched in functions including immune system process, such as Egr1, Il6st and Mx1 (Extended Data Fig. 3c,d). ExpC3-ExpC6 were Tcf1+Lef1-dependent genes in naive cells, and were linked to constant supervision of CD8+ T cell identity20. These observations suggested that Tcf1+Lef1 regulated major aspects of cell cycle progression to promote homeostatic proliferation of CD8+ T cells. By stratifying the DEGs with Tcf1 binding peaks previously mapped in naïve CD8+ T cells20, ~50% of ExpC1 gene promoters were preoccupied by Tcf1 (Fig. 2a), suggesting that Tcf1 predetermined the ability of cell cycle genes to respond to homeostatic cytokines.
Figure 2. Tcf1 and Lef1 regulate homeostatic cytokine-induced changes in gene expression, chromatin accessibility and CTCF occupancy.
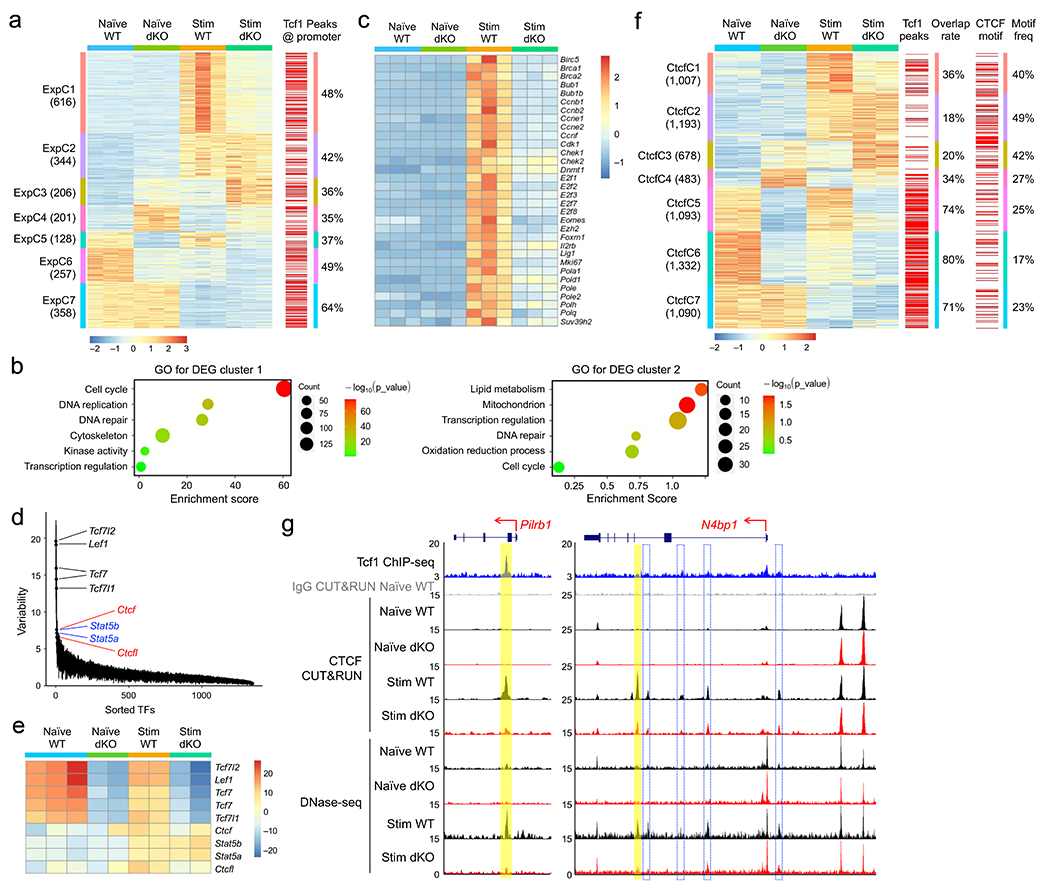
a. Clusters of differentially expressed genes (DEGs) based on RNA-seq analysis of WT or dKO GFP+CD8+ T cells, before and after 72-hr IL-7+IL-15 stimulation, with values in parentheses denoting gene numbers in each cluster and red lines on far right denoting the presence of Tcf1 peaks at corresponding gene promoters. b. Gene ontology (GO) terms for genes in ExpC1 and ExpC2 as determined with the DAVID Bioinformatics Resources, with dot size denoting gene counts and dot color denoting statistical significance. c. Heatmap of select ExpC1 DEGs involved in cell cycle regulation. d. Rank-sorted transcription factors (TFs) plotted against motif variability based on chromVAR analysis of ChrAcc profiles as determined with DNase-seq on WT or dKO GFP+CD8+ T cells before and after IL-7+IL-15 stimulation, with top-ranked TFs marked. e. Heatmap showing ‘accessibility scores’ of top-ranked TF motifs. f. Differential CTCF binding clusters as determined with CUT&RUN on WT or dKO GFP+CD8+ T cells before and after IL-7+IL-15 stimulation, with values in parentheses denoting CTCF peak numbers in each cluster and red lines denoting the presence of Tcf1 peaks (middle) or CTCF motif (right) at corresponding CTCF binding sites. g. Tcf1 ChIP-seq, CTCF CUT&RUN and DNase-seq tracks at the Pilrb1 and N4bp1 gene loci, with gene structure, transcription orientation and genomic scales displayed on top. Vertical bars denote Tcf1+Lef1-dependent, dynamic CTCF binding and ChrAcc sites induced by IL-7+IL-15 stimulation, with yellow bars marking statistically significant differences between WT and dKO CD8+ T cells and open bars with blue borders marking consistent reduction in dKO compared to WT CD8+ T cells but not reaching statistical significance. Color scale in a and c denote z-score-transformed relative gene expression, that in e denotes ‘accessibility scores’ as determined with chromVAR, and that in f denotes z-score-transformed relative CTCF binding strength.
Tcf1 engages Stat5 and CTCF for chromatin opening.
Using DNase-seq, we profiled chromatin accessibility (ChrAcc) in wild-type and dKO CD8+ T cells before and after IL-7+IL-15 stimulation. The ChrAcc profile in each group of cells was in distinct clusters, and key pairwise comparisons identified 5,202 differential (Diff) ChrAcc sites, which were resolved into 6 distinct clusters by unsupervised K-means clustering (Extended Data Fig. 3e,f). The Diff ChrAcc and DEG clusters showed concordant changes (Extended Data Fig. 3g). Motif analysis with chromVAR25 identified Tcf+Lef consensus sequence as the top-ranked motif in wild-type over dKO CD8+ T cells (Fig. 2d,e), consistent with an establish role for Tcf1 in establishing and/or maintaining ChrAcc in T cells13, 26, 27. The next top-ranked motifs were Stat5a and Stat5b, showing stronger enrichment in IL-7+IL-15-stimulated CD8+ T cells than their naïve counterparts (Fig. 2d,e)5. Unexpectedly, CTCF motif was also highly enriched in IL-7+IL-15-stimulated cells (Fig. 2d,e), suggesting that Tcf1 could engage CTCF to promote CD8+ T cell homeostasis.
To investigate the contribution by CTCF, we performed CTCF CUT&RUN in wild-type and dKO CD8+ T cells before and after IL-7+IL-15 stimulation. CTCF occupancy profile in each group of cells was in distinct clusters, and CTCF binding peaks in all groups invariably had CTCF consensus sequence as the top three motifs (Extended Data Fig. 4a,b), indicating validity of the CUT&RUN approach. Key pairwise comparisons identified 6,876 CTCF peaks that showed differential binding strength, which were resolved into 7 distinct clusters using K-means clustering (Fig. 2f). The CTCF binding cluster 1 (CtcfC1) and CtcfC2 peaks were induced by IL-7+IL-15 stimulation in wild-type CD8+ T cells, and the induction in CtcfC1 peaks was diminished in dKO cells, while CtcfC6 and CtcfC7 peaks were similarly repressed in IL-7+IL-15-stimulated wild-type and dKO cells (Fig. 2f). On a global scale, the dynamic changes in CTCF binding strength were concordant with CTCF peak-associated DEGs, in terms of total numbers or relative enrichment (Extended Data Fig. 4c,d). For example, Pilrb1, which contributes to T cell recruitment to inflamed skin28, and N4bp1, which negatively regulates NF-κB29, were genes in ExpC1, and acquired ‘de novo’ CTCF binding and ChrAcc sites in their introns in IL-7+IL-15-stimulated wild-type CD8+ T cells, which were diminished in strength in IL-7+IL-15-stimulated dKO cells (Fig. 2g). These observations suggested that Tcf1 and CTCF acted cooperatively to regulate ChrAcc and gene expression during homeostatic proliferation of CD8+ T cells.
Tcf1-CTCF colocalization confers unique functionality
CUT&RUN has the advantage of capturing target proteins in their native complex associated with DNA elements in live cells30, but may have off-target effects due to the micrococcal nuclease activity. We additionally performed CTCF ChIP-seq in naïve CD8+ T cells that were sequentially fixed with disuccinimidyl glutarate and formaldehyde to facilitate detection of both direct and indirect CTCF binding sites31, where the clone B-5 CTCF antibody outperformed others (Extended Data Fig. 4e,f). CUT&RUN and ChIP-seq each detected >30,000 high-confidence CTCF peaks in naïve CD8+ T cells, with >75% peaks overlapping (Fig. 3a). CUT&RUN-specific, ChIP-seq-specific and common CTCF peaks were all enriched in CTCF motif (Fig. 3a), overlapped extensively with Rad21 ChIP-seq peaks32 (Extended Data Fig. 5a), and showed stronger chromatin interaction scores at CTCF-bound anchors than those at random anchors20 (Fig. 3b), similar to observations in human ESCs33 (Extended Data Fig. 5b,c). These analyses indicated that CUT&RUN and ChIP-seq were complementary approaches for identifying CTCF binding events with biological importance.
Figure 3. Tcf1 and CTCF exhibit prevalent colocalization in naïve CD8+ T cell genome.
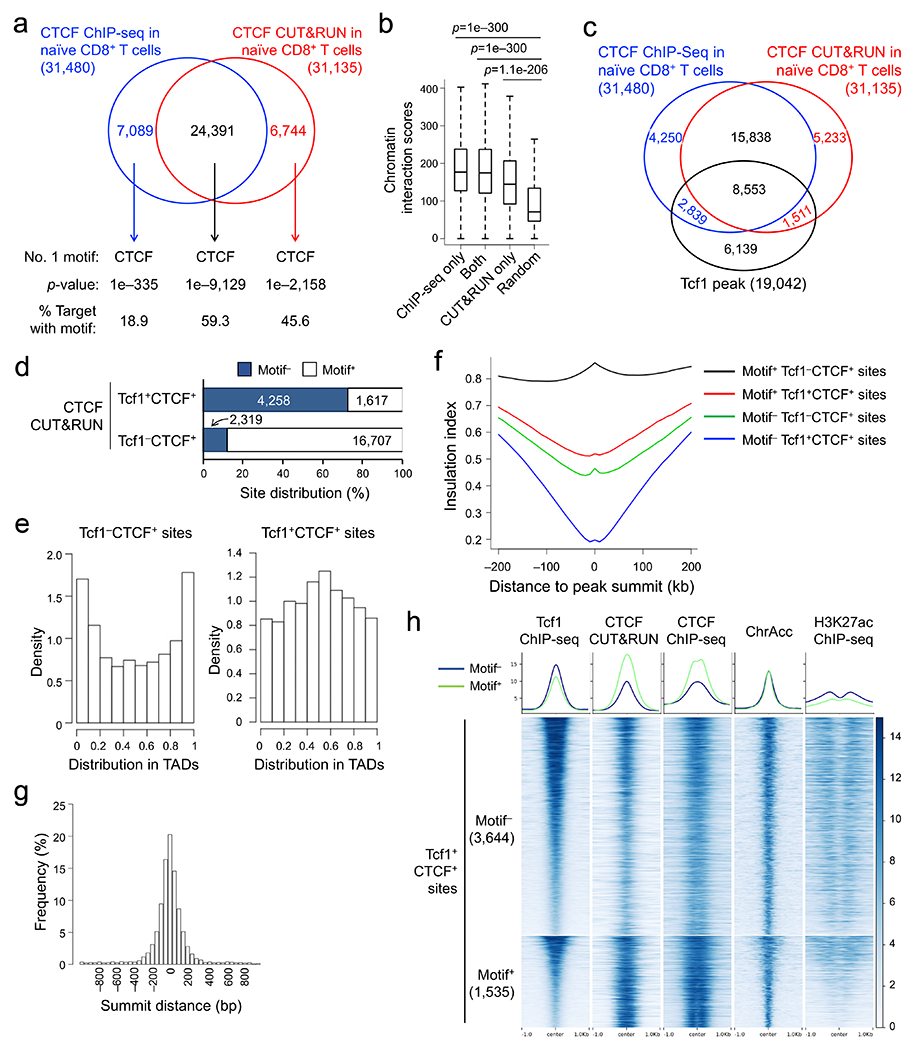
a. Venn diagram showing overlap between ChIP-seq- and CUT&RUN-detected CTCF peaks in naïve WT CD8+ T cells, with the top-ranked motif and characteristics marked for each group as determined with HOMER. b. Box plots summarizing chromatin interaction scores of anchors harboring different groups of CTCF peaks (as defined in a), based on Hi-C data in naïve CD8+ T cells (Ref. 20), with randomly selected 2,000 genomic locations as a negative control and P-values determined with one-sided MWU test. The box center lines denote the median, box edge denotes interquartile range (IQR), and whiskers denote the most extreme data points that are no more than 1.5 × IQR from the edge. c. Venn diagram showing overlap between CTCF and Tcf1 binding peaks in naïve WT CD8+ T cells. d. CTCF motif distribution in Tcf1+CTCF+ and Tcf1−CTCF+ in distal regulatory regions (as determined with CUT&RUN using the motifmatchr package in R), with values in bars denoting actual numbers of sites with or without the motif. e. Positional distribution of Tcf1−CTCF+ (left) and Tcf1+CTCF+ (right) sites within TADs, where CTCF binding sites were determined with CUT&RUN. f. Profiles of insulation index around the four types of CTCF binding sites where Motif+ denotes the presence of CTCF motif (as determined with CUT&RUN). g. Distribution of summit distance (in 50 bp resolution) between Tcf1 and CTCF peaks at Tcf1+CTCF+ sites (detected by both CUT&RUN and ChIP-seq methods). h. Heatmaps showing local chromatin characteristics (including Tcf1 and CTCF binding peaks, ChrAcc and H3K27ac) of Motif− and Motif+ Tcf1+CTCF+ sites in distal regulatory regions (detected by both CUT&RUN and ChIP-seq methods), with aggregated profiles for each feature shown on the top. Color scale denotes relative strength of each molecular feature.
Stratifying Tcf1 and CTCF binding peaks in naïve CD8+ T cells showed that >50% Tcf1 peaks colocalized with CUT&RUN- and ChIP-seq-detected CTCF (Fig. 3c). This overlapping rate was substantially higher than that between CTCF and other transcription factors, as observed in GM12878 and K562 leukemic cell lines and primary B lymphocytes32, 34(Extended Data Fig. 5d,e). CTCF binding sites are mostly conserved among hematopoietic lineages35, and comparing CTCF ChIP-seq in total T and B cells32 identified 8.0% and 5.8% peaks as T- and B-specific CTCF peaks (Extended Data Fig. 5f). Tcf1 peaks showed substantially more frequent overlap with T cell-specific than B cell-specific CTCF peaks, and CTCF binding strength at T cell-specific Tcf1+CTCF+ sites was markedly higher than that at B cell-specific Tcf1+CTCF+ sites, as exemplified at the Myb and Pax5 gene loci (Extended Data Fig. 5i). These data indicated that Tcf1 and CTCF cooperativity represented a unique feature specific to T-lineage cells.
Considering the unique cooperativity between T cell identity-defining Tcf1 and ubiquitously expressed CTCF, we next investigated if Tcf1+CTCF+ sites had distinct features and functions from Tcf1−CTCF+ sites in naïve CD8+ T cells. CTCF binding sites detected with CUT&RUN and ChIP-seq methods were analyzed in parallel to provide independent validation of key observations. While Tcf1−CTCF+ sites were predominantly in distal regulatory regions and enriched in CTCF motifs, >40% Tcf1+CTCF+ sites were associated with gene promoters and were more enriched in Ets, Runx and Tcf+Lef motifs (Extended Data Fig. 6a–f). By focusing on distal CTCF peaks, a direct motif search showed that CTCF motif was found in >80% Tcf1−CTCF+ sites but in only a quarter of Tcf1+CTCF+ sites (Fig. 3d, Extended Data Fig. 6g). CTCF regulates the 3D genomic architecture by establishing insulation between TADs and promoting chromatin looping within TADs21, 22. While Tcf1−CTCF+ sites were enriched at the TAD boundaries, Tcf1+CTCF+ sites were more frequently found within TAD (Fig. 3e, Extended Data Fig. 6h). Using an insulation index to quantify the strength of TAD boundaries36, Motif+Tcf1−CTCF+ sites (i.e., containing CTCF motif) had the highest insulation index, while Motif−Tcf1+CTCF+ sites showed the lowest insulation index (Fig. 3f, Extended Data Fig. 6i). These analyses suggested that CTCF at most Tcf1+CTCF+ sites functioned as a transcriptional coregulator, unlike its function as an insulator at Tcf1−CTCF+ sites.
Distance analysis showed that the summits of Tcf1 and CTCF peaks frequently appeared in proximity at the Tcf1+CTCF+ sites (Fig. 3g), and that Tcf+Lef motifs frequently occurred at the center of CTCF peaks and vice versa (Extended Data Fig. 7a). The binding strength between Tcf1 and CTCF peaks showed concordant changes at Motif− but not Motif+Tcf1+CTCF+ sites (Fig. 3h, Extended Data Fig. 7b,c). Consistent with frequent overlap between CTCF binding and ChrAcc sites in B and Th2 cells37, 38, 39, 66% of CTCF peaks overlapped with ChrAcc sites in naïve CD8+ T cells (Extended Data Fig. 7d,e). In particular, Motif−Tcf1+CTCF+ sites were associated with strong ChrAcc and H3K27ac signals (Fig. 3h), while Tcf1−CTCF+ sites, regardless of Motif+ or Motif− status, were mostly devoid of H3K27ac modification and were associated with weak ChrAcc signals (Extended Data Fig. 7f). These observations suggested that CTCF adopted unique functions at Motif−Tcf1+CTCF+ sites, i.e., cooperating with Tcf1 and Lef1 to control ChrAcc and/or enhancer activity in naïve CD8+ T cells.
Tcf1 recruits CTCF as a transcriptional cofactor.
The prevalent Tcf1 and CTCF colocalization in CD8+ T cell genome suggested direct physical interaction between the two factors. We performed reciprocal immunoprecipitation in the presence of ethidium bromide (EtBr) to eliminate DNA-mediated protein association40. Tcf1 and CTCF immunoprecipitated with each other in primary naïve CD8+ T cells (Fig. 4a,b). FLAG-tagged full-length Tcf1 full-length co-immunoprecipitated with HA-tagged CTCF when co-transfected into 293T cells, so did Tcf1 truncation mutants including Δ1-115 (N-terminal deletion of β-catenin binding domain), ΔLoop3 and ΔLoop4 (internal deletions diminishing Tcf1-HDAC activity)9 (Fig. 4c). In contrast, Δ251-419 (C-terminal deletion of HMG DNA binding domain) abrogated interaction with CTCF (Fig. 4c). HA-tagged full-length CTCF co-immunoprecipitated with FLAG-tagged Tcf1 when co-transfected into 293T cells, so did N-terminal (Δ1-100 and Δ101-263) and C-terminal (Δ581-736) truncation mutants (Fig. 4d). Δ266-577 (internal deletion of zinc-finger DNA binding domain) abrogated interaction with Tcf1 (Fig. 4d). Thus, Tcf1 and CTCF both utilized their DNA binding domains as contacting surface.
Figure 4. Tcf1 recruits CTCF to the CD8+ T cell genome via direct interaction.
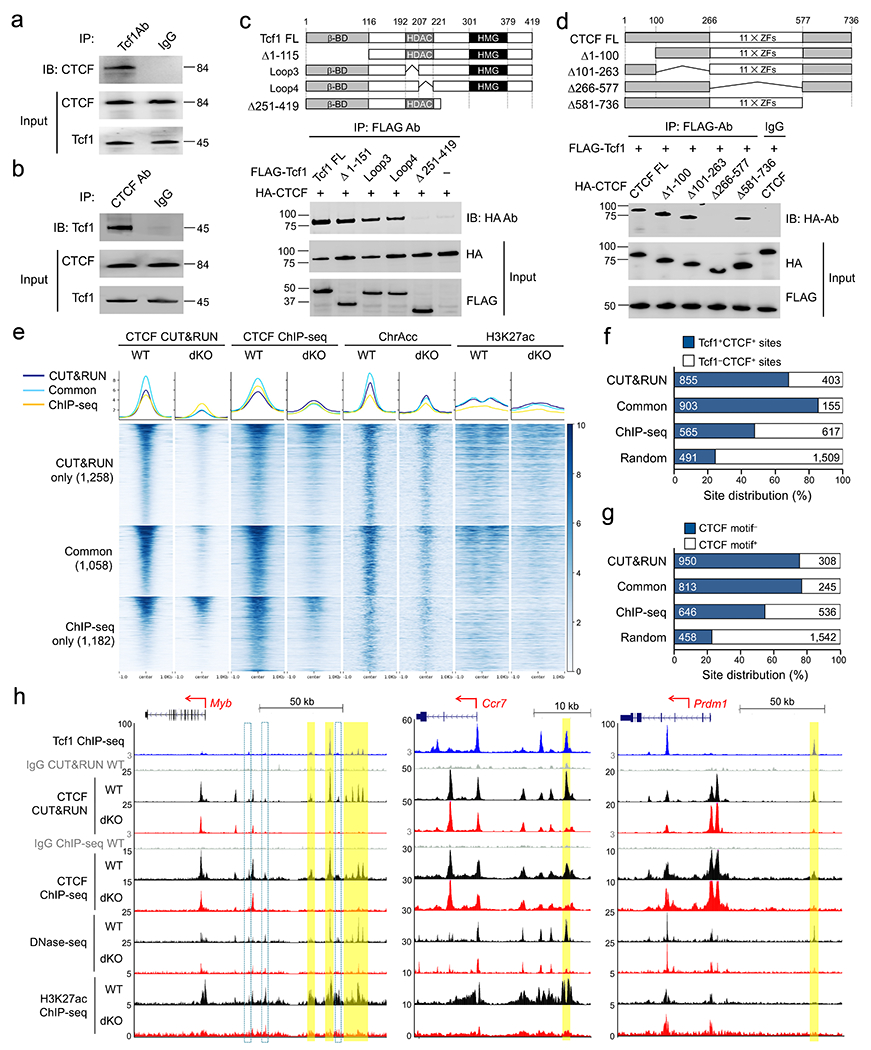
a–b. Co-immunoprecipitation of CTCF by an anti-Tcf1 antibody (a) and co-immunoprecipitation of Tcf1 by an anti-CTCF antibody (b) in the presence of EtBr in primary naïve CD8+ T cells. c. Co-immunoprecipitation of HA-tagged CTCF by FLAG-tagged Tcf1 full-length (FL) or mutant proteins (structures shown in diagram on the top) with an anti-FLAG antibody in the presence of EtBr after co-transfected into 293T cells. d. Co-immunoprecipitation of FLAG-tagged Tcf1 with HA-tagged CTCF full-length (FL) or mutant proteins (structures shown in diagram on the top) with an anti-FLAG antibody in the presence of EtBr after co-transfected into 293T cells. Data in a–d are representative from ≥2 independent experiments. e. Heatmaps showing changes in local chromatin features (including CTCF binding peaks, ChrAcc and H3K27ac) between naïve WT and dKO GFP+CD8+ T cells, at Tcf1+Lef1-dependent CTCF binding sites as detected by CUT&RUN and/or ChIP-seq methods, with aggregated profiles for each feature shown on the top. Color scale denotes relative strength of each molecular feature. f–g. Distribution of Tcf1+CTCF+ and Tcf1−CTCF+ sites (f) and Motif− and motif+ CTCF sites (g) in Tcf1+Lef1-dependent CTCF binding peaks as detected by CUT&RUN and/or ChIP-seq methods, with 2,000 randomly selected non-differential CTCF binding sites between WT and dKO CD8+ T cells as negative controls. h. Sequencing tracks of Tcf1 ChIP-seq in naïve WT, CTCF CUT&RUN and CTCF ChIP-seq, DNase-seq and H3K27ac ChIP-seq in naïve WT and dKO GFP+CD8+ T cells at the Myb, Ccr7, and Prdm1 gene loci, with gene structure, transcription orientation, and genomic scale displayed on the top. Bars in yellow mark Tcf1+Lef1-dependent Tcf1+CTCF+ site(s) detected with both CUT&RUN and CTCF ChIP-seq methods, while open bars with cyan borders mark those determined with one method only.
To determine if Tcf1+Lef1 were responsible for CTCF recruitment to the CD8+ T cell genome, we performed CTCF ChIP-seq and CUT&RUN in wild-type and dKO naïve CD8+ T cells, and each method identified ~2,300 CTCF peaks showing diminished binding strength in dKO compared to wild-type CD8+ T cells (Extended Data Fig. 8a,b). Among Tcf1+Lef1-dependent CTCF peaks, 1,058 were detected with both methods, while those uniquely detected with one method also showed evident reduction in CTCF binding strength when measured by the other method (Fig. 4e), indicating different detection sensitivity by each method. All Tcf1+Lef1-dependent CTCF peaks, regardless of detection methods, showed consistent reduction in ChrAcc and H3K27ac signals in dKO compared to wild-type CD8+ T cells (Fig. 4e), while CTCF peaks that were not affected by Tcf1+Lef1 deficiency showed similar ChrAcc and H3K27ac states (Extended data Fig. 8c). Tcf1+Lef1-dependent CTCF peaks were more frequently associated with Tcf1+CTCF+ sites but less frequently linked to CTCF motifs (Fig. 4f,g), as also observed in Ctcf5 and Ctcf6 clusters (Fig. 2f). For example, Tcf1 and Lef1 maintain ChrAcc sites upstream of Myb, Ccr7 and Prdm1 in an ‘open’ state in naïve CD8+ T cells20. These Tcf1+Lef1-dependent ChrAcc sites were Tcf1+CTCF+ sites and were Tcf1+Lef1-dependent (Fig. 4h), with similar sites observed at the Ccne1, Tox and Irf4 gene loci (Extended Data Fig. 8d). These observations suggested that Tcf1 and Lef1 recruited CTCF as a transcriptional cofactor to regulate identity and function of naïve CD8+ T cells.
CTCF is mobilized by homeostatic cytokines.
IL-7+IL15 stimulation induced CTCF binding in CtcfC1 and CtcfC2 clusters (Fig. 2f). The induction at CtcfC1 sites depended on Tcf1 and Lef1, with 36% as Tcf1+CTCF+ sites, whereas 18% Tcf1+Lef1-independent CtcfC2 sites were co-occupied by Tcf1 (Fig. 2f), suggesting that Tcf1 and CTCF cooperated to regulate responsiveness to homeostatic cytokines in CD8+ T cells. By analysis with Genomic regions enrichment of annotations tool (GREAT)41, CtcfC1 sites were associated with lymphocyte activation, differentiation, and proliferation (Fig. 5a). CtcfC1 sites were linked to 294 genes in ExpC1, of which 58 were associated with cell cycle and 19 with DNA replication (Fig. 2a). For example, Tcf1 binding peaks, as observed in upstream regions of Ccne1, Eomes, and Setbp1 (having integrative transcription activation function42) and downstream regions of E2f3 and E2f7 (Fig. 5b–d), had negligible CTCF binding signals in naïve CD8+ T cells, showed potent increase in CTCF binding strength after IL-7+IL-15 stimulation in wild-type, but less so in dKO CD8+ T cells. Notably, several Tcf1-bound regions were Tcf1+CTCF+ sites in naïve CD8+ T cells, and CTCF binding strength at these sites was compromised in dKO CD8+ T cells before and after IL-7+IL-15 stimulation, as observed in introns of Ccne1, upstream of Ccne2 and Eomes, and downstream of E2f7 and Pgam1, which encodes phosphoglycerate mutase (Fig. 5b–d). Not all CtcfC1 sites occurred at Tcf1-prebound sites, as observed upstream of Eomes and Tyms, which encodes thymidylate synthase (Fig. 5d), and their impaired induction in dKO CD8+ T cells was likely due to topological changes (see below). These observations highlighted the highly cooperative nature between Tcf1 and CTCF in supporting CD8+ T cell homeostasis.
Figure 5. CTCF is mobilized by homeostatic cytokines.
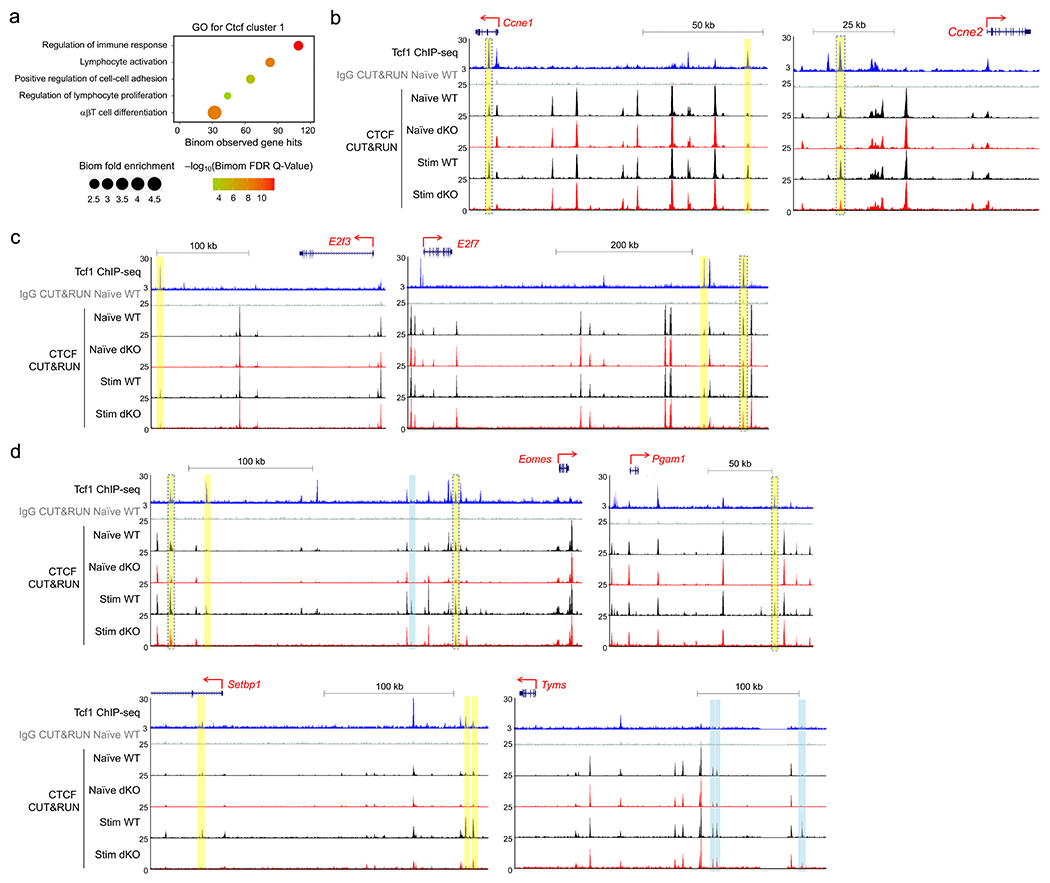
a. GO terms for genes linked to CtcfC1 sites using GREAT analysis, with dot size denoting term enrichment and dot color denoting statistical significance. b–d. Sequencing tracks of Tcf1 ChIP-seq in naïve WT and CTCF CUT&RUN in WT and dKO CD8+ T cells in naïve state and after 72-hr IL7+IL-15 stimulation, at select gene loci encoding cyclins (b), E2F family TFs (c), and other cell cycle/DNA replication regulatory factors (d). Gene structure, transcription orientation and genomic scales are displayed on the top of each panel. All colored bars denote CtcfC1 binding sites, with yellow and cyan ones marking the presence and absence of Tcf1 peaks, respectively, and yellow bars with blue borders marking CTCF binding sites that showed diminished binding strength in both naïve and IL-7+IL-15-stimulated dKO CD8+ T cells compared with their WT counterparts.
Tcf1 and CTCF cooperate to shape chromatin interactions.
Considering the established roles of Tcf1 and CTCF in 3D genomic organization20, 21, 22, we investigated their cooperativity in organizing chromatin architecture to promote CD8+ T cell homeostasis, by performing Hi-C on IL-7+IL-15-stimulated wild-type and dKO CD8+ T cells. The Hi-C libraries were reproducible between replicates (Extended data Fig. 9a) and were pooled for improved sensitivity in downstream analyses. We defined an interaction score for each 10-kb anchor by summing up its interaction with the rest of the chromosome in both directions. Focused analysis on anchors harboring CtcfC1–CtcfC7 clusters (Fig. 2f) showed that the dynamic CTCF binding sites in each cluster mostly exhibited concordant, statistically significantly changes in chromatin interaction scores (Fig. 6a). Specifically, CtcfC5 and CtcfC6 sites showed reduced CTCF binding strength and chromatin interaction scores in naïve dKO compared with naïve wild-type CD8+ T cells (Fig. 6a). For example, the Irf4 and Myb promoters and flanking regions showed extensive interactions with their upstream regions harboring clusters of Tcf1+CTCF+ sites, observed as ‘interaction patches’, in naïve wild-type CD8+ T cells (Fig. 6b). The chromatin interaction strength within the ‘patches’ were substantially diminished in naïve dKO compared to naïve wild-type CD8+ T cells, concordant with decreased CTCF binding strength at their upstream Tcf1+CTCF+ sites (Fig. 6b,c). On the other hand, CtcfC1 and CtcfC2 sites showed concordantly increased CTCF binding strength and chromatin interaction scores in IL-7+IL-15-stimulated wild-type compared to naïve wild-type CD8+ T cells (Fig. 6a). For example, the Tnfsf8 promoter and introns (encoding CD30L43) contained several CtcfC1 sites and showed increased chromatin interactions with upstream regions harboring dynamic or constitutive CTCF sites, observed as ‘interaction stripes’, in IL-7+IL-15-stimulated wild-type CD8+ T cells (Fig. 6d). The chromatin interaction strength within the “stripes” were diminished in IL-7+IL-15-stimulated dKO CD8+ T cells (Fig. 6d,e), concordant with insufficient induction in CTCF binding strength therein. These global and gene-centric analyses demonstrated that Tcf1 and CTCF cooperated to promote chromatin interactions in naïve and IL-7+IL-15-stimulated CD8+ T cells.
Figure 6. Tcf1 and cooperate with CTCF to regulate chromatin interactions in CD8+ T cells.
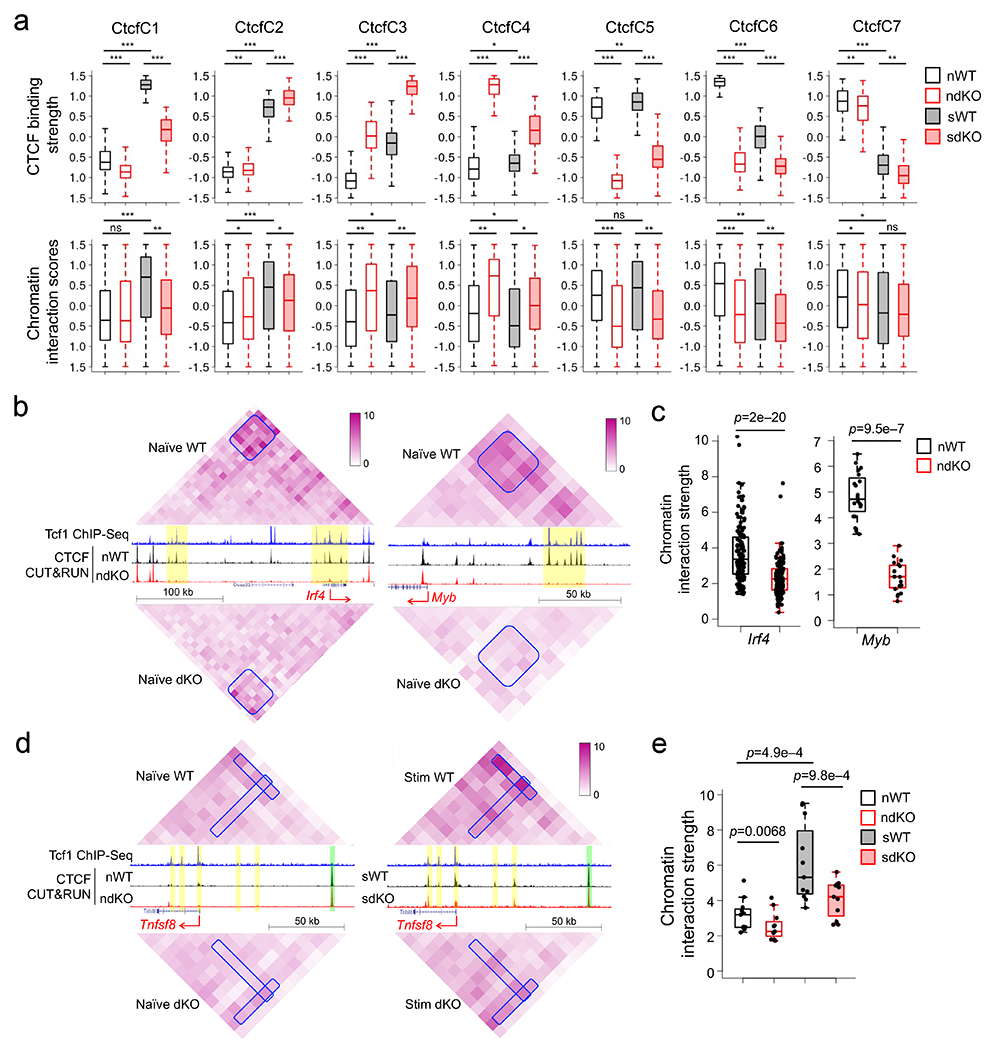
a. Box plots summarizing CTCF binding strength in each CTCF cluster as defined in Fig. 2f (top) and chromatin interaction scores of anchors harboring corresponding CTCF sites in each cluster (bottom), with both parameters z-score-transformed and plotted for naïve WT and dKO (nWT and ndKO, respectively), and IL-7+IL-15-stimulated WT and dKO (sWT and sdKO, respectively) CD8+ T cells. *, p<0.05; **, p<1e–10; ***, p<1e–30 by one-sided paired Wilcoxon test. b. Diamond graphs showing distance-normalized chromatin interactions in naïve WT (top) and dKO CD8+ T cells (bottom) at the Irf4 (left) and Myb (right) gene loci, as displayed on WashU epigenome browser, with blue boxes denoting chromatin interaction ‘patches’ showing marked changes. Shown in the middle are gene structures, Tcf1 ChIP-seq tracks in naïve WT, CTCF CUT&RUN tracks in naïve WT and dKO CD8+ T cells, with yellow bars denoting Tcf1+Lef1-dependent CTCF binding sites. c. Box plots summarizing the chromatin interaction strength for each pair of 10-kb anchors within the interaction ‘patches’ at the Irf4 or Myb gene locus in naïve WT and dKO CD8+ T cells, with p-value determined using one-sided paired Wilcoxon test. d. Diamond graphs showing distance-normalized chromatin interactions in naïve (left) and IL-7+IL-15-stimulated (right) WT (top) and dKO CD8+ T cells (bottom) at the Tnfsf8 gene locus, with blue boxes denoting chromatin interaction ‘stripes’ with marked changes. Shown in the middle are gene structure, Tcf1 ChIP-seq tracks in naïve WT, CTCF CUT&RUN tracks in naïve (left) and IL-7+IL-15-stimulated (right) WT and dKO CD8+ T cells, with yellow and green bars denoting dynamic and constitutive CTCF binding sites, respectively. e. Box plots summarizing the chromatin interaction strength within the interaction ‘stripes’ at the Tnfsf8 gene locus in naïve or IL-7+IL-15-stimulated WT and dKO CD8+ T cells, with p-value determined using one-sided paired Wilcoxon test. Parameters for box plots (a, c, e) are the same as Fig. 3b. Color scale (b, d) denotes chromatin interaction strength.
Besides ‘stripes’ and ‘patches’, chromatin interactions occur broadly within a TAD or sub-TAD44. To capture the highly interconnected nature, we used HiCHub to assess chromatin interactions from a network perspective using the igraph platform20, 45. HiCHub extracts all chromatin interactions with the same directional changes between two cell types, identifies 3D chromatin interaction clusters and integrates numbers, strength and statistical significance of chromatin interactions among the regions to generate cell type-specific interaction hubs20, 45. Comparative analysis of HiC data from naïve wild-type and dKO CD8+ T cells using HiCHub identified 521 wild-type-specific and 511 dKO-specific chromatin interaction hubs, which were enriched with wild-type-specific and dKO-specific CTCF peaks, respectively (Fig. 7a). As exemplified in a wild-type-specific hub harboring Myb, its promoter exhibited architectural proximity with nodes containing Tcf1 peaks and/or Tcf1+Lef1-dependent CTCF peaks; conversely, a dKO-specific hub that harbors several Ccl genes showed extensive connectivity with CTCF peaks showing increased binding strength in dKO CD8+ T cells (Extended data Fig. 9b,c), highlighting the requirement for Tcf1-CTCF cooperativity in forming proper genomic architecture in CD8+ T cells.
Figure 7. Tcf1 and Lef1 cooperate with CTCF to organize dynamic chromatin interaction hubs in homeostatic cytokine-stimulated CD8+ T cells.
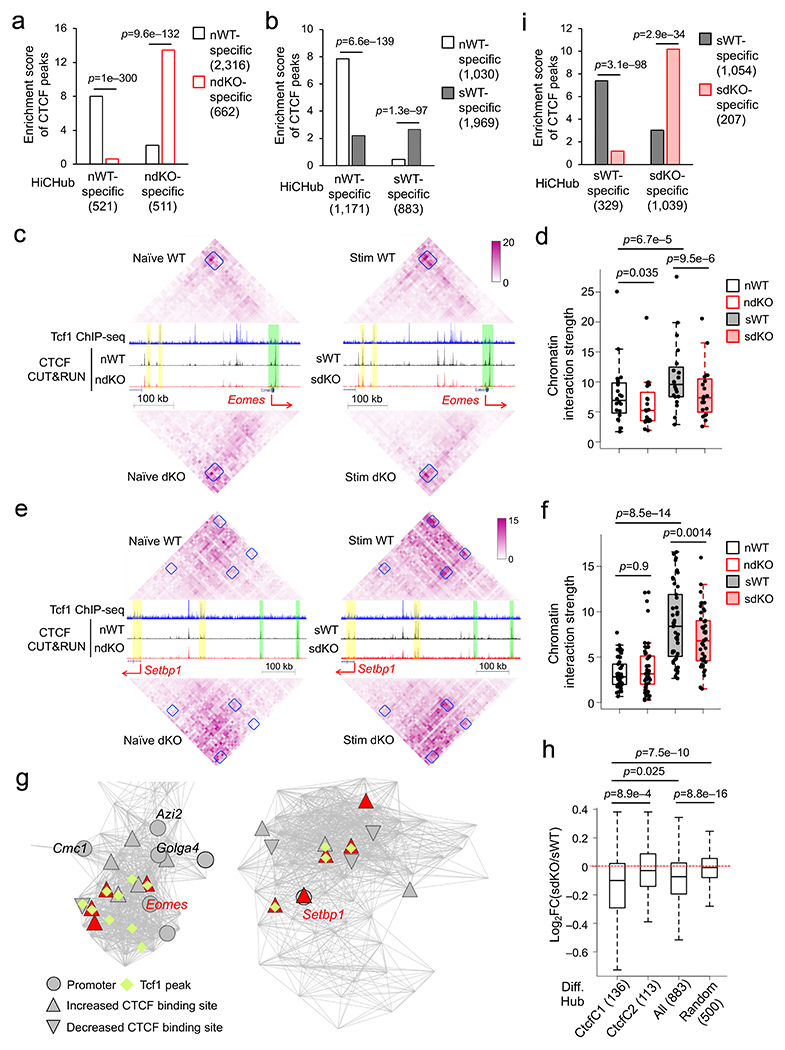
a, b, and i. Enrichment analysis of cell type-specific CTCF binding sites in chromatin interaction hubs specific to the same cell type. a, comparison of naïve WT and dKO CD8+ T cells; b, comparison of naïve WT and IL-7+IL-15-stimulated WT CD8+ T cells; and i, comparison of IL-7+IL-15-stimulated WT and dKO CD8+ T cells, where numbers of cell type-specific CTCF binding sites and interaction hubs were denoted in parentheses and p-values were determined using one-sided binomial test. c, e. Diamond graphs showing marked changes in chromatin interactions at the Eomes (c) and Setbp1 (e) gene loci, with the same layout as Fig. 6d and Color scale denoting chromatin interaction strength. f, h. Box plots summarizing the chromatin interaction strength within the interaction ‘patches’ at the Eomes (f) and Setbp1 (h) gene loci, with p-value determined using one-sided paired Wilcoxon test. g. Network view of Eomes- or Setbp1-containing chromatin interaction hubs specific to IL-7+IL-15-stimulated compared to naïve WT CD8+ T cells as determined with HiCHub. Grey lines denote increased chromatin interactions in IL-7+IL-15-stimulated WT CD8+ T cells, and the nodes represent 10-kb bins belonging to the network community underlying the hub, where 49 and 84 nodes were in the Eomes (left) and Setbp1 (right) hubs, respectively. Circles denote bins containing gene promoters, diamonds denote the presence of Tcf1 peaks, and red triangles denote statistically significant increase in CTCF binding strength in IL-7+IL-15-stimulated WT CD8+ T cells. h. Box plots summarizing Log2 fold changes (FC) in chromatin interaction strength between IL-7+IL-15-stimulated dKO and IL-7+IL-15-stimulated WT CD8+ T cells within all, Ctcf1- or Ctcf2-linked IL-7+IL-15-stimulated WT CD8+ T cell-specific 883 hubs as defined in b, with 500 random regions with 20-bin length as a negative control and p-values determined using one-sided MWU test. Parameters for box plots (d, f, h) are the same as Fig. 3b.
HiCHub analysis of HiC data from naïve and IL-7+IL-15-stimulated wild-type CD8+ T cells identified 1,171 naïve and 883 IL-7+IL-15-stimulated cell-specific hubs, which were enriched with cell type-specific CTCF peaks therein (Fig. 7b), indicating the coordinated nature of dynamic CTCF binding and chromatin interaction changes in CD8+ T cells in response to homeostatic cytokines. The Eomes gene locus, which harbored constitutive CTCF peaks, showed weak interactions with its upstream regions in naïve wild-type CD8+ T cells (Fig. 7c). An interaction ‘patch’ connecting Eomes with a cluster of dynamic CTCF sites in a ~300 kb upstream region exhibited increased chromatin interaction strength after IL-7+IL-15 stimulation (Fig. 7c,d). In IL-7+IL-15-stimulated wild-type CD8+ T cells, the Setbp1 promoter and ~200 kb upstream region acquired increased CTCF binding and formed an interaction ‘patch’ in-between, and both regions formed additional interaction ‘patches’ with further upstream regions with constitutive CTCF peaks (Fig. 7e,f, Extended data Fig. S9d–f), indicating that dynamic CTCF binding induced by IL-7+IL-15 bridged interactions with distal regions constitutively bound by CTCF to coordinate transcriptional activation. HiCHub identified Eomes and Setbp1 in distinct chromatin interaction hubs specific to IL-7+IL-15-stimulated WT CD8+ T cells (Fig. 7g), where each gene showed high-degree connectivity and architectural proximity with Tcf1 peaks and IL-7+IL-15-induced dynamic CTCF peaks in 3D space.
Focusing on interaction hubs specific to IL-7+IL-15-stimulated versus naïve wild-type CD8+ T cells, the chromatin interaction strength in the hubs was reduced on a global scale compared with random regions in IL-7+IL-15-stimulated dKO CD8+ T cells, and the reduction in CtcfC1-linked hubs was more pronounced than that in CtcfC2-linked hubs (Fig. 7h), suggesting that Tcf1+Lef1-dependent CTCF mobilization was correlated with corresponding chromatin interaction changes. HiCHub analysis of the HiC data from IL-7+IL-15-stimulated wild-type and IL-7+IL-15-stimulated dKO CD8+ T cells identified 329 stimulated wild-type- and 1,039 stimulated dKO-specific hubs, which were enriched with cell type-specific CTCF peaks therein (Fig. 7i). In the chromatin interaction ‘patches’ exemplified at the Eomes and Setbp1 loci, while the interaction strength was not detectably different between naïve wild-type and dKO CD8+ T cells, the increase in interaction strength induced by IL-7+IL-15 stimulation in wild-type CD8+ T cells was diminished in IL-7+IL-15 stimulated dKO CD8+ T cells (Fig. 7c–f). These data indicated that Tcf1 and Lef1 cooperated with CTCF to organize chromatin interaction changes underlying homeostatic proliferation of CD8+ T cells.
CTCF is required for CD8+ T cell homeostasis
We next generated hCD2-Cre+Rosa26GFPCtcfFL/FL (hereafter Ctcf−/−) mice. The resulting Ctcf−/− CD8+ T cells showed normal expression of Tcf1 or Lef1, no induction of activation markers, and sustained initial proliferation within 72 hrs of TCR stimulation (Extended data Fig. 1a,10a,b), but showed impaired proliferation when stimulated with IL-7+IL-15 ex vivo (Fig. 8a). Seventy-two hours after separate transfer into Rag1−/− mice, substantial lower portion of Ctcf−/− CD8+ T cells showed cell division in vivo than wild-type cells (Fig. 8b), while similar portions of wild-type and Ctcf−/− CD8+ T cells were AnnexinV+ (Fig. 8c). These observations indicated CTCF shared the same requirement as Tcf1 and Lef1 for homeostatic proliferation of CD8+ T cells.
Figure 8. CTCF regulates homeostatic proliferation of CD8+ T cells by controlling a similar set of target genes as Tcf1 and Lef1.
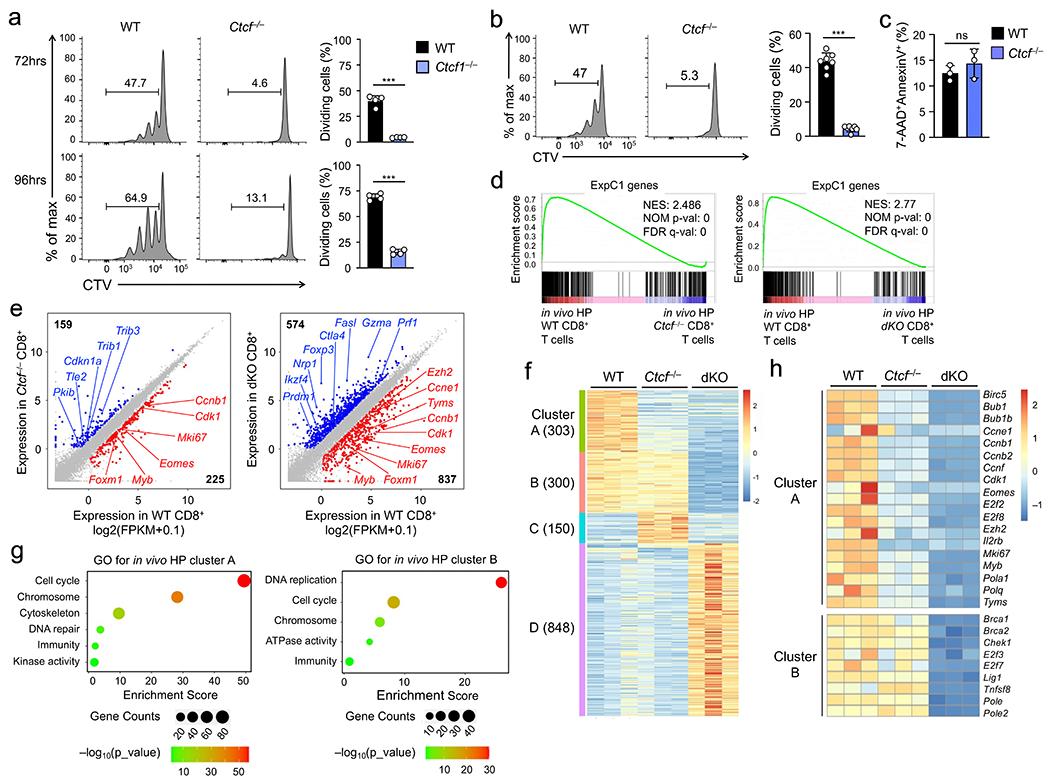
a. Cell division of CTV-labeled naïve WT or Ctcf−/− CD45.2+GFP+CD8+ T cells at 72 (top) or 96 hrs (bottom) after ex vivo culture with IL-7 and IL-15, with frequency of cells showing ≥1 division summarized (right). b. Cell division of CTV-labeled WT and Ctcf−/− CD45.2+GFP+CD8+ T cells at 72 hrs after separate transfer into Rag1−/− mice, with frequency of cells showing ≥1 division summarized (right). c. Detection of AnnexinV+7-AAD− apoptotic cells in WT and Ctcf−/− CD45.2+GFP+CD8+ T cells at 72 hrs after separate transfer into Rag1−/− mice. Data in a–c are from 2 independent experiments, and bar graphs are means ± s.d. ***, p<0.001; ns, not statistically significant by two-tailed Student’s t-test. d. GSEA enrichment plots for the ExpC1 gene set (defined in Fig. 2a) in comparison of WT vs. Ctcf−/− (left) and WT vs. dKO CD8+ T cell transcriptomes (right), as determined with RNA-seq analysis of WT, Ctcf−/−, dKO CD8+ T cells that underwent in vivo homeostatic proliferation (HP) in Rag1−/− hosts for 72 hrs. NES, normalized enrichment score; NOM p-val, nominal P values; FDR q-val, false discovery rate q values. e. Scatter plots showing DEGs between WT and Ctcf−/− (left) and those between WT and dKO CD8+ T cells (right), with values in corners denoting DEG numbers and select genes marked. f. Clusters of DEGs as defined in e, with values in parentheses denoting gene numbers in each cluster. g. GO terms of genes in Clusters A and B as determined with the DAVID Bioinformatics Resources, with dot size denoting gene counts and dot color denoting statistical significance. h. Heatmap showing the expression of select genes in cell cycle regulation from Clusters A and B. Color scale (g, h) denotes relative gene expression.
We then performed RNA-seq analyses on wild-type, Ctcf−/− and dKO CD8+ T cells isolated 72 hrs post-transfer into Rag1−/− mice, where they were exposed to homeostatic cytokines in vivo. Each cell type was in distinct clusters (Extended data Fig. 10c). By gene set enrichment analysis (GSEA), the ExpC1 gene set was highly enriched in wild-type CD8+ cells that underwent homeostatic proliferation in vivo, showing diminished expression in Ctcf−/− and dKO CD8+ T cells (Fig. 8d, Extended data Fig. 10d,e). Tcf1+Lef1 deficiency caused broader transcriptomic changes than loss of CTCF (Fig. 8e), and these DEGs were resolved into four distinct clusters (A-D) (Fig. 8f, Supplementary Table 2). Genes in cluster A were downregulated in both Ctcf−/− and dKO CD8+ T cells, and were strongly enriched in cell cycle regulators, including cyclins (Ccnb1, Ccne1), cyclin-dependent kinase (Cdk1), and transcription factors (E2f2, E2f8, Eomes and Myb) (Fig. 8g,h), indicating that CTCF and Tcf1+Lef1 controlled a core transcriptional program underlying homeostatic proliferation of CD8+ T cells. Genes in cluster B were more dependent on Tcf1+Lef1 than CTCF (Fig. 8f), and were enriched in regulators of DNA replication and cell cycle, such as Brca1, Chek1, E2f3 and E2f7 (Fig. 8g,h), suggesting that Tcf1+Lef1 controlled additional homeostatic genes with lesser involvement by CTCF. Genes upregulated in Ctcf−/− and dKO over wild-type CD8+ T cells were quite distinct from each other with diverse functions, as distributed in clusters C and D, respectively (Fig. 8f, Extended data Fig. 10f). This feature was in contrast to shared target genes activated by Tcf1 and CTCF, highlighting the specificity of their cooperativity in promoting CD8+ T cell homeostasis.
Discussion
Here we described the complex regulation of CD8+ T cell homeostasis by coordinated actions of Tcf1 and CTCF. The Tcf1-CTCF cooperativity acted on multiple aspects, including establishing the genomic architecture at naïve state, mediating dynamic redistribution of CTCF and modulating chromatin interactions in response to IL-7 and IL-15 stimulation. These extensive architectural changes in turn activated a transcriptional program controlling cell cycle progression and DNA replication, and promoted CD8+ T cell proliferation driven by homeostatic cytokines.
Tcf1 and Lef1 are historically known to engage Wnt-stabilized β-catenin coactivator46; however, a requirement for β-catenin in T lineage cells has been largely excluded47. In CD8+ T cells, over 50% of Tcf1 binding sites were co-occupied by CTCF, and many Tcf1+CTCF+ cobound sites lacked CTCF motif and depended on intact expression of Tcf1 and Lef1, indicating direct recruitment of CTCF by Tcf1 through physical interaction. The Tcf1-dependent CTCF binding events were concordant with changes in chromatin interactions in both naïve and cytokine-stimulated CD8+ T cells, as measured by interaction scores or connectivity within interaction hubs. This observation is well in line with the known functions of CTCF in chromatin loop assembly and spatial organization-based gene regulation in immune cells48. Therefore, the structural role of Tcf1 and Lef1 is at least partly mediated through engaging CTCF as a structural cofactor to provide identity supervision in naïve CD8+ T cells. Moreover, in response to homeostatic cytokines, Tcf1 and Lef1 recruit additional CTCF to further modulate chromatin interactions, in the forms of ‘stripes’, ‘patches’ and ‘hubs’, to support cell proliferative needs. Our data also support the notion that chromatin interactions are fluidic, detectably amenable and actively participate in gene regulation in response to environmental cues.
At over 50% CTCF binding sites, CTCF bound CD8+ T cell genome directly through its own motif. These Motif+ CTCF binding events were frequently found at the TAD boundaries and were largely independent of Tcf1 and Lef1. These features of the ‘constitutive’ CTCF binding were consistent with the insulator function of CTCF. Within the TADs, however, CTCF shows more dynamic distribution, through interaction with cell identity-defining transcription factors or influenced by environmental cues such as metabolic changes35, 49, 50. In CD8+ T cells, CTCF exhibited extensive changes in binding strength in response to homeostatic cytokines, and the Tcf1-dependent Tcf1+CTCF+ cobound sites were critical for sustaining chromatin accessibility and maintaining active enhancer state in naïve as well as homeostatic cytokine-stimulated CD8+ T cells. These observations indicate that Tcf1 and Lef1 utilize CTCF as a transcriptional cofactor at the regulatory element level, in addition to their cooperativity in organizing genomic architecture.
Like other transcription factors, Tcf1 bound to many genomic locations in naïve CD8+ T cells, but only a small fraction of Tcf1-assocation genes showed altered gene expression upon ablation of Tcf1 and Lef1. It has been a challenge to understand whether the transcriptionally inconsequential Tcf1 binding events contribute to T cell biology. Unlike profound Tcf1 downregulation in TCR-stimulated, differentiating CD8+ T cells, the expression of Tcf1 and Lef1 protein was preserved during CD8+ T cell homeostatic proliferation, providing an important biological context to investigate the functional link of Tcf1 binding events. In this setting, over 600 genes that were not differentially expressed in Tcf1+Lef1-deficient CD8+ T cells in naïve state, showed insufficient induction after cytokine stimulation. Half of these genes were bound by Tcf1 at promoter regions, and a vast majority of these genes was associated with Tcf1 binding in distal regions flanking the loci. These Tcf1 binding events therefore were not immediately impactful in naïve CD8+ T cells, but predetermined the ability of their associated genes to respond to stimulation by homeostatic cytokines. We hence propose the concept of ‘pre-programming” of cytokine responsiveness by strategic Tcf1 positioning in the CD8+ T cell genome. At least two mechanisms can be considered for the Tcf1-mediated ‘pre-programming’. Firstly, Tcf1-bound sites function as anchors for cytokine-mobilized CTCF through direct recruitment or cooperative binding to composite DNA elements, where Tcf1 and Lef1 are ‘directly’ involved. Secondly, through their structural roles in organizing 3D genomic architecture, Tcf1 and Lef1, together with CTCF, create a proper chromatin configuration with highly organized chromatin accessibility and interactions, which might become more accessible for Stat5 activated by homeostatic cytokines. In this context, Tcf1 and Lef1 do not need to be at the docking sites. This concept of ‘Tcf1-mediated pre-programming’ might be broadly applicable to other transcriptional factors in regulating T-cell responsiveness to stimulation of TCR, costimulatory or coinhibitory receptors12.
Methods
Mice.
C57BL/6J (B6), B6.SJL, Rag1−/−, hCD2-Cre, and Rosa26GFP mice were from the Jackson Laboratory, where hCD2-Cre-mediated deletion did not reach 100% and the Rosa26GFP allele used to mark Cre-active, target-deleted cells. Tcf7FL/FLand Lef1FL/FL mice were previously described51, 52 and CtcfFL/FL mice were provided by N. Galjart (Erasmus University Medical Center, the Netherlands) and A. Melnick (Weill Cornell Medicine)53. All compound mouse strains used in this work were from in-house breeding at the animal care facilities of University of Iowa and Center for Discovery and Innovation, Hackensack University Medical Center. The mice were housed at 18-23 °C with 40-60% humidity, with 12-h light/12-h dark cycles. All mice, if not specifically mentioned in this manuscript, were 6-12 weeks of age, and both sexes were used without randomization or blinding. All mouse experiments were performed under protocols approved by the Institutional Animal Use and Care Committees of the University of Iowa and Center for Discovery and Innovation, Hackensack University Medical Center.
Flow cytometry.
Single-cell suspensions were prepared from the spleen, lymph nodes (LNs), and surface or intracellularly stained as described54. The fluorochrome-conjugated antibodies were as follows: anti-CD4 (RM4-5), anti-CD8 (53-6.7), anti-TCRβ (H57-597), anti-CD45.1 (A20), anti-CD45.2 (104), anti-CD62L (MEL-14), anti-IL-2Rβ (TM-β1), anti-IL-7Rα (A7R34), anti-Eomes (Dan11mag), anti-CD25 (PC61.5), anti-CD69 (H1.2F3), anti-ICOS (C398.4A), and anti-CD44 (IM7) were from Thermo Fisher Scientific; anti-γc (TUGm2) and anti-PD1 (RMP1-30) from BioLegend; anti-Tcf1 (C63D9) and anti-Lef1 (C12A5) from Cell Signaling Technology. For detection of Tcf1 and Lef1 proteins, surface-stained cells were fixed and permeabilized with the Foxp3/Transcription Factor Staining Buffer Set (eBiosciences), followed by incubation with corresponding fluorochrome-conjugated antibodies. For detection of cell survival status, the PE Annexin V Apoptosis Detection Kit (BD Biosciences) was used following the manufacturer’s instruction. Data were collected on FACSCelesta or FACSVerse (BD Biosciences) and were analyzed with FlowJo software V10.2 (TreeStar).
Cell labeling, ex vivo culture, and adoptive transfer.
For in vivo analyses, WT, Tcf1+Lef1 dKO, or Ctcf−/− naïve CD8+ T cells were enriched from spleen and lymph nodes by negative selection via depleting cells expressing CD4, B220, TER119, NK1.1, Gr1, CD11b, CD11c and CD44 using EasySep Biotin Positive Selection Kit II (StemCell Technology). The enriched cells were labeled with 10 μM Cell Trace Violet (CTV, Invitrogen/Life Sciences), 1×10⁶ of CTV-labeled CD45.2+CD8+ cells were adoptively transferred into either lymphopenic hosts (i.e., sublethally irradiated CD45.1+ B6.SJL or Rag1−/− mice) via tail vein injection. After 72 hrs, CTV dilution was detected on CD45.2+GFP+CD8+ cells. In another experiment, the enriched naïve CD45.2+GFP+CD8+ T cells were mixed at 1:1 ratio with CD45.1+ WT CD8+ competitor cells followed by adoptive transfer into CD45.2+ B6.SJL replete hosts, and persistence of both donor cell types were tracked for 3 weeks.
For ex vivo analysis, the enriched CD8+ cells were cultured in RPMI 1640 medium supplemented with 10% FBS, 2 mM L-glutamine, 100 U/ml penicillin-streptomycin, 1 mM HEPES, 1 mM sodium pyruvate, 50 μM β-mercaptoethanol, and stimulated with IL-7 and IL-15 (both at 50 ng/ml) for 72 hrs. The stimulated cells were sorted for viable cells with naïve phenotype (CD44med-loCD62L+) and used in multiomics analyses. For tracking cell division in vitro, the enriched cells were CTV-labeled and stimulated with IL-7+IL-15 or plate-bound anti-CD3 (10 μg/ml) + soluble anti-CD28 (1 μg/ml) + IL-2 (100 units/ml) for 72-96 hrs, and CTV dilution was tracked.
Immunoblotting and Immunoprecipitation.
To detect intracellular signals activated by homeostatic cytokines, sorted naïve CD8 T cells were incubated with IL-7 and IL-15 (each at 50 ng/ml) for 0, 5, 15, 30, 60 and 180 minutes. The stimulation was stopped by addition of lysis buffer, and cell lysates were extracted and immunoblotted with the following antibodies: anti-pY694-STAT5a (clone: C11C5, Cell Signaling Technology), pS473-Akt (clone: 193H12, Cell Signaling Technology), total Stat5a (clone ST5a-2H2, ThermoFisher Scientific), and total Akt (C67E7, Cell Signaling Technology).
For detection of Tcf1 and CTCF protein-protein interaction in primary CD8+ T cells, splenocytes from wild-type C57BL/6 mice were labeled with PE anti-mouse CD8a followed by positive selection with anti-PE nanobeads. The cell lysates were first incubated with ethidium bromide (EtBr, Bio-Rad Laboratories) at 100 μg/ml at 4°C for 30 min, followed by incubation with 2 μg of anti-Tcf1 rabbit polyclonal antibody (#14464-1-AP, ProteinTech), 3 μl of anti-CTCF rabbit polyclonal antibody (#07-729, MilliporeSigma), or corresponding amount of IgG overnight at 4 °C in the presence of EtBr with constant rotation. Dynabeads Protein G (Invitrogen/ThermoFisher Scientific, 30 μl) were then added for an additional 2-hr incubation. The protein-bound beads were washed three times (10 min/each) with 1 ml of IP buffer (50 mM Tris-HCl pH 8.0, 1 mM EGTA, 1 mM EDTA, 150 mM NaCl, 1% Triton X-100, and 0.5% NP-40) at room temperature. The resulting samples were resolved on a 4-12% Bis-Tris NuPAGE gel, and then immunoblotted with anti-CTCF (JM10-61, Invitrogen/ThermoFisher Scientific) or anti-Tcf1 antibodies (C63D9, Cell Signaling Technology).
Mig-R1 retroviral vector expressing FLAG-tagged full-length Tcf1 and its various mutant forms were previously described9. The cDNA coding full-length CTCF was obtained from Addgene (#40801) and subcloned into Mig-R1 plasmid with an HA-tag added to the N-terminus of CTCF. Various mutant forms of CTCF were generated by Q5 Site-Directed Mutagenesis Kit from New England Biolabs (#E0554S). To map Tcf1 and CTCF interaction surface, the expression plasmids were co-transfected into 293T cells using Lipofectamine 2000 (Invitrogen/ThermoFisher Scientific). After 24 hrs, cell lysates were preincubated with EtBr and then with anti-FLAG M2 Magnetic Beads (MilliporeSigma), anti-FLAG antibody (clone M2, #F3165, MilliporeSigma) or IgG overnight at 4°C in the presence of EtBr, followed by 2-hr incubation with Dynabeads Protein G. The immunoprecipitated samples were immunoblotted with anti-HA (C29F4, Cell Signaling Technology).
RNA-seq and data analysis
Data generation.
For ex vivo cytokine-stimulated groups, WT or Tcf1+Lef1 dKO CD8+ T cells were first enriched by negative selection, cultured in the presence of IL-7 and IL-15 (each at 50 ng/ml) for 72 hrs, and then GFP+CD8+ T cells in CD44med-loCD62L+ naïve phenotype were sorted. This protocol was adopted to avoid diminished viability and/or reduced responsiveness to cytokines after cell sorting. For cells that have undergone in vivo homeostatic proliferation (i.e., in vivo HP groups), naïve CD8+ T cells from WT or Tcf1+Lef1 dKO, or Ctcf−/− splenocytes were enriched by depleting non-T lineage cells, CD4+ T cells and CD44high cells, and then labeled with CTV followed by adoptive transfer into Rag1−/− recipients. Seventy-two hours later, CTV+TCRβ+GFP+CD8+ T cells were sort-purified. Total RNA was extracted from the sorted cells (three biological replicates for each group), cDNA synthesis and amplification were performed using SMARTer Ultra Low Input RNA Kit (Clontech) following manufacturer’s instruction. The resulting libraries were sequenced on Illumina’s HiSeq2000 in single-end mode with the read length of 50 or paired-end mode with read length of 150 nucleotides. The RNA-seq data for the ex vivo stimulated and in vivo HP groups were deposited at the GEO (GSE179725 and GSE198264, respectively) under the SuperSeries of GSE179775. The RNA-seq data for the naïve CD8+ T cells were previously reported20 and deposited at the GEO (GSE164712) under the SuperSeries of GSE164713.
Reproducibility analysis and dynamic transcriptome clustering.
The sequencing quality of RNA-seq libraries were assessed by FastQC (v0.11.4), and adaptors were removed through Cutadapt. The reads were mapped to mouse genome mm9 using Tophat (v2.1.0)55. The expression level of a gene was expressed as a gene-level Fragments Per Kilobase of transcripts per Million mapped reads (FPKM) value. Mapped reads were then processed by Cuffdiff (v2.2.1)56 to estimate expression levels of all genes and identify differentially expressed genes (DEGs) between a pair of conditions. The reproducibility of RNA-seq data was evaluated by applying the Principal Component Analysis (PCA) for all genes. Pairwise DEGs in CD8+ T cells were identified by requiring ≥ 2-fold expression changes and FDR<0.05, as well as FPKM ≥ 1 in the higher expression samples. DEGs from 4 key comparisons (defined in Extended Data Fig. 3b) were collected for analysis of dynamic transcriptomic changes. By applying K-means clustering to the row-wise z-score-transformed expression values of these genes, we obtained 7 gene clusters for ex vivo stimulated groups (Fig. 2a) and 4 gene clusters with in vivo HP groups (Fig. 8f), each with distinct dynamic patterns of expression. UCSC genes from the iGenome mouse mm9 assembly (http://support.illumina.com/sequencing/sequencing_software/igenome.html) were used for gene annotation.
DNase-seq and data analyses
Data generation.
DNase-seq was performed following detailed protocols described previously57. In brief, WT or dKO CD8+ T cells were stimulated with IL-7+IL-15 ex vivo for 72 hrs, and then sorted in 2 biological replicates each (3×10⁵ cells/replicate). The cells were lysed in lysis buffer (10 mM Tris-HCl pH 7.5, 10 mM NaCl, and 3 mM MgCl2) and digested with 2.4 units of DNase I at 37°C for 5 min. The reaction was terminated by addition of stop buffer (10 mM Tris-HCl pH7.5, 10 mM NaCl, 10 mM EDTA, 2% SDS, 0.5 mg/ml Proteinase K, and 1 ng/ml of circular carrier DNA), and incubated at 65°C for 1 hr. After purification with phenol-chloroform extraction and ethanol precipitation, the DNA was end-repaired using End-It DNA-Repair kit (Epicentre) at 37°C for 20 min, and then treated with Klenow fragment (3’->5’ exo-, NEB) and dATP to yield a protruding A base at the 3’ end. The DNA fragments were then ligated to the Illumina Paired End Adaptors, and amplified with PCR for library construction. PCR products between 160-300 bp were isolated on 2% E-gel for sequencing on Illumina HiSeq2000 in paired-end mode with the read length of 150 nucleotides. The DNase-seq data for stimulated cells were deposited at the GEO (GSE179724) under the SuperSeries of GSE179775. The DNase-seq data for naïve WT and dKO cells were previously reported20, and deposited the GEO (GSE164689) under the SuperSeries of GSE164713.
Data processing.
The sequencing quality of DNase-seq libraries was assessed by FastQC v0.11.4 (http://www.bioinformatics.babraham.ac.uk/projects/fastqc/). Bowtie2 v2.2.558 was used to align the sequencing reads to the mm9 mouse genome, and only uniquely mapped reads (MAPQ>10) were retained. Samtools 1.759 was used to transfer sam files to bam files and sort bam files. Picard MarkDuplicates 2.21.6-SNAPSHOT (https://github.com/broadinstitute/picard) was used to remove duplicate reads in bam files. MACS v2.1.160 was used for DNase I-hypersensitive site (DHS) peak calling with stringent criteria of ≥ 4 summit fold change and FDR<0.05. For DHS peaks in a given condition, the mapped reads from replicates were pooled for peak calling. For consistency, the DHS peaks are referred to as chromatin accessible (ChrAcc) sites in this work.
Reproducibility analysis.
Peaks called by MACS2 in 9 libraries (i.e., 3 naïve WT, 2 naïve dKO, 2 IL-7+IL-15-stimulated WT and 2 IL-7+IL-15-stimulated dKO libraries) were merged into 44,682 union peaks. Raw reads were counted in each library on the union peaks resulting in a 44,682 × 9 matrices with rows representing peaks and columns represents libraries. The raw-count matrices were then subjected to row-wise normalization by peak length per kilobase and then column-wise normalization by the column sum per million. The normalized matrices were subjected to PCA analysis with the z-score option.
Identification of differential ChrAcc sites.
The 44,682 × 9 raw count matrices were used as input for edgeR (v.3.28.1)61 (quasi-likelihood test, robust, fold-change>=2 and FDR<0.05) to identify differential ChrAcc sites between a pair of comparisons. To analyze ChrAcc dynamics, we focused on 5,202 differential ChrAcc sites from 4 key comparisons (Extended Data Fig. 3b), and the corresponding 5,202 rows were extracted from the normalized 44,682 × 9 matrices and subjected to row-wise z-score transformation. K-means clustering was then applied to separate these differential peaks into 6 clusters with distinct ChrAcc dynamics (Extended Data Fig. 3f).
Identification of regulatory factor motifs from ChrAcc data.
ChromVAR (R package version 1.8.0)25 was applied to the 44,682 × 9 matrices of merged ChrAcc sites with the default parameters and the motif database “mouse_pwms_v1”. Variability of ChrAcc signal intensity across the 4 conditions for each motif was calculated by chromVAR to identify regulatory factors that correlated with ChrAcc changes.
Correlation matrices for association of DEG and dynamic ChrAcc clusters.
An observed count matrices were first calculated, with the matrix elements representing the observed number of genes in the jth DEG cluster that was associated with the ith cluster of the dynamic ChrAcc cluster, where a ChrAcc site localized in a gene body and its 50 kb flanking regions was considered to be associated with the gene. The element of the enrichment score matrices were then defined as the observed count divided by the expected count , which was calculated as , where and .
CTCF CUT&RUN and data analyses
Data generation.
Cleavage Under Targets and Release Using Nuclease (CUT&RUN)30 was used to globally map CTCF binding sites in CD8+ T cells before and after ex vivo IL-7+IL-15 stimulation for 72 hrs. In brief, FACS-sorted live cells (1×10⁵ cells/reaction) were bound to Concanavalin A-coated magnetic beads (Bangs Laboratories), and permeabilized with 0.05% (w/v) digitonin, and then incubated with anti-CTCF antiserum (Active Motif, 1 μl/reaction) or IgG overnight. After removal of unbounded antibodies with proper washing, the nuclei were incubated with protein A/G-micrococcal nuclease (MNase) fusion protein (plasmid obtained from Addgene) for one hour at 4°C. CaCl2 was then added to activate MNase activity and incubated on ice for 30 min. The reaction was quenched with stopping buffer, and the DNA fragments were purified with MinElute Reaction Cleanup Kit (Qiagen), and then amplified by PCR for 10-14 cycles with barcoded Nextera primers (Illumina). DNA fragments in the range of 150-1,000 bp were recovered from 2% E-Gel EX Agarose Gels (Invitrogen/ThermoFisher Scientific). The libraries were quantified using a KAPA Library Quantification kit and sequenced on Illumina HiSeq X Five/Ten sequencing systems in paired end 150 bp reads at the Admera Health. The CTCF CUT&RUN data were deposited at the GEO (GSE179723) under the SuperSeries of GSE179775.
Data processing.
The sequencing quality of the libraries was assessed by FastQC v0.11.9 (http://www.bioinformatics.babraham.ac.uk/projects/fastqc/). Trim Galore 0.6.4_dev (https://www.bioinformatics.babraham.ac.uk/projects/trim_galore/) was used to remove 25bp from the 3’ end as well as adapter sequences. Bowtie2 v2.2.558 was used to align the sequencing reads to the mm9 mouse genome, and only uniquely mapped reads (MAPQ>10) were retained. Samtools 1.759 was used to transfer the sam files to bam files and sort bam files. Picard MarkDuplicates 2.21.6-SNAPSHOT (https://github.com/broadinstitute/picard) was used to remove duplicate reads in the bam files. MACS v2.1.160 was used for CTCF peak calling, with the IgG CUT&RUN library in the naïve CD8+ T cells used a negative control, where stringent criteria of ≥ 4 summit fold change, and FDR<0.05 were used. CTCF binding events in a cell type/state were called by applying MACS2 to reads from biological replicates pooled together.
Reproducibility analysis.
Significant peaks called by MACS2 from the 8 CTCF CUT&RUN libraries of four cell types/states were merged into 39,574 union peaks. Raw counts in each library were mapped onto those union peaks, resulting in a 39,574 × 8 matrices with rows representing the peaks and columns representing the libraries. The raw-count matrices were then subjected to normalization as follows: each row, representing a peak region, was normalized by length of each peak region per kilobase and each column, representing a library, was then normalized by the column sum per million. The normalized matrices were subjected to PCA analysis with the z-score option.
Identification of dynamic CTCF clusters.
The 39,574 × 8 raw-count matrices were used as input for edgeR (v.3.28.1)61 (quasi-likelihood test, robust, fold-change >= 2 and FDR < 0.05) to identify differential CTCF binding sites between a pair of conditions. To analyze the dynamic changes in CTCF binding strength in four cell types/states, we collected the 6,876 differential CTCF peaks from the four key comparisons as defined in Extended Data Fig. 3b, and the corresponding 6,876 rows were extracted from the normalized 39,574 × 8 matrices and subjected to row-wise z-score transformation. K-means clustering was then applied to separate these differential CTCF peaks into 7 clusters with distinct CTCF binding dynamics (Fig. 2f).
Correlation matrix for association of DEG and dynamic CTCF clusters was generated following the same approach as described for dynamic ChrAcc clusters.
Defining local chromatin characteristics at CTCF and Tcf1 binding sites.
The presence or absence of CTCF motif in CTCF or Tcf1 binding peaks was determined by motifmatchr (R package version 1.12.0) using the chromVar motif database “mouse_pwms_v1”. The Motif+Tcf1−CTCF+ and Motif−Tcf1−CTCF+ sites were ordered by CTCF binding intensity, while Motif+Tcf1+CTCF+ and Motif−Tcf1+CTCF+ sites were ordered by Tcf1 binding intensity. The CTCF, ChrAcc and H3K27ac profiles at distal sites were normalized by the number of reads on the peaks per million reads in each type of libraries. The H3K27ac ChIP-seq data were previously reported20 and deposited at the GEO (GSE164711) under the SuperSeries of GSE164713. Mapped reads from replicates were pooled for identification of ChIP-enriched regions in a condition using SICER (v1.1)62 with the setting of windows size = 200 bps, gap size = 400 bps and FDR < 0.01.
Tcf1 and CTCF ChIP-seq and data analysis.
The high confidence Tcf1 binding peaks from Tcf1 ChIP-seq in naïve CD8+ T cells were obtained from GSE164713 (Ref.20). For CTCF ChIP-seq, splenic naïve CD8+ T cells were sort-purified from wild-type and dKO mice, and the cells were incubated with 2 mM disuccinimidyl glutarate (Millipore Sigma) for 45 min at room temperature and then cross-linked with 1% formaldehyde for 10 min at room temperature. The chromatin was extracted and sonicated with a Q125 sonicator equipped with an 1/8-inch diameter probe (Qsonica) at 20% input amplitude, at a 20-second duration for eight times. The resulting chromatin fragments were immunoprecipitated with anti-CTCF antibodies, including anti-CTCF rabbit polyclonal antibody from Millipore Sigma (#07-729, with human CTCF 659-675 peptides as immunogen), anti-CTCF rabbit monoclonal antibody from Cell Signaling Technology (D31H2, with a synthetic peptide from human CTCF as immunogen, precise location undisclosed), anti-CTCF mouse monoclonal polyclonal antibody form Santa Cruz Biotechnology (#sc-271514, clone B-5, with human CTCF 643-687 peptides as immunogen), or IgG control, and then properly washed. The genomic DNA fragments were extracted with MinElute Reaction Cleanup Kit (Qiagen), and library constructed following standard protocols20. The libraries were sequenced on Illumina HiSeq X Five/Ten sequencing systems in paired end 150 bp reads at the Admera Health. The CTCF ChIP-seq data were deposited under GSE192758 in the SuperSeries of GSE179775.
CTCF ChIP-seq data were processed, and peaks called following the same procedures as described above for CTCF CUT&RUN data. CTCF binding events in a cell type/state were called by applying MACS2 to reads from biological replicates pooled together (MACS2, summit fold change ≥4 and FDR<0.05). For identification of differential CTCF binding sites between WT and dKO naïve CD8+ T cells, CTCF ChIP-seq data obtained with the clone B-5 CTCF antibody (Santa Cruz Biotechnology) in 4 replicates for each genotype were used. In CTCF CUT&RUN data, the signal-to-noise ratios, as determined as read count on CTCF peaks divided by read count on non-peak regions, were 0.72 for WT and 0.75 for dKO CD8+ T cells; in contrast, in CTCF ChIP-seq data obtained with the B-5 antibody (Santa Cruz Biotechnology), the ratios were 0.22 for WT and 0.26 for dKO CD8+ T cells (Extended Data Fig. 4e). To address the lower signal-to-noise ratio in ChIP-seq data, as visually evident in Fig. 4h and Extended Data Fig. 8d, we adopted the following approach: the CTCF peaks were first called under the criteria of summit fold changes≥2 and FDR<0.05 using MACS2, and the resulting 59,122 CTCF peaks from 8 libraries (59,122 × 8 raw-count matrices) were used as input for edgeR (v.3.28.1)61 to determine differential CTCF binding between the two cell types, with the criteria of (quasi-likelihood test, robust, fold-change≥1.5 and FDR<0.01).
Analysis of ChIP-seq datasets in public domain
The raw fastq files of CTCF and Rad21 ChIP-seq data in total T cells, and CTCF ChIP-seq data in resting B cells were downloaded from GEO (GSM2635596, GSM2635601 , and GSM2635594 respectively under SuperSeries GSE99197)32. These data were processed, and peaks called following the same procedures as described above. CTCF and other transcription factor ChIP-seq peaks in GM12878 lymphoblastoid cells and K562 myelogenous leukemia cells were retrieved from the ENCODE project, where the peaks were processed with the Irreproducibility Discovery Rate (IDR) framework.
EBF1 ChIP-seq peaks and DNase-seq peaks in total B cells were downloaded from the Cistrome Data Browser (http://cistrome.org/db/#/) under ID 71163 and ID 45090, respectively; Gata3 ChIP-seq peaks in naïve CD8+ T cells (ID 3284), CTCF ChIP-seq and DNase-seq peaks in Th2 cells (ID 88187 and ID 92251, respectively) were all from the Cistrome Data Browser. All the Cistrome data were transferred from mm10 to mm9 by the LiftOver tool (https://genome.ucsc.edu/cgi-bin/hgLiftOver) so as to determine overlap rate with Tcf1 and CTCF ChIP-seq, CTCF CUT&RUN, and DNase-seq peaks generated in this work. For human ESC datasets, CTCF ChIP-seq peaks were retrieved from the ENCODE project (accession number ENCFF023LAA), CTCF CUT&RUN peaks were from the 4D Nucleome Data Portal (accession number 4DNFI6OF4ZMC), and CTCF ChIA-PET data were from the ENCODE project (accession number ENCFF401IWZ).
Visualization of sequencing tracks and heatmap
We adopted the following normalization method to enable quantitative comparison of signal levels among different cell types/states. For the sequencing tracks of DNase-seq, CTCF CUT&RUN, H3K27ac ChIP-seq and CTCF ChIP-seq in mouse CD8+ T cells, raw-count BigWig files were normalized separately in each molecular feature by the total number of reads on peaks (called by merged bam files in each condition with MACS2 threshold and controls as before) per million. For IgG CUT&RUN, IgG ChIP-seq, CTCF ChIP-seq tracks in naïve CD8+ and total T and B cells, raw-count BigWig files were normalized by total reads in each library per million. BigWig files used in the heatmaps (Fig. 3h, 4e, Extended Data Fig. 7f, 8c) were rescaled to facilitate visualization of different molecular features. The scaling factors were 1.5× for CTCF ChIP-seq, 2× for DNase-seq, and 5× for H3K27ac ChIP-seq normalized BigWig files.
High-resolution chromosome-conformation-capture (Hi-C) and data analyses
Hi-C data generation.
Hi-C was performed using the three enzyme Hi-C (3e Hi-C) approach as previously described37. In brief, WT and dKO CD8+ T cells that were stimulated with IL-7+IL-15 for 72 hrs (each in two replicates, 4×10⁶ cells/replicate) were sorted and cross-linked with 1% formaldehyde for 10 minutes at 25°C. The crosslinked cells were lysed in 10 ml lysis buffer (10 mM Tris-HCl pH 8.0, 10 mM NaCl, 0.2% NP-40) supplemented with protease inhibitor cocktail (Millipore/Sigma) at 4°C for 1 hr. The nuclei were collected and treated with 400 μl 1×CutSmart buffer (NEB) containing 0.1% SDS at 65°C for 10 minutes, and Triton X-100 was added to a final concentration of 1% to quench SDS. The resulting chromatin was then digested with three restriction enzymes, CviQ I, CviA II, and Bfa I (NEB), at 20 units each at 37°C for 20 minutes. The reaction was stopped by washing with 600 μl wash buffer (10 mM NaCl, 1 mM EDTA, 0.1% Triton X-100) two times. The DNA ends were blunted and labeled with biotin by Klenow enzyme in the presence of dCTP, dGTP, dTTP, biotin-14-dATP, followed by ligation using T4 DNA ligase. After reverse crosslinking, DNA was fragmented by sonication with a Covaris S2 ultrasonicator. The DNA fragments were then end-repaired, and the biotinylated DNA fragments were captured using Dynabeads MyOne Streptavidin C1 beads (Invitrogen, Thermo Fisher Scientific). The DNA on beads was ligated to the Illumina Paired End Adaptors, and amplified with PCR for library construction. DNA fragments of 300-700 bp were purified from 2% E-gel and sequenced on HiSeq4000 in paired read mode with the read length of 150 nucleotides. The Hi-C data for WT and dKO CD8+ T cells in naïve state were previously reported20 and deposited at the GEO (GSE164710) under the SuperSeries of GSE164713. The Hi-C data for stimulated WT and dKO CD8+ T cells were deposited at the GEO (GSE179773) under the SuperSeries of GSE179775.
Hi-C library mapping.
Iterative_mapping from 25 bps to 105 bps with a step size of 5 bps using hiclib (https://github.com/mirnylab/hiclib-legacy) was applied to the Hi-C sequencing libraries for alignment onto reference genome mm9. Picard (http://broadinstitute.github.io/picard/) was then applied for redundancy removal. The resulting libraries were subjected to further processing using Mirnylib with default parameters except filterDuplicates (mode=‘ram’) (https://github.com/mirnylab/hiclib-legacy) into hdf5 file. The hdf5 files were converted into text files and then .hic files using the Juicer63 pre function. The .hic file is a highly compressed binary file that provides rapid random access to the binned matrices at 9 resolutions: 2.5 m, 1m, 500 k, 250 k, 100 k, 50 k, 25 k, 10 k, and 5 k base pairs.
Reproducibility of Hi-C replicates.
The binned contact matrices were converted into a text file using the straw function in Juicer v1.21.0163 with parameters (observed; delimited: base-pair; resolution:10kb; normalization: distance normalization, see below). For each anchor and each replicate, the respective row sum of the contact matrix elements (excluding the diagonal element) was calculated. Scatterplots of the resulting data were used to calculate the Pearson correlation of the replicates.
Identification of topological associated domains (TADs).
TADs were identified by the Arrowhead algorithm from Juicer v1.21.0163 using the medium resolution maps (i.e., m: 2000; resolution: 10kb; normalization: KR). A total of 1,724 TADs were identified in naïve WT CD8+ T cells using the pooled Hi-C data. Relative distribution of Tcf1+CTCF+ sites and Tcf1−CTCF sites were then determined within the TADs.
Distance normalization of the contact matrices.
The raw-count contact matrices were subjected to distance normalization64 as follows. For a matrix element with , we counted the number of elements with the same distance in the same chromosome . The average interaction of distance on the same chromosome was . The normalized matrix element was defined as . The distance normalized contact matrices were used for the downstream analysis and visualization unless specified otherwise.
Calculation of insulation index.
We calculated the insulation score using the matrix2insulation script65. To make the result more intuitive, we defined an insulation index as (-insulation score +1), where higher insulation index corresponded to higher insulation effects.
Calculation of chromatin interaction score of an anchor.
For an anchor, the sum of its distance-normalized interaction strength with other bins on the same chromosome up to 500 kb was defined as the chromatin interaction score. In Fig. 6a where four cell types were compared in separate CTCF clusters, the mean interaction score of 1,000 randomly selected CTCF peaks in each cell type was first determined as a normalization factor for that cell type, and the interaction score of one cell type in a given cluster was divided by the corresponding normalization factor and then z-score transformed for comparison across cell types.
HiCHub, a network approach for comparing chromatin interactions between two cell types/states.
We devised a network approach to systematically compare chromatin interaction differences between two cell types (experimental conditions)20, 45. In brief, key considerations in the 4 main steps of the pipeline include: 1) Normalization. To enable fair comparison, the two raw contact matrices were normalized based on the assumption that the majority of interactions at any genomic distance are unchanged. 2) Network construction and clustering. Differential interactions of a given direction were identified from the comparison of the normalized matrices and used to construct a network using the igraph platform. Clusters on the network were identified using the community_multilevel algorithm66. 3) Projection to genome. For each network cluster, its nodes were projected onto the genome and coalesced according to genomic proximity. The resulting stitched regions became putative anchor regions of candidate hubs. 4) Significance evaluation. A candidate hub was identified as the collection of contacts between two putative anchor regions (including self) associated with the same network cluster. One-sided Wilcoxon signed rank test was used to evaluate the significance of whether the interactions in the candidate hub collectively changed in the desired direction. Candidate hubs with p-value < 1e-5 was considered as cell type-specific hubs.
The promoters of DEGs from the two cell types were then stratified against cell type-specific hubs to identify genes whose expression was evidently modulated by changes in chromatin interaction network. For visualization of a hub in an interaction network, the grey lines were used to represent the changed chromatin interactions between two conditions where the change direction is consistent with the hub designation, and the nodes represented 10-kb bins belonging to the network community underlying the hub.
To measure the enrichment of cell type-specific CTCF binding peaks in the corresponding cell type-specific chromatin interaction hubs, the former was first identified by comparing CTCF binding strength between the two cell types using edgeR. The expected CTCF peak numbers were calculated by multiplying the total numbers of cell type-specific peaks with the ratio of total length of cell type-specific hubs to genome length. The enrichment score was calculated as the ratio of the observed to expected cell type-specific CTCF peaks on cell type-specific interaction hubs.
Statistical analysis.
For comparison between two experimental groups, Student’s t-test was used. For multiple group comparisons, one-way ANOVA was used to first determine whether any of the differences between the means are statistically significant. As post hoc correction, Tukey’s test was used to determine statistically significance between two groups of interest using Prism V8.0. The statistical significance for the multiomics analyses was determined using the processing algorithms. Specifically, Cuffdiff was used for RNA-seq, MACS2 for DNase-seq, CTCF CUT&RUN and CTCF ChIP-seq, and SICER for H3K27ac ChIP-seq. The statistical significance of differential hubs was determined using HicHub, and that associated with gene pathway and ontology analysis was determined by GSEA, DAVID and GREAT, and that for motif analysis was determined by HOMER. For comparisons between two sets of data points in boxplots, one-sided Mann-Whitney U test was used. For enrichment analysis, one-sided binomial test was used.
Extended Data
Extended Data Fig. 1. Tcf1+Lef1-deficient CD8+ T cells remain in naïve state and are not prone to apoptosis.
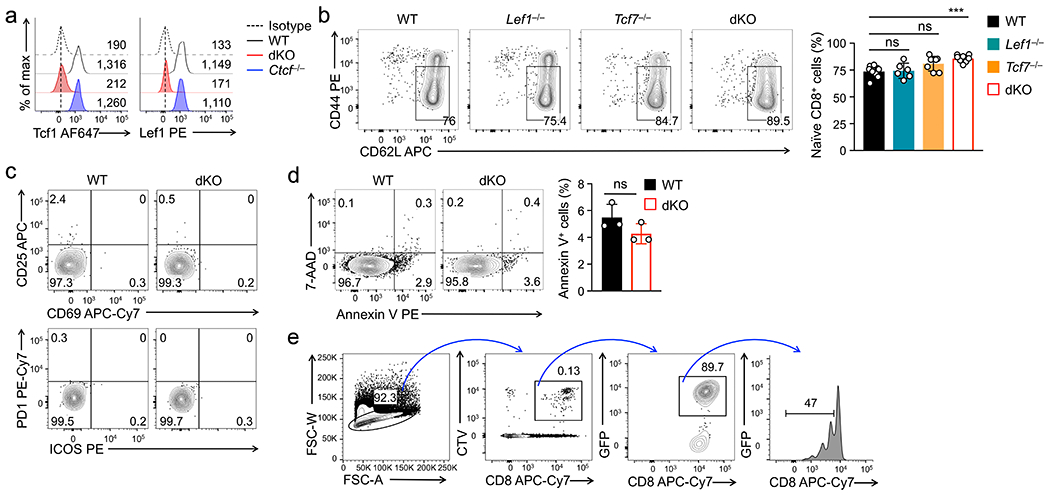
a. Detection of Tcf1 and Lef1 expression in splenic naïve CD8+ T cells from WT, dKO and Ctcf−/− mice by intranuclear staining. Values denote geometric mean fluorescent intensity (gMFI). Data are representative from ≥2 experiments. b. Detection of CD44loCD62L+ naïve TCRβ+GFP+CD8+ T cells in splenocytes from mice of indicated genotypes, with cumulative data (right) as means ± s.d. from 3-4 independent experiments. ***, p<0.001; ns, not statistically significant by one-way ANOVA coupled with Tukey’s correction. c. Detection of activation markers including CD25, CD69, PD1 and ICOS in the naïve cells from WT and dKO mice. Data are representative from 2 experiments. d. Detection of cell apoptosis in splenic TCRβ+GFP+CD8+ T cells in 22–27 weeks old WT and dKO mice by staining for Annexin V and 7-AAD positivity. Representative contour plots (left) are from two independent experiments, and cumulative data on frequency of Annexin V+ cells are means ± s.d. ns, not statistically significant by two-tailed Student’s t-test. e. Gating strategy for detecting CTV-labeled GFP+CD8+ T cells that underwent homeostatic proliferation in vivo after transfer into lymphopenic or replete hosts, or ex vivo after IL-7+IL-15 or TCR stimulation. This strategy was applied to Fig. 1b–g, 8a–8c, Extended Data Fig. 2a,b, 10a,b, and to cell sorting for all multiomics analyses in this work.
Extended Data Fig. 2. Tcf1 and Lef1 deficiency does not affect T cell proliferation and signaling in general.
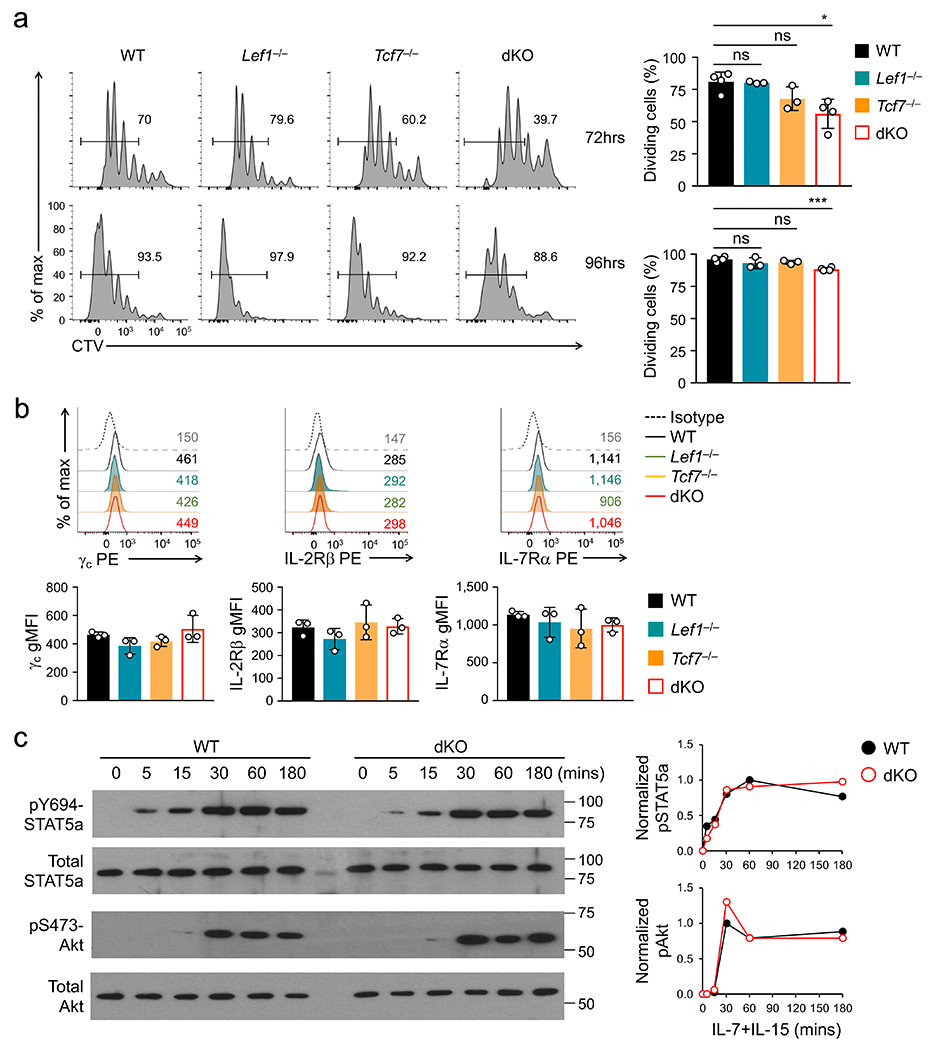
a. Cell division of CTV-labeled naïve CD45.2+GFP+CD8+ T cells at 72 (top) or 96 hrs (bottom) after ex vivo stimulation with plate-bound anti-CD3 in the presence of soluble anti-CD28 and IL-2, with frequency of cells showing ≥1 division summarized (right). Representative histographs are from 3 experiments (left), and cumulative data are means ± s.d. *, p<0.05; ***, p<0.001; ns, not statistically significant by one-way ANOVA coupled with Tukey’s correction. b. Detection of indicated cytokine receptor expression on GFP+CD8+ T cells. Representative half-stacked histographs are from 3 experiments (top), with values denoting gMFI. Cumulative data on gMFI (bottom) are means ± s.d, with no statistically significant differences observed and thus unmarked. c. Detection of Stat5a and Akt phosphorylation in WT and dKO GFP+CD8+ T cells in response to IL-7 and IL-15 stimulation for 0-180 minutes by immunoblotting with indicated antibodies. Gel images are representative from two independent experiments. The signal strength of pY694-Stat5a and pS473-Akt was normalized to respective total protein, and their time-dependent changes were plotted in the right panels. Note that the pY694-Stat5a antibody also detects Tyr699-phosphorylated Stat5b.
Extended Data Fig. 3. WT and Tcf1+Lef1-deficient CD8+ T cells show dynamic and largely concordant changes in transcriptomic and chromatin accessibility in response to IL-7/15 stimulation.
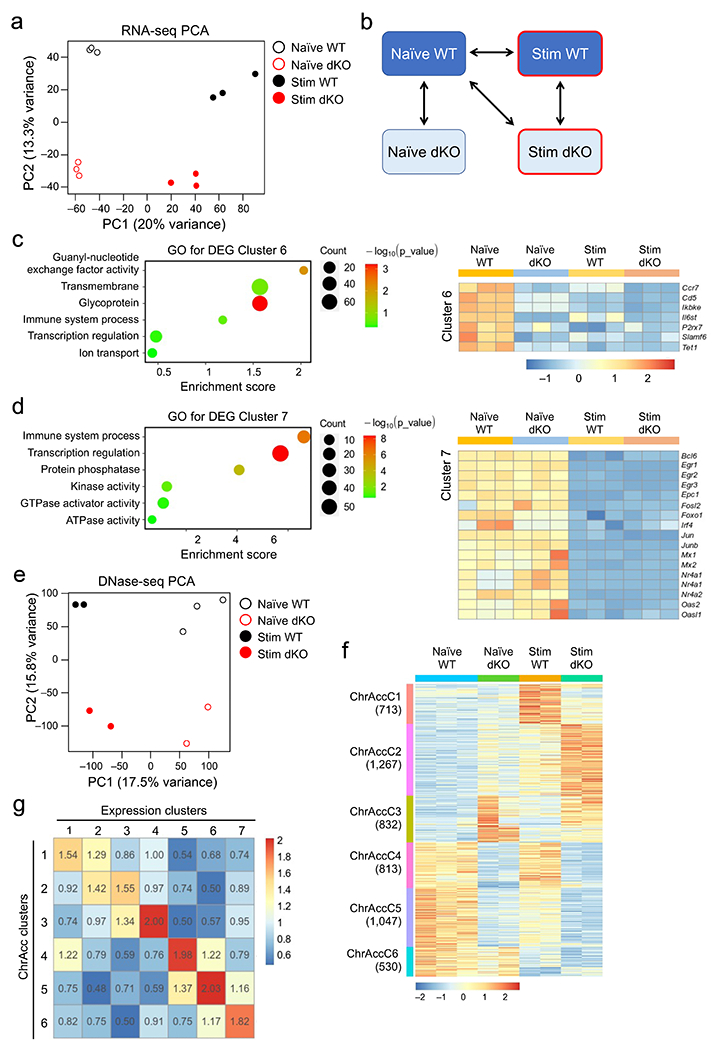
a. Principal component analysis (PCA) of RNA-seq libraries from WT or dKO GFP+CD8+ T cells before and after 72-hr ex vivo stimulation with IL-7 and IL-15. b. Diagram showing key pair-wise comparisons to define the dynamic transcriptomic and chromatin accessibility changes in this work. c–d. Gene ontology analysis of IL-7+IL-15-repressed genes in ExpC6 (c) and ExpC7 (d), as determined with the DAVID Bioinformatics Resources. Dot size denotes gene counts, and dot color denotes statistical significance. Selected IL-7+IL-15-repressed genes are shown in heatmaps (right panels). e. PCA of DNase-seq libraries from WT or dKO GFP+CD8+ T cells before and after 72-hr ex vivo stimulation with IL-7 and IL-15. f. Differential ChrAcc clusters as determined with DNase-seq, based on the key comparisons in b. Values in parentheses denote site numbers in each cluster. g. Correlation between transcriptomic and ChrAcc changes. Genes in expression clusters (defined in Fig. 2a) were stratified against genes linked to Diff. ChrAcc clusters (f), and the number of overlapping genes was counted. The value of each element in the correlation matrix is the ratio of the observed over expected overlapping gene counts, and all elements are color-coded based on the enrichment values. Color scale in c and d denotes relative gene expression, and that in f denotes relative strength of ChrAcc signals.
Extended Data Fig. 4. Dynamic CTCF binding shows concordant changes with gene expression in IL-7+IL-15-stimulated CD8+ T cells.
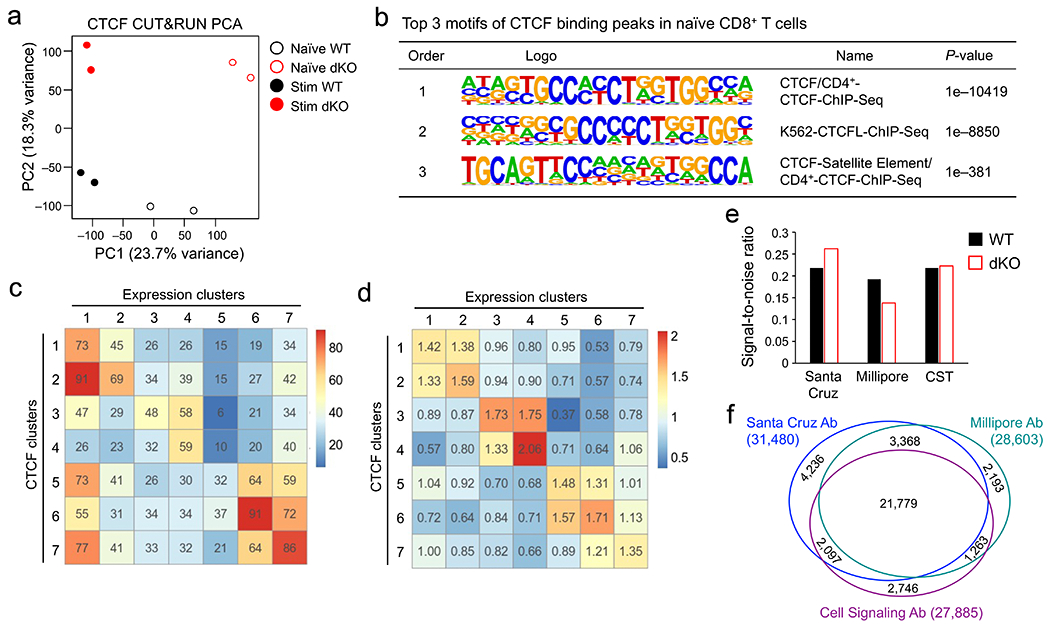
a. PCA of CTCF CUT&RUN libraries from WT or dKO GFP+CD8+ T cells before and after 72-hr ex vivo stimulation with IL-7 and IL-15. b. Top motifs of CTCF binding peaks in naïve WT CD8+ T cells as determined with HOMER, with motif logos and statistical significance listed. Note that similar results were obtained for CTCF binding peaks in naïve dKO CD8+ T cells, IL-7+IL-15-stimulated WT and dKO CD8+ T cells (not shown). c–d. Correlation of CTCF dynamics with gene expression changes. Genes in expression clusters (defined in Fig. 2a) were stratified against genes linked to differential CTCF clusters (defined in Fig. 2f), and the number of overlapping genes was counted (c). The ratio of the observed over expected overlapping gene counts was determined as a measurement of relative enrichment and shown in the correlation matrix (d). All elements in both matrices are color-coded based on gene numbers (c) and enrichment values (d). e–f. Performance test of CTCF antibodies in ChIP-seq assays. WT and dKO naïve CD8+ T cells were sequentially fixed with disuccinimidyl glutarate and formaldehyde, and the resulting chromatin was immunoprecipitated with anti-CTCF antibodies from Santa Cruz Biotechnology, Millipore, or Cell Signaling Technology (CST). CTCF peaks were called on merged replicates under the stringent criteria by requiring ≥4 fold enrichment over IgG control and FDR<0.05. Signal-to-noise ratio was determined as read count on CTCF peaks divided by read count on non-peak regions (e). Venn diagram in f shows the overlap of CTCF peaks determined with each ChIP-seq antibody in WT CD8+ T cells.
Extended Data Fig. 5. Tcf1-CTCF cooperativity is prevalent and specific in naïve CD8+ T cells.
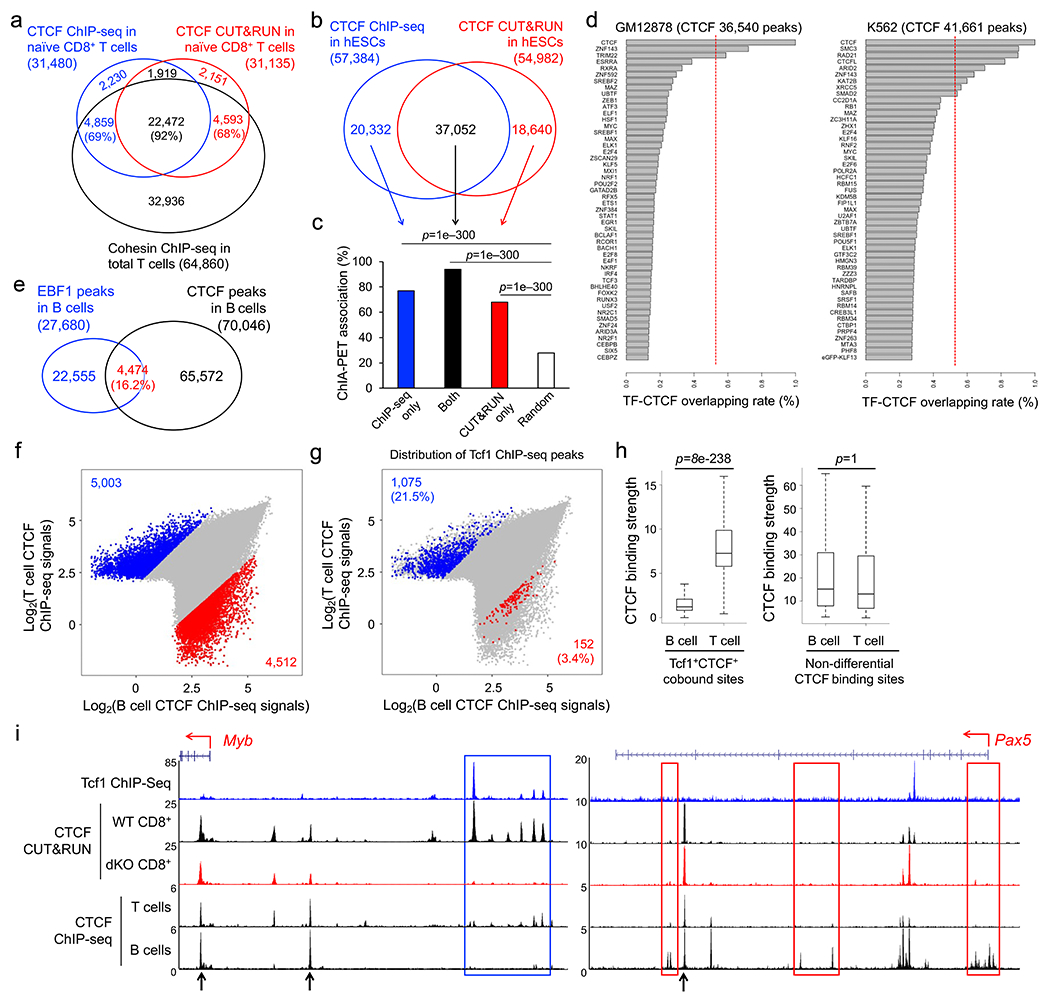
a. Most CTCF binding sites are co-occupied by cohesin. Rad21 ChIP-seq data in total T cells were download from GEO (Ref. 32, GSM2635601 under super-series GSE99197). Rad21 binding peaks were then called, and their overlap with CTCF binding peaks detected by ChIP-seq and/or CUT&RUN methods (this study) was summarized in the Venn diagrams. Values in parentheses denote percentages of CTCF peaks co-bound by Rad21 in each group. b. CTCF mapping with ChIP-seq and CUT&RUN in human H1 ESCs. CTCF ChIP-seq peaks were retrieved from the ENCODE project (accession number ENCFF023LAA), and CTCF CUT&RUN peaks from the 4D Nucleome Data Portal (accession number 4DNFI6OF4ZMC). The overlapping and unique peaks are summarized in a Venn diagram. c. CTCF binding sites are associated with chromatin interactions in human ESCs. CTCF ChIA-PET data in human ESCs were retrieved from the ENCODE project (accession number ENCFF401IWZ). Each group of CTCF binding sites defined in b was analyzed for association with long-range chromatin interactions (by requiring ≥5 paired-end tags (PET)/site). Randomly selected 10,000 genomic locations were used as a negative control. P-values were determined with one-sided binomial test. d. Assessing transcription factor (TF)-CTCF cooperativity in blood cell lines. The peaks of 107 and 383 TF ChIP-seq in GM12878 lymphoblastoid cells and K562 myelogenous leukemia cells, respectively, were retrieved from the ENCODE project. For each TF, its overlap rate with CTCF ChIP-seq peaks in each cell type was determined. Top 50 TFs with the highest TF-CTCF overlapping rates are plotted, where red dotted lines denote Tcf1-CTCF overlapping rate in naïve CD8+ T cells (based on CUN&RUN-detected CTCF peaks). e. Assessing TF-CTCF cooperativity in primary B lymphocytes. EBF1 and CTCF ChIP-seq in primary mouse B cells were retrieved from the public domain and their overlap was determined. EBF1 ChIP-seq peaks were obtained from Cistrome Data Browser under ID 71163. CTCF ChIP-seq data in total B cells were downloaded from Ref. 32 (GSM2635594 under super-series GSE99197), and peak calling was processed in-house. f–g. Tcf1 is more frequently associated with CTCF peaks specifically detected in T but not B cells. For a fair comparison, we used CTCF ChIP-seq data in total T and B cells from the same published study (Ref. 32, GSM2635596 and GSM2635594 under SuperSeries GSE99197, respectively). CTCF binding strength was then compared to identify 5,003 T cell-specific and 4,512 B cell-specific CTCF binding sites (fold changes ≥4), as shown in blue and red on the scatter plot, respectively (f). T- and B-specific CTCF binding sites that overlapped with Tcf1 ChIP-seq peaks were then enumerated, with percentages in parentheses denoting the overlapping rate (g). h. Tcf1 and CTCF co-occupied sites exhibit higher CTCF binding strength at T cell-specific than that at B cell-specific CTCF binding sites. CTCF binding strength (in reads per million per kb) was assessed in T and B cells for comparison for the following groups: 1,075 T and 152 B cell-specific CTCF binding sites that are co-occupied by Tcf1 (left panel), and 5,065 non-differential CTCF binding sites between T and B cells (right panel). Statistical significance is determined with one-sided MWU test. The box center lines denote the median, box edge denotes interquartile range (IQR), and whiskers denote the most extreme data points that are no more than 1.5 × IQR from the edge. i. T cell- and B cell-specific CTCF binding at select gene loci. Shown are sequencing tracks on the UCSC Genome Browser at the Myb and Pax5 gene loci. T cell-specific CTCF binding was found in a cluster of CTCF peaks upstream of Myb TSS (blue box), which colocalized with Tcf1 binding peaks, was also detectable with CTCF CUT&RUN in nave CD8+ T cells, showing strong dependence on Tcf1 and Lef1 (left panel). B cell-specific CTCF binding was found in 3 clusters of CTCF peaks at the Pax5 locus (red boxes), which were devoid of Tcf1 peaks or CTCF binding in T cells as determined with either ChIP-seq or CUT&RUN method. Arrows mark non-differential CTCF binding sites in T and B cells.
Extended Data Fig. 6. CTCF CUT&RUN and ChIP-seq methods both capture similar characteristics of dynamic and constitutive CTCF binding events in CD8+ T cells.
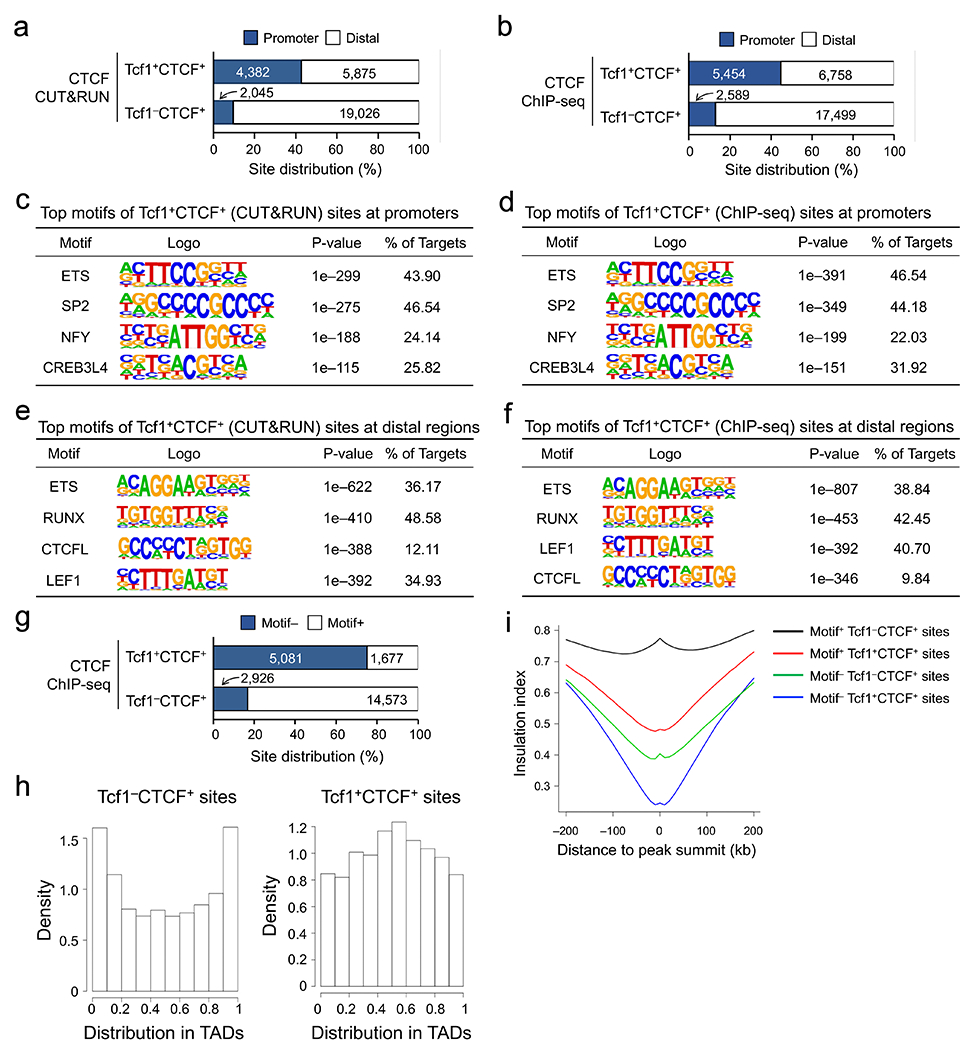
a-b. Distribution of Tcf1+CTCF+ and Tcf1−CTCF+ sites at the promoters (TSS+/–1kb) and distal regulatory regions, as determined with CTCF CUT&RUN (a) or CTCF ChIP-seq (b). Values in bars denote the actual numbers of Tcf1 peaks in Tcf1+CTCF+ sites and CTCF peaks in Tcf1−CTCF+ sites. c–d. Top motifs of Tcf1+CTCF+ sites at gene promoters as determined with HOMER. The analysis was based on CTCF CUT&RUN (c) or CTCF ChIP-seq data (d). e–f. Top motifs of Tcf1+CTCF+ sites in distal regulatory regions as determined with HOMER. The analysis was based on CTCF CUT&RUN (e) or CTCF ChIP-seq data (f). g. CTCF motif distribution in Tcf1+CTCF+ and Tcf1−CTCF+ sites (determined with CTCF ChIP-seq using the motifmatchr package in R), with values in bars denoting actual numbers of sites with or without the motif. h. The positional distribution of Tcf1−CTCF+ (left) and Tcf1+CTCF+ (right) sites within TADs based on CTCF ChIP-seq data. i. Profiles of insulation index around the four types of CTCF binding sites (determined with CTCF ChIP-seq), where the index values are indicative of insulation effects.
Extended Data Fig. 7. Correlation of Tcf1 and CTCF binding strength in CD8+ T cells.
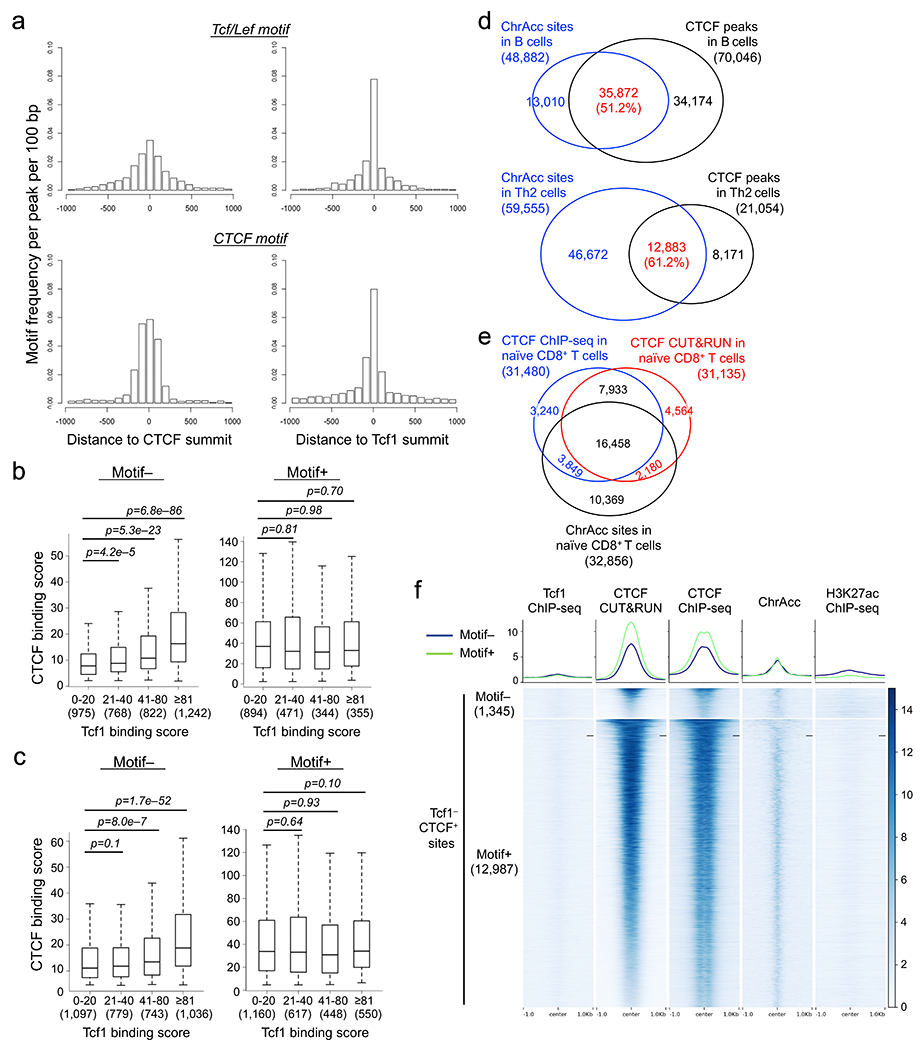
a. The frequency of Tcf+Lef motif occurrence (top) and CTCF motif occurrence (bottom) at Tcf1+CTCF+ sites (detected by both CUT&RUN and ChIP-seq methods). Note that Motif+CTCF sites accounted for <30% of distal Tcf1+CTCF+ sites (Fig. 3h), and Tcf+Lef motif occurred at ~20% of all Tcf1 ChIP-seq peaks (determined in Ref. 20). As a result, the motif occurrence frequency is relatively low in absolute values but remains a useful indicator for comparison between different groups. b–c. Correlation of Tcf1 and CTCF binding strength in Motif− (left) and Motif+ (right) subsets of Tcf1+CTCF+ sites as determined with CTCF CUT&RUN (b) or CTCF ChIP-seq (c). Tcf1 binding peaks were distributed into four groups based on their binding scores, with peak numbers in each group denoted in parentheses, and CTCF binding scores in each Tcf1 peak group was then determined. The binding score is defined as –log10(q-value) from MACS2, and p-value was determined with one-sided MWU test. The box center lines denote the median, box edge denotes interquartile range (IQR), and whiskers denote the most extreme data points that are no more than 1.5 × IQR from the edge. Color scale denotes relative strength of each molecular feature. d. Overlap between CTCF peaks with ChrAcc sites as determined with DNase-seq in B cells (top) and Th2 cells (bottom). CTCF ChIP-seq peaks in B cells were defined as in Extended Data Fig. 5f, and DNase-seq peaks in B cells were obtained from Cistrome Data Browser under ID 45090. CTCF ChIP-seq and DNase-seq peaks in Th2 cells were obtained from Cistrome Data Browser under ID 88187 and ID 92251, respectively. The overlap rates were based on CTCF peak numbers in each cell type. e. Overlap between CTCF peaks (determined with CUT&RUN and/or ChIP-seq methods) with ChrAcc sites (determined with DNase-seq) in naïve CD8+ T cells. f. Heatmaps showing local chromatin characteristics of distal Tcf1−CTCF+ sites (detected by both CUT&RUN and ChIP-seq methods), in Motif− and Motif+ subsets. Shown are aggregated profiles (top) and heatmaps (bottom) for each molecular feature in separate subsets. Color scale denotes relative strength of each molecular feature.
Extended Data Fig. 8. Tcf1 and Lef1 mediate CTCF recruitment in naïve CD8+ T cells.
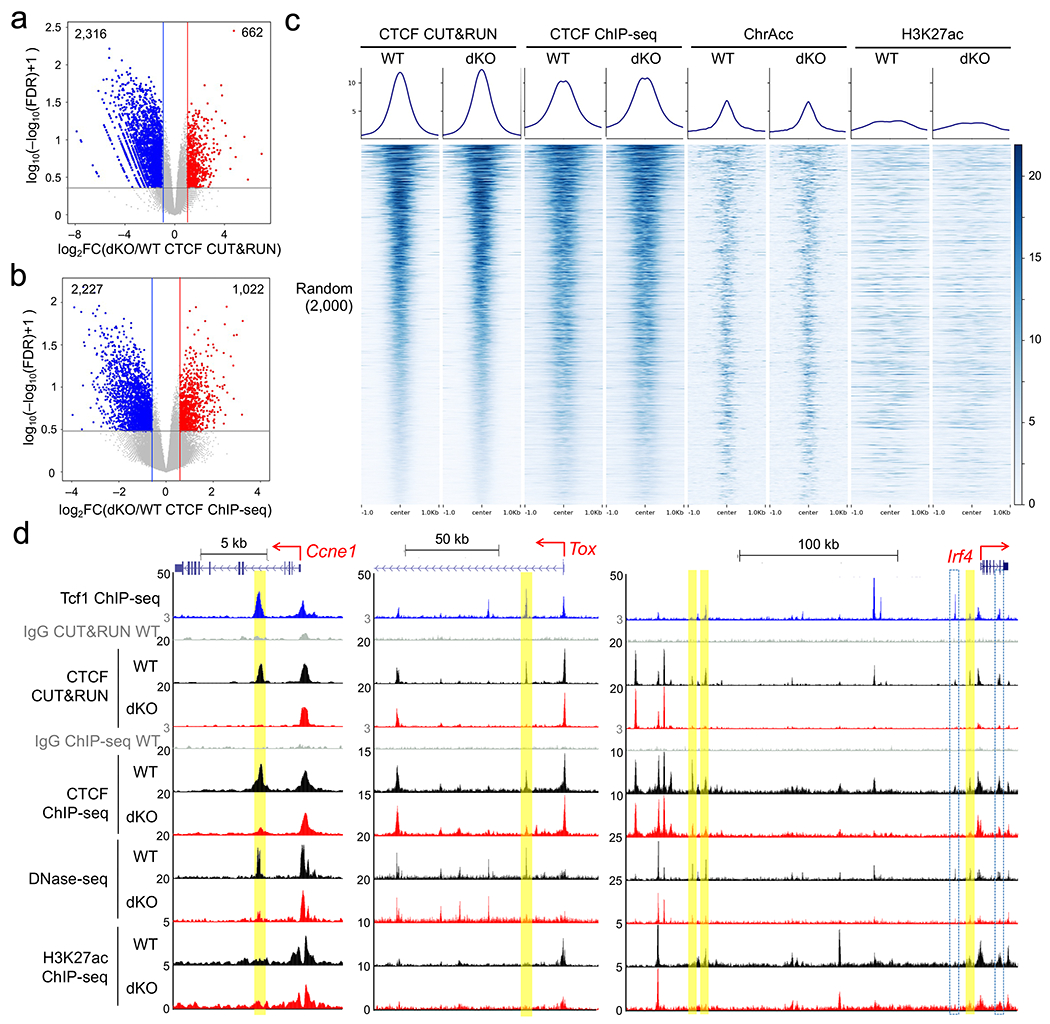
a–b. Volcano plots showing differential CTCF binding strength between WT and dKO CD8+ T cells as determined with CUT&RUN (a) or ChIP-seq (b). Note that due to differences in signal-to-noise ratios between CUT&RUN and ChIP-seq, the criteria were adjusted for defining differential CTCF binding between WT and dKO cells, as detailed in Methods. c. Tcf1+Lef1-independent CTCF binding sites are associated with weak ChrAcc or H3K27ac signals in WT and dKO CD8+ T cells with no apparent differences. 2,000 non-differential CTCF binding peaks between WT and dKO CD8+ T cells were randomly selected as a negative control for Tcf1+Lef1-dependent CTCF binding sites in Fig. 4e, and the indicated molecular features were displayed as aggregated profiles (top) and heatmaps (bottom). Color scale denotes relative strength of each molecular feature. d. Distal Tcf1+CTCF+ sites show concordant decrease in CTCF binding strength and ChrAcc in naive dKO compared to naïve WT CD8+ T cells, as displayed at the Ccne1, Tox, and Irf4 loci. Shown are Tcf1 ChIP-seq (top), CTCF CUT&RUN and CTCF ChIP-seq tracks in WT and dKO CD8+ T cells (middle), and DNase-seq and H3K27ac ChIP-seq tracks in WT and dKO CD8+ T cells (bottom). Whole or partial gene structure, transcription orientation, and genomic scale are displayed on top of each panel. Yellow bars denote Tcf1+Lef1-dependent Tcf1+CTCF+ site(s) detected with both CUT&RUN and CTCF ChIP-seq methods, while open bars with cyan borders denote those determined with one method only.
Extended Data Fig. 9. Global analysis of chromatin interaction scores reveals Tcf1-CTCF cooperativity in organizing genomic architecture in CD8+ T cells.
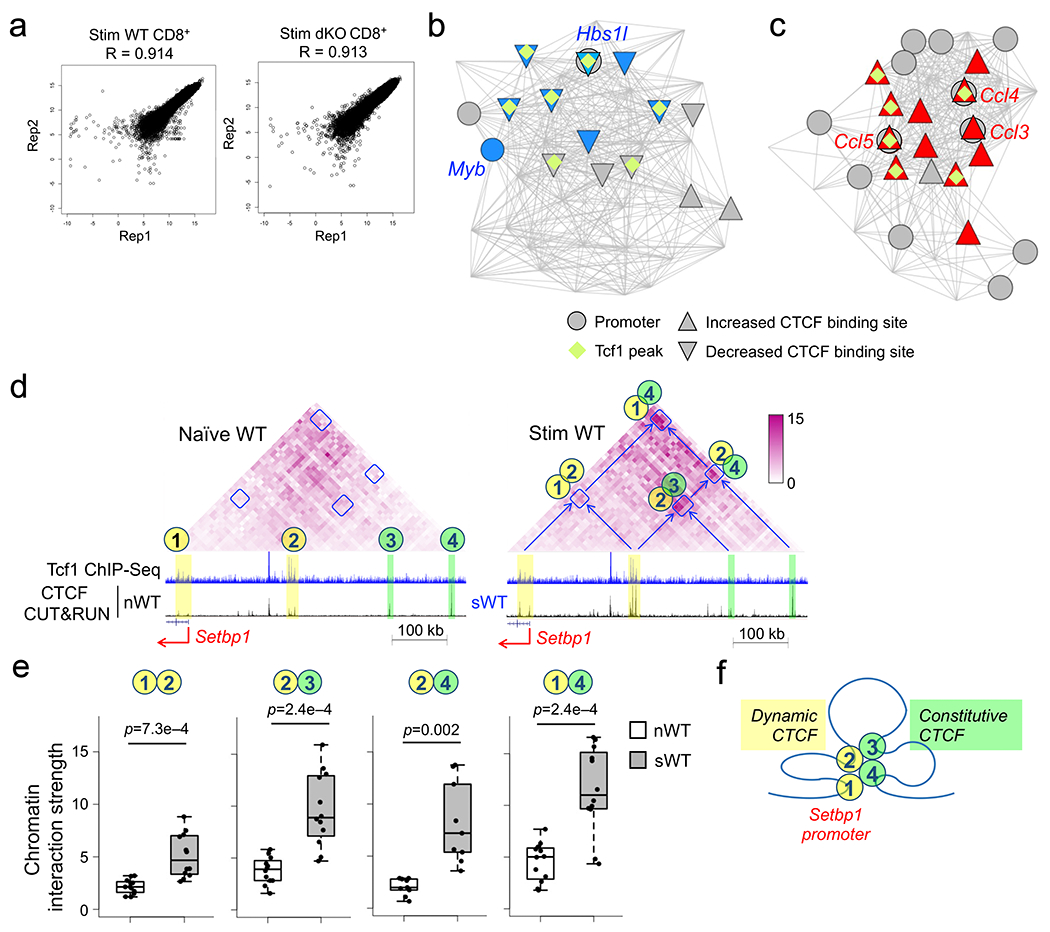
a. Scatterplots showing reproducibility of two biological replicates of Hi-C libraries from WT or dKO CD8+ T cells that were stimulated with IL-7 and IL-15 for 72 hrs ex vivo. The x- and y-axis values for each data point (marked with a dot) represent the interaction scores of an anchor in replicate 1 (Rep1) and replicate 2 (Rep 2), respectively. The R values denote Pearson correlation coefficient. b–c. Visualization of chromatin interaction hubs and connectivity with CTCF binding sites in naïve CD8+ T cells. Comparing chromatin interactions in naïve WT and dKO CD8+ T cells using HiCHub identified cell type-specific interaction hubs. b, WT-specific hub containing the Myb locus, where the nodes represent 10-kb bins and the lines represent chromatin interactions decreased in dKO CD8+ T cells. c, dKO-specific hub containing multiple Ccl genes, where the lines represent chromatin interactions increased in dKO CD8+ T cells. Circles denote bins containing gene promoters (with select gene symbols marked), and diamonds denote the presence of Tcf1 binding peaks. Triangles filled with blue and red denote statistically significant decrease and increase in CTCF binding strength in naïve dKO compared to naïve WT CD8+ T cells, respectively. d–e. IL-7 and IL-15 induce concordant changes in CTCF binding and chromatin interactions in CD8+ T cells. Diamond graphs in d show distance-normalized chromatin interactions in naïve WT (left) and IL-7+IL-15-stimulated (right panel) WT CD8+ T cells at the Setbp1 gene locus. Blue boxes denote chromatin interaction ‘patches’ showing dynamic changes by IL-7+IL-15 stimulation. Shown in the lower panels are gene structure, Tcf1 ChIP-seq tracks in naïve WT, CTCF CUT&RUN tracks in naïve (left) and IL-7+IL-15-stimulated (right panel) WT CD8+ T cells, along with genomic scale. Yellow bars mark dynamic CTCF binding sites, while green bars mark constitutive CTCF binding sites. Both dynamic and constitutive CTCF sites are numbered as chromatin interaction anchors in naïve cells (left), and the interaction ‘patches’ between the numbered anchor regions are annotated in IL-7+IL-15-stimulated cells (right). Color scale denotes chromatin interaction strength. e. Chromatin interaction strength for each pair of 10-kb anchors within each annotated interaction ‘patch’ at the Setbp1 gene locus was determined in naïve and IL-7+IL-15-stimulated WT CD8+ T cells, with p-value calculated using one-sided paired Wilcoxon test. The box center lines denote the median, box edge denotes interquartile range (IQR), and whiskers denote the most extreme data points that are no more than 1.5 × IQR from the edge. f. Projected model of homeostatic cytokine-induced chromatin reorganization that involves both dynamic and constitutive CTCF binding and brings distal regulatory regions into contact with the Setbp1 gene promoter.
Extended Data Fig. 10. Characterization of CTCF-deficient CD8+ T cells.
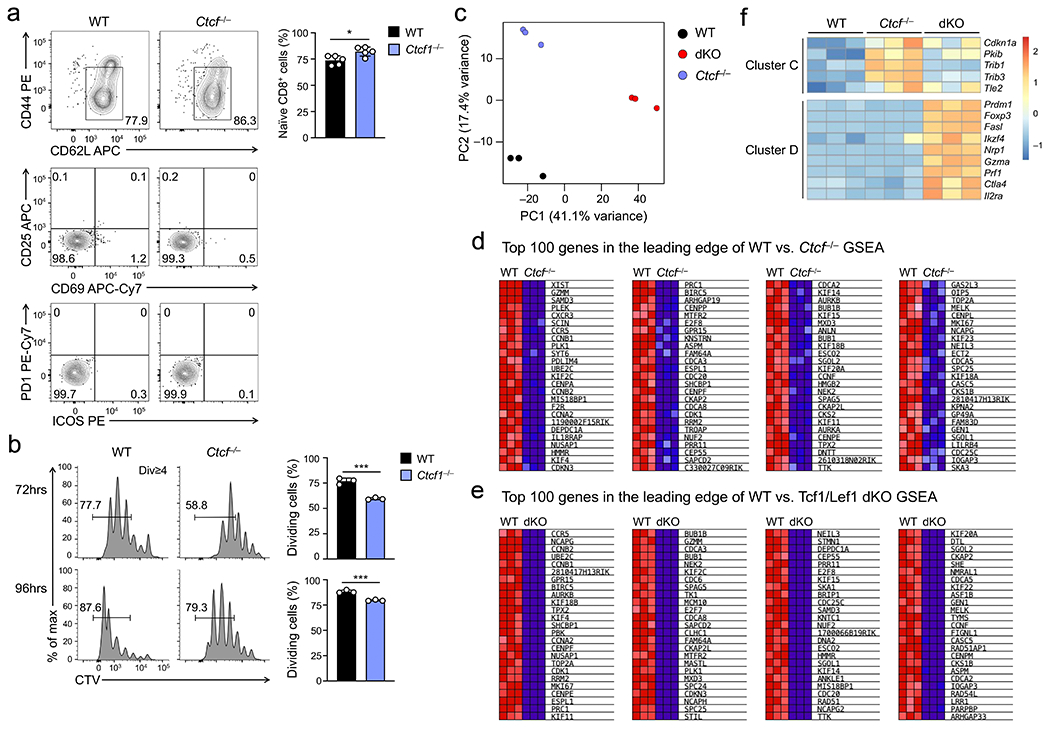
a. Detection of CD44loCD62L+ naïve TCRβ+GFP+CD8+ T cells in splenocytes from WT and Ctcf−/− mice, and further analysis of activation markers including CD25, CD69, PD1, and ICOS of naïve cells. b. Cell division of CTV-labeled naïve WT or Ctcf−/− CD45.2+GFP+CD8+ T cells at 72 (top) or 96 hrs (bottom) after ex vivo stimulation with plate-bound anti-CD3 in the presence of soluble anti-CD28 and IL-2, with frequency of cells showing ≥1 division summarized (right). Representative contour plots (a) and histographs (b) are from 2 experiments, and cumulative data are means ± s.d. *, p<0.05; ***, p<0.001; ns, not statistically significant by two-tailed Student’s t-test. c. PCA of RNA-seq libraries from CTV-labeled WT, dKO and Ctcf−/− GFP+CD8+ T cells sorted at 72 hrs after transfer into Rag1−/− recipients. d–e. Heatmaps showing the top 100 genes in the leading edge from GSEA comparing WT and Ctcf−/− (d) or that comparing WT and dKO CD8+ T cell transcriptomes (e), as in Fig. 8d. Note that among the 616 ExpC1 genes, 337 and 392 genes were in the leading edge of WT vs. Ctcf−/− and WT vs. Tcf1/Lef1 dKO comparisons, respectively. f. Heatmaps of select genes in Clusters C and D as defined in Fig. 8f. Note that dKO but not Ctcf−/− CD8+ T cells showed aberrantly induced expression of TREG cell-associated genes (Foxp3, Nrp1 and Ikzf4) and effector CD8+T cell-associated genes (Prdm1, Fasl and Prf1), consistent with a specific requirement for Tcf1 and Lef1, but not CTCF in providing constant supervision to mature CD8+ T cell identity.
Supplementary Material
Acknowledgements
We thank the University of Iowa Flow Cytometry Core facility (J. Fishbaugh, H. Vignes and G. Rasmussen) and the HMH-CDI Flow Cytometry Core facility (M. Poulus and W. Tsao) for cell sorting, and S. Xing for his contribution during the early phase of this study. We thank N. Galjart (Erasmus Medical Center, Netherlands) for the permission of using Ctcf-floxed mouse strain, and A.M. Melnick and M.A. Rivas (Weill Cornell Medical College) for providing the mice. This study is supported in-part by grants from the NIH (AI112579 to H.-H.X., AI121080 and AI139874 to H.-H.X and W. P.) and the Veteran Affairs (BX005771 to H.-H.X.).
Footnotes
Code availability
The code for HiCHub is available at https://github.com/WeiqunPengLab/HiCHub
Competing Interests
The authors declare no conflict of interests.
Data availability
The Hi-C, DNase-seq, RNA-seq, and CTCF CUT&RUN data in IL-7+IL-15-stimulated WT and dKO CD8+ T cells, along with CTCF ChIP-seq and CTCF CUT&RUN in naïve WT and dKO CD8+ T cells have been deposited at the Gene Expression Omnibus (GEO) under accession number under GSE179775. The Hi-C, DNase-seq, and RNA-seq data in naïve WT and dKO CD8+ T cells, Tcf1 ChIP-Seq data in naïve WT CD8+ T cells were previously deposited at the GEO under GSE164713.
References:
- 1.Velardi E, Tsai JJ & van den Brink MRM T cell regeneration after immunological injury. Nat Rev Immunol 21, 277–291 (2021). [DOI] [PMC free article] [PubMed] [Google Scholar]
- 2.Tan JT et al. IL-7 is critical for homeostatic proliferation and survival of naive T cells. Proc Natl Acad Sci U S A 98, 8732–8737 (2001). [DOI] [PMC free article] [PubMed] [Google Scholar]
- 3.Schluns KS, Kieper WC, Jameson SC & Lefrancois L Interleukin-7 mediates the homeostasis of naive and memory CD8 T cells in vivo. Nat Immunol 1, 426–432 (2000). [DOI] [PubMed] [Google Scholar]
- 4.Berard M, Brandt K, Bulfone-Paus S & Tough DF IL-15 promotes the survival of naive and memory phenotype CD8+ T cells. J Immunol 170, 5018–5026 (2003). [DOI] [PubMed] [Google Scholar]
- 5.Leonard WJ, Lin JX & O’Shea JJ The gammac Family of Cytokines: Basic Biology to Therapeutic Ramifications. Immunity 50, 832–850 (2019). [DOI] [PubMed] [Google Scholar]
- 6.Yao Z et al. Stat5a/b are essential for normal lymphoid development and differentiation. Proc Natl Acad Sci U S A 103, 1000–1005 (2006). [DOI] [PMC free article] [PubMed] [Google Scholar]
- 7.Zhao X, Shan Q & Xue HH TCF1 in T cell immunity: a broadened frontier. Nat Rev Immunol (2021). [DOI] [PubMed] [Google Scholar]
- 8.Gullicksrud JA, Shan Q & Xue HH Tcf1 at the crossroads of CD4+ and CD8+ T cell identity. Front. Biol. 12, 83–93 (2017). [Google Scholar]
- 9.Xing S et al. Tcf1 and Lef1 transcription factors establish CD8(+) T cell identity through intrinsic HDAC activity. Nat Immunol 17, 695–703 (2016). [DOI] [PMC free article] [PubMed] [Google Scholar]
- 10.Jeannet G et al. Essential role of the Wnt pathway effector Tcf-1 for the establishment of functional CD8 T cell memory. Proc Natl Acad Sci U S A 107, 9777–9782 (2010). [DOI] [PMC free article] [PubMed] [Google Scholar]
- 11.Zhou X et al. Differentiation and persistence of memory CD8(+) T cells depend on T cell factor 1. Immunity 33, 229–240 (2010). [DOI] [PMC free article] [PubMed] [Google Scholar]
- 12.Shan Q et al. Tcf1 preprograms the mobilization of glycolysis in central memory CD8(+) T cells during recall responses. Nat Immunol 23, 386–398 (2022). [DOI] [PMC free article] [PubMed] [Google Scholar]
- 13.Shan Q et al. Ectopic Tcf1 expression instills a stem-like program in exhausted CD8(+) T cells to enhance viral and tumor immunity. Cell Mol Immunol 18, 1262–1277 (2021). [DOI] [PMC free article] [PubMed] [Google Scholar]
- 14.Im SJ et al. Defining CD8+ T cells that provide the proliferative burst after PD-1 therapy. Nature 537, 417–421 (2016). [DOI] [PMC free article] [PubMed] [Google Scholar]
- 15.Utzschneider DT et al. T Cell Factor 1-Expressing Memory-like CD8(+) T Cells Sustain the Immune Response to Chronic Viral Infections. Immunity 45, 415–427 (2016). [DOI] [PubMed] [Google Scholar]
- 16.Leong YA et al. CXCR5(+) follicular cytotoxic T cells control viral infection in B cell follicles. Nat Immunol 17, 1187–1196 (2016). [DOI] [PubMed] [Google Scholar]
- 17.Grosschedl R, Giese K & Pagel J HMG domain proteins: architectural elements in the assembly of nucleoprotein structures. Trends Genet 10, 94–100 (1994). [DOI] [PubMed] [Google Scholar]
- 18.Giese K, Kingsley C, Kirshner JR & Grosschedl R Assembly and function of a TCR alpha enhancer complex is dependent on LEF-1-induced DNA bending and multiple protein-protein interactions. Genes Dev 9, 995–1008 (1995). [DOI] [PubMed] [Google Scholar]
- 19.Love JJ et al. Structural basis for DNA bending by the architectural transcription factor LEF-1. Nature 376, 791–795 (1995). [DOI] [PubMed] [Google Scholar]
- 20.Shan Q et al. Tcf1 and Lef1 provide constant supervision to mature CD8(+) T cell identity and function by organizing genomic architecture. Nat Commun 12, 5863 (2021). [DOI] [PMC free article] [PubMed] [Google Scholar]
- 21.Ohlsson R, Renkawitz R & Lobanenkov V CTCF is a uniquely versatile transcription regulator linked to epigenetics and disease. Trends Genet 17, 520–527 (2001). [DOI] [PubMed] [Google Scholar]
- 22.Ong CT & Corces VG CTCF: an architectural protein bridging genome topology and function. Nat Rev Genet 15, 234–246 (2014). [DOI] [PMC free article] [PubMed] [Google Scholar]
- 23.Li F et al. TFH cells depend on Tcf1-intrinsic HDAC activity to suppress CTLA4 and guard B-cell help function. Proc Natl Acad Sci U S A 118 (2021). [DOI] [PMC free article] [PubMed] [Google Scholar]
- 24.Surh CD & Sprent J Homeostasis of naive and memory T cells. Immunity 29, 848–862 (2008). [DOI] [PubMed] [Google Scholar]
- 25.Schep AN, Wu B, Buenrostro JD & Greenleaf WJ chromVAR: inferring transcription-factor-associated accessibility from single-cell epigenomic data. Nat Methods 14, 975–978 (2017). [DOI] [PMC free article] [PubMed] [Google Scholar]
- 26.Johnson JL et al. Lineage-Determining Transcription Factor TCF-1 Initiates the Epigenetic Identity of T Cells. Immunity 48, 243–257 e210 (2018). [DOI] [PMC free article] [PubMed] [Google Scholar]
- 27.Emmanuel AO et al. TCF-1 and HEB cooperate to establish the epigenetic and transcription profiles of CD4(+)CD8(+) thymocytes. Nat Immunol 19, 1366–1378 (2018). [DOI] [PMC free article] [PubMed] [Google Scholar]
- 28.Bixel G et al. Mouse CD99 participates in T-cell recruitment into inflamed skin. Blood 104, 3205–3213 (2004). [DOI] [PubMed] [Google Scholar]
- 29.Shi H et al. N4BP1 negatively regulates NF-kappaB by binding and inhibiting NEMO oligomerization. Nat Commun 12, 1379 (2021). [DOI] [PMC free article] [PubMed] [Google Scholar]
- 30.Skene PJ & Henikoff S An efficient targeted nuclease strategy for high-resolution mapping of DNA binding sites. Elife 6 (2017). [DOI] [PMC free article] [PubMed] [Google Scholar]
- 31.Tian B, Yang J & Brasier AR Two-step cross-linking for analysis of protein-chromatin interactions. Methods Mol Biol 809, 105–120 (2012). [DOI] [PMC free article] [PubMed] [Google Scholar]
- 32.Canela A et al. Genome Organization Drives Chromosome Fragility. Cell 170, 507–521 e518 (2017). [DOI] [PMC free article] [PubMed] [Google Scholar]
- 33.Tang Z et al. CTCF-Mediated Human 3D Genome Architecture Reveals Chromatin Topology for Transcription. Cell 163, 1611–1627 (2015). [DOI] [PMC free article] [PubMed] [Google Scholar]
- 34.Hu Y et al. Superenhancer reprogramming drives a B-cell-epithelial transition and high-risk leukemia. Genes Dev 30, 1971–1990 (2016). [DOI] [PMC free article] [PubMed] [Google Scholar]
- 35.Qi Q et al. Dynamic CTCF binding directly mediates interactions among cis-regulatory elements essential for hematopoiesis. Blood 137, 1327–1339 (2021). [DOI] [PMC free article] [PubMed] [Google Scholar]
- 36.Gong Y et al. Stratification of TAD boundaries reveals preferential insulation of super-enhancers by strong boundaries. Nat Commun 9, 542 (2018). [DOI] [PMC free article] [PubMed] [Google Scholar]
- 37.Ren G et al. CTCF-Mediated Enhancer-Promoter Interaction Is a Critical Regulator of Cell-to-Cell Variation of Gene Expression. Mol Cell 67, 1049–1058 e1046 (2017). [DOI] [PMC free article] [PubMed] [Google Scholar]
- 38.Fang D et al. Bcl11b, a novel GATA3-interacting protein, suppresses Th1 while limiting Th2 cell differentiation. J Exp Med 215, 1449–1462 (2018). [DOI] [PMC free article] [PubMed] [Google Scholar]
- 39.Yue F et al. A comparative encyclopedia of DNA elements in the mouse genome. Nature 515, 355–364 (2014). [DOI] [PMC free article] [PubMed] [Google Scholar]
- 40.Lai JS & Herr W Ethidium bromide provides a simple tool for identifying genuine DNA-independent protein associations. Proc Natl Acad Sci U S A 89, 6958–6962 (1992). [DOI] [PMC free article] [PubMed] [Google Scholar]
- 41.McLean CY et al. GREAT improves functional interpretation of cis-regulatory regions. Nat Biotechnol 28, 495–501 (2010). [DOI] [PMC free article] [PubMed] [Google Scholar]
- 42.Piazza R et al. SETBP1 induces transcription of a network of development genes by acting as an epigenetic hub. Nat Commun 9, 2192 (2018). [DOI] [PMC free article] [PubMed] [Google Scholar]
- 43.Nishimura H et al. A novel role of CD30/CD30 ligand signaling in the generation of long-lived memory CD8+ T cells. J Immunol 175, 4627–4634 (2005). [DOI] [PubMed] [Google Scholar]
- 44.Madsen JGS et al. Highly interconnected enhancer communities control lineage-determining genes in human mesenchymal stem cells. Nat Genet 52, 1227–1238 (2020). [DOI] [PubMed] [Google Scholar]
- 45.Li X, Yuan S, Zhu S, Xue H-H & Peng W HiCHub: A Network-Based Approach to Identify Domains of Differential Interactions from 3D Genome Data. bioRxiv, 2022.2004.2016.488566 (2022). [Google Scholar]
- 46.Xue HH & Zhao DM Regulation of mature T cell responses by the Wnt signaling pathway. Ann N Y Acad Sci 1247, 16–33 (2012). [DOI] [PubMed] [Google Scholar]
- 47.Zhao X et al. beta-catenin and gamma-catenin are dispensable for T lymphocytes and AML leukemic stem cells. Elife 9 (2020). [DOI] [PMC free article] [PubMed] [Google Scholar]
- 48.Pongubala JMR & Murre C Spatial Organization of Chromatin: Transcriptional Control of Adaptive Immune Cell Development. Front Immunol 12, 633825 (2021). [DOI] [PMC free article] [PubMed] [Google Scholar]
- 49.Chisolm DA et al. CCCTC-Binding Factor Translates Interleukin 2- and alpha-Ketoglutarate-Sensitive Metabolic Changes in T Cells into Context-Dependent Gene Programs. Immunity 47, 251–267 e257 (2017). [DOI] [PMC free article] [PubMed] [Google Scholar]
- 50.Hu G et al. Transformation of Accessible Chromatin and 3D Nucleome Underlies Lineage Commitment of Early T Cells. Immunity 48, 227–242 e228 (2018). [DOI] [PMC free article] [PubMed] [Google Scholar]
Methods-only References
- 51.Steinke FC et al. TCF-1 and LEF-1 act upstream of Th-POK to promote the CD4(+) T cell fate and interact with Runx3 to silence Cd4 in CD8(+) T cells. Nat Immunol 15, 646–656 (2014). [DOI] [PMC free article] [PubMed] [Google Scholar]
- 52.Yu S et al. The TCF-1 and LEF-1 Transcription Factors Have Cooperative and Opposing Roles in T Cell Development and Malignancy. Immunity 37, 813–826 (2012). [DOI] [PMC free article] [PubMed] [Google Scholar]
- 53.Heath H et al. CTCF regulates cell cycle progression of alphabeta T cells in the thymus. EMBO J 27, 2839–2850 (2008). [DOI] [PMC free article] [PubMed] [Google Scholar]
- 54.Shan Q et al. The transcription factor Runx3 guards cytotoxic CD8(+) effector T cells against deviation towards follicular helper T cell lineage. Nat Immunol 18, 931–939 (2017). [DOI] [PMC free article] [PubMed] [Google Scholar]
- 55.Kim D et al. TopHat2: accurate alignment of transcriptomes in the presence of insertions, deletions and gene fusions. Genome Biol 14, R36 (2013). [DOI] [PMC free article] [PubMed] [Google Scholar]
- 56.Trapnell C et al. Differential gene and transcript expression analysis of RNA-seq experiments with TopHat and Cufflinks. Nat Protoc 7, 562–578 (2012). [DOI] [PMC free article] [PubMed] [Google Scholar]
- 57.Jin W et al. Genome-wide detection of DNase I hypersensitive sites in single cells and FFPE tissue samples. Nature 528, 142–146 (2015). [DOI] [PMC free article] [PubMed] [Google Scholar]
- 58.Langmead B & Salzberg SL Fast gapped-read alignment with Bowtie 2. Nat Methods 9, 357–359 (2012). [DOI] [PMC free article] [PubMed] [Google Scholar]
- 59.Li H et al. The Sequence Alignment/Map format and SAMtools. Bioinformatics 25, 2078–2079 (2009). [DOI] [PMC free article] [PubMed] [Google Scholar]
- 60.Zhang Y et al. Model-based analysis of ChIP-Seq (MACS). Genome Biol 9, R137 (2008). [DOI] [PMC free article] [PubMed] [Google Scholar]
- 61.Robinson MD, McCarthy DJ & Smyth GK edgeR: a Bioconductor package for differential expression analysis of digital gene expression data. Bioinformatics 26, 139–140 (2010). [DOI] [PMC free article] [PubMed] [Google Scholar]
- 62.Zang C et al. A clustering approach for identification of enriched domains from histone modification ChIP-Seq data. Bioinformatics 25, 1952–1958 (2009). [DOI] [PMC free article] [PubMed] [Google Scholar]
- 63.Durand NC et al. Juicer Provides a One-Click System for Analyzing Loop-Resolution Hi-C Experiments. Cell Syst 3, 95–98 (2016). [DOI] [PMC free article] [PubMed] [Google Scholar]
- 64.Fang C et al. Cancer-specific CTCF binding facilitates oncogenic transcriptional dysregulation. Genome Biol 21, 247 (2020). [DOI] [PMC free article] [PubMed] [Google Scholar]
- 65.Crane E et al. Condensin-driven remodelling of X chromosome topology during dosage compensation. Nature 523, 240–244 (2015). [DOI] [PMC free article] [PubMed] [Google Scholar]
- 66.Blondel V, Guillaume J, Lambiotte R & Lefebvre E Fast unfolding of communities in large networks. Journal of Statistical Mechanics: Theory and Experiment 2008, 10008 (2008). [Google Scholar]
Associated Data
This section collects any data citations, data availability statements, or supplementary materials included in this article.
Supplementary Materials
Data Availability Statement
The Hi-C, DNase-seq, RNA-seq, and CTCF CUT&RUN data in IL-7+IL-15-stimulated WT and dKO CD8+ T cells, along with CTCF ChIP-seq and CTCF CUT&RUN in naïve WT and dKO CD8+ T cells have been deposited at the Gene Expression Omnibus (GEO) under accession number under GSE179775. The Hi-C, DNase-seq, and RNA-seq data in naïve WT and dKO CD8+ T cells, Tcf1 ChIP-Seq data in naïve WT CD8+ T cells were previously deposited at the GEO under GSE164713.


