

Abstract
The European Commission requested scientific and technical assistance in the preparation of a EU‐wide baseline survey protocol for a European Union (EU) coordinated monitoring programme on the prevalence of methicillin‐resistant Staphylococcus Aureus (MRSA) in pigs. The objective of the survey is to estimate the MRSA prevalence in batches of fattening pigs at slaughter at both European and national levels, with a 95% level of confidence and a level of precision of 10% considering an expected prevalence of 50%. The survey protocol defines the target population, the sample size for the survey, sample collection requirements, the analytical methods (for isolation, identification, phenotypic susceptibility testing and further genotypic testing of MRSA isolates), the data reporting requirements and the plan of analysis. The samples are to be analysed according to the laboratory protocols available on the European Union Reference Laboratory (EURL‐AR) website. Generalised linear models will be used to estimate proportion (with 95% confidence intervals) of batches of slaughter pigs tested positive to MRSA. The necessary data to be reported by the EU Member States to support this baseline survey are presented in three data models. The results of the survey should be reported using the EFSA data collection framework.
Keywords: harmonisation, cross‐sectional prevalence study, methicillin‐resistant Staphylococcus aureus , antimicrobial resistance, fattening pigs
1. Introduction
1.1. Background
Since 2014, AMR in certain bacterial organisms present in food or food‐producing animals has been monitored under Commission Implementing Decision 2013/652/EU implementing Directive 2003/99/EC and the data collected during these years provide an important resource against which future trends can be evaluated. The AMR monitoring in food‐producing animals and food was revised in 2020 by Commission Implementing Decision (EU) 2020/1729 of 17 November 2020, applicable as from 1 January 2021, which has laid down specific technical requirements, for the period 2021–2027 for AMR testing and reporting in representative isolates deriving from randomised sampling in food‐producing animals performed at farm and/or at slaughter and derived meat performed at retail and at border control posts.
In addition to the routine monitoring performed on a biennial basis, the undertaking of complementary cross‐sectional baseline surveys (BS) was suggested by the EFSA Scientific Report on the technical specifications on harmonised monitoring of AMR in zoonotic and indicator bacteria from food‐producing animals and food,1 in order to assess specifically the situation on certain AMR issues, such as MRSA, AMR in bacteria from sea food and AMR in bacteria from the environment, over the period of validity of the upcoming Commission Implementing Decision (EU) 2020/1729 in 2021 onwards.2
In accordance with the agreement reached during the decision‐making process on Commission Implementing Decision (EU) 2020/1729 between the Member States (MSs) and the Commission on complementing the routine monitoring of AMR with specific BS on AMR, an online survey of the EFSA Network on zoonoses/AMR monitoring was carried out to collect and better assess the views of the MSs regarding the scope, priorities and the timing of BSs on AMR and to gauge the potential for further harmonisation of procedures and the degree of support from MSs for further AMR monitoring. The outcome of the survey indicated that according of the order of priority of the MSs and reporting countries, the BS‐AMR on methicillin‐resistant Staphylococcus aureus (MRSA) from pigs should be performed first. Followed by the BS‐AMR on Seafood‐Environment and BS‐AMR on Enterococci. Ideally, the timing of these surveys should be harmonised between MSs to optimise comparability of results.
It is therefore envisaged that a detailed harmonised protocol for a BS on the prevalence and AMR of MRSA in pigs and possibly in other relevant food‐producing populations will be designed, taking account of recent data from MSs and the latest scientific developments. Ideally, the timing of these surveys should be harmonised between MSs to ensure comparability of results.
The survey should notably provide in relevant food‐producing animal populations:
The prevalence/occurrence of MRSA at the EU level;
A comparison of the prevalence and occurrence of antimicrobial resistance of MRSA in the EU MSs; and
Information on the genetic diversity (e.g. lineages/strains) and virulence factors of MRSA detected.
1.2. Terms of Reference as provided by the requestor
In accordance with article 31 of Regulation (EC) No 178/2002, the Commission requests scientific and technical assistance from EFSA to provide technical and scientific support for the development of a BS as regards MRSA in pigs considering the most recent scientific literature and technological developments, epidemiological trends and relevance for public health.
In particular, EFSA is asked to propose harmonised approaches for the collection and the analysis of AMR data for MRSA in pigs by:
proposing a sampling framework (including the origin of bacterial isolates subject to AMR testing, the sampling design and the sample size) for the implementation of BS on MRSA in pigs;
proposing a harmonised protocol for isolation and characterisation of MRSA from pigs;
proposing a harmonised protocol for antimicrobial susceptibility testing of MRSA isolates and for the use of molecular typing methods (e.g. whole genome sequencing) to complement or replace the phenotypic methods and facilitate detection of relevant virulence factors;
providing guidance for technical reporting of the BS data to EFSA.
providing guidance for scientific analyses of reported data.
2. Rationale for the choices made in the proposal
2.1. The choice of the pig population to be surveyed
It is proposed that fattening pigs are mainly targeted because they account for a large share of the overall pig population. MRSA strains found in the breeding pig population are likely to be transmitted to fattening pigs. The situation in fattening pigs will to some extent mirror that in the breeding pig population. Previously published studies indicate that the fattening pig population is likely to be an appropriate and sensitive target group for detecting MRSA in pigs.
2.2. Rationale for the stage of the food chain to survey MRSA
The two stages primarily considered to monitor or survey MRSA were the farm or the slaughterhouse. Monitoring at farm level could facilitate investigation of risk factors and the influence of farm management practices on the occurrence of MRSA, though costs of sampling on farms were likely to be higher than sampling at slaughterhouses; the latter being considered to be more cost‐effective (EFSA, 2009a,b, 2012). A degree of cross‐contamination between batches of animals is considered likely to occur in abattoir‐based monitoring and changes in MRSA status in finished pigs can occur during transport to abattoirs and also while held in the lairage prior to slaughter (Broens et al., 2011). Changes in the MRSA status of pigs have usually been assessed by monitoring through the collection of nasal and/or ear skin swabs and it is possible that animals are also carriers at other anatomical sites, such as the tonsil. Longitudinal studies also indicate that carriage of MRSA declines about 4 weeks after weaning in pigs fed with feeding supplemented with and without ZnO (Slifierz et al., 2015), and on entry to the fattening period (Bangerter et al., 2016). Nevertheless, studies carried out in Italy in 2008 have shown that the outputs obtained through population studies on MRSA in production pigs on the farm (survey performed in accordance with Decision 2008/55/EC3) or at the abattoir (Battisti et al., 2010) provide a broadly similar picture, with non‐significantly different holding‐level prevalence assessed at around 35% in both approaches and similar distributions of spa‐types and sequence types (STs). In most MSs, monitoring MRSA at the slaughterhouse is comparatively more cost‐effective to determine prevalence, particularly in the case of low to very low prevalence, or to assess the diversity of the MRSA subtypes prevalent in a production sector, as it has been demonstrated to be highly sensitive. A drawback relates to difficulties in interpreting the prevalence data, as cross‐contamination is known to occur during transport and lairage (EFSA BIOHAZ Panel, in press), making it difficult to infer the original MRSA prevalence of the animals on farm (Broens et al., 2011). Linking the MRSA strains discovered at the slaughterhouse to any particular farm will also be complex, if at all possible. If data on the within‐batch prevalence of MRSA are not needed and between‐batch comparison is enough, then this disadvantage is less critical. It is proposed to perform the MRSA BS at the slaughterhouse. In developing this protocol, the aim was to build as much as possible on the AMR routine monitoring already in place adding as little as possible additional burden on the MSs.
2.3. Rationale for the expected prevalence of MRSA
There is limited information regarding prevalence of MRSA in pigs in Europe, and the information that do exist is scattered. It consists of a limited number of national surveillance programmes as well as research studies performed over a long time period. Concordantly, there is little consistency or harmonisation among studies as regards to sample selection and molecular methods. Although this hampers direct comparison between studies, some general conclusions can be drawn.
The results of studies performed at slaughterhouses in Europe, investigating the prevalence of MRSA in fattening pigs using either nasal swabs and/or ear skin swabs and published in peer‐reviewed journals have been summarised in Table 1. Information regarding the prevalence of MRSA in pigs assessed on the farm is also available, both from the same and additional countries. From these reports, it can be concluded that within Europe, there is a marked variability in the prevalence of MRSA in pigs, ranging from rare to extremely high. Moreover, increasing trends can be seen in countries that over time and in a consistent way have monitored the prevalence of MRSA in pigs. For example, the prevalence of MRSA among fattening pigs sampled at slaughter in Switzerland has increased from 5.1% in 2011 to 52.8% in 2019.
Table 1.
Studies investigating prevalence of MRSA in pigs at the slaughterhouse in Europe
| Reference | Study year | Country | Sampling stage | Sample type | Slaughter batch size (#animals) | Sample batch size (#animals) | MRSA prevalence (%) | |||
|---|---|---|---|---|---|---|---|---|---|---|
| Animal level | Batch level | Within batch | Farm level | |||||||
| De Neeling et al. (2007) | 2005–2006 | NL | AF | NS | NR | 10 | 39 | 81 | 0–100 | 80 (a) |
| Horgan et al. (2011) | 2007 + 2009 | IE | AF | NS | NR | 1 | 0 | 0 | 0 | 0 |
| Tenhagen et al. (2009) | < 2009 | DE | AF | NS | NR | 10 | 71 | 98 | NR | NR |
| Tenhagen et al. (2009) | < 2009 | DE | AF | NS | NR | 1–18 | 49 | 82 | NR | NR |
| Battisti et al. (2010) | 2008 | IT | AF | NS | NR | 10 | NR | 14 | NR | 38 |
| Broens et al. (2011) | 2008–2009 | NL | AF | NS | 27–65 | 27–30 | 59.8 | 100 | 6.7–100 | 100 |
| Agersø et al. (2013) | 2009 | DK | BS | NS | NR | 1 | 13 | NR | NR | 14 |
| Beneke et al. (2011) | 2011 | DE | AF | NS | NR | 1 | 64.7 | NR | NR | 70.9 |
| Normanno et al. (2015) | < 2015 | IT | AF | NS | NR | 1 | 37.6 | NR | NR | NR |
| Dierikx et al. (2016) | 2015 | NL | AF | NS | NR | 9–11 | 99.5 | 100 | 40–100 | 100 |
| Smith et al. (2021) | 2016 | UK | AF | NS | NR | 1 and 20 | NR | 34.6 | NR | NR |
| Smith et al. (2021) | 2016 | UK | AF | ESS | NR | 1 and 20 | NR | 29.5 | NR | NR |
| Smith et al. (2021) | 2016 | UK | AF | NS + ESS | NR | 1 and 20 | NR | 43.8 | 5–70 | NR |
AF: after stunning; BS: before scalding; ESS: ear skin swabs; NS: nasal swabs; NR: not reported.
Neither the exact nor an approximate number was reported in the publication. However, an approximate number could be calculated.
2.4. Rationale for the choice of the sampling stage at the slaughterhouse and sample type
When sampling at the slaughterhouse, the most commonly reported sampling stage is post‐stunning (before bleeding). Some studies still also report sampling at several other stages of the slaughter line (Broens et al., 2011; Smith et al., 2021). These studies show that batches of animals tested negative for MRSA when leaving the farm may test positive during transport, at lairage or at stunning. Sampling post‐stunning is, however, perceived as easier and furthermore, does not inflict any additional stress on the animals.
The sampling method most often used in pigs is based on collecting nasal swabs: either a single swab per individual or one to several pools of four to six swabs per herd. Ear swabs (swabbing the skin behind the ears of pigs) have also been used (Agersø et al., 2013; Stewart‐Johnson et al., 2019; Sasaki et al., 2021; Smith et al., 2021). When sampling at the slaughterhouse, the most commonly reported sample type is anterior nasal swabs. In Stewart‐Johnson et al. (2019) and Smith et al. (2021), a higher prevalence of positive samples was detected with nasal swabs, whereas Sasaki et al. (2021) detected a higher prevalence of positive samples using skin swabs. A combination of both sample types rendered the highest prevalence of positive samples in all the three studies. Still, collecting nasal swabs has been found to be more cost‐effective and also simplify the isolation phase at the laboratory.
Yet another aspect to consider when designing the sampling scheme is the number of animals per slaughter batch to be sampled as well as if and how these samples should be pooled. One study from Germany reports that all sample batches including seven or more animals were positive for MRSA (Tenhagen et al., 2009). Furthermore, of the batches with four or more animals per batch, 53 of 55 (96%) sampled batches tested positive for MRSA. In an Italian study (Battisti et al., 2010), six pools of 10 anterior nares swabs per farm from 118 holdings were analysed. In total, 45 (38.1%) of the holdings tested positive, but about half of them (22/45) had only one positive pool.
2.5. Rationale for monitoring antimicrobial susceptibility of MRSA
The monitoring of antimicrobial susceptibility patterns can be used, in conjunction with strain typing data to provide useful information on the evolution and dissemination of strains of MRSA. The antimicrobial susceptibility of MRSA isolates can provide useful information that is particularly relevant for LA‐MRSA CC398 where livestock‐associated strains are typically resistant to tetracyclines, providing one of the markers which assists in distinguishing between the livestock and human clades of CC398 (Kinross et al., 2017). Resistance to linezolid, a critically important last resort antimicrobial in human medicine, has been detected in Staphylococcus from livestock in Europe (EFSA and ECDC, 2018). Resistance to this antimicrobial may be conferred by chromosomal point mutations in 23S or by acquisition of resistance genes (cfr, optrA and poxtA), some of which also confer resistance to antimicrobials frequently used in veterinary medicine, with the consequence that use of certain veterinary medicines may co‐select for linezolid resistance. Resistance to vancomycin (another critically important antimicrobial in human medicine) has not been detected in MRSA from livestock but is included in the voluntary monitoring performed by those MSs which undertake it. The degree of resistance to those antimicrobials which are particularly important in the treatment of humans should be assessed.
3. Objectives
The first objective of this BS is to assess the prevalence of MRSA in fattening pigs in the EU and in the different EU MSs. The investigation of the BS on MRSA in pigs should target slaughtered fattening pigs; monitored through a harmonised EU‐wide baseline/cross‐sectional survey at the slaughterhouse; and should provide comprehensive, comparable and reliable information on the development and spread of MRSA in slaughtered pigs across the EU.
The second objective is to assess the genetic diversity and antimicrobial resistance of MRSA in pigs in the EU MSs by performing detailed characterisation of MRSA strains and lineages, virulence and host‐adaptation factors, and other genetic markers (e.g. phages) associated with certain animal hosts. Recent developments, including the increasing use of molecular monitoring through whole genome sequencing (WGS), are acknowledged and it is proposed to be incorporated into the BS. The detailed characterisation of isolates at the molecular level facilitates comparison of AMR in humans and animals at several levels, including the occurrence and types of resistance genes, resistance plasmids and virulence factors. The technical specifications set out proposals whereby molecular monitoring in MRSA can be implemented in the BS across MSs, while retaining comparability with the phenotypic monitoring.
4. Survey design
4.1. Definitions
The objective is to estimate two probabilities for each MS:
The prevalence π: The probability that a batch is MRSA positive; a batch is defined positive if at least one unit in the batch is positive.
The proportion of resistance p r : The probability that an MRSA isolate is resistant to a define set of tested substances.
4.2. Sampling frame
It is proposed that the BS on MRSA is based on the representative/random collection of samples from healthy fattening pig carcases at the slaughterhouse. Sampling performed at the slaughterhouse is envisaged, as in many of the MSs, it will be most cost‐effective way to collect the samples. It is recommended that at least 60% of the domestic animal population in a MS are included in the sampling frame, meaning that slaughterhouses processing at least 60% of the domestic animals of the relevant animal category (starting with the slaughterhouses of largest throughput) are eligible for sampling.
The epidemiological units defining the sampling frame are the slaughter batches of fattening pigs, defined as a group of animals of the same age raised together under the same conditions and exposed to the same risk factors regarding MRSA prevalence/AMR and sent together to the slaughterhouse at the same moment, from slaughterhouses, including slaughterhouses accounting for at least 60% of the national production in each MS.
The sampling plan should be typically stratified per slaughterhouse. The total number of slaughter batches to be randomly sampled within a particular MS (see further section on sample sizes) is proportionately allocated to the slaughterhouses (stratified sampling), using proportions reflecting the relative throughput of the different slaughterhouses. An approximately equal distribution of the sampled slaughter batches over the year enables the different seasons to be covered.
The design follows the generic proportionate stratified sampling approach already implemented for the harmonised monitoring of AMR, as presented in the technical specifications on harmonised AMR monitoring (EFSA, 2019).
4.3. Sample sizes
4.3.1. Standard calculation
The determination of the required number of slaughter batches (sample size) in an MS is based on:
The required number ni of MRSA isolates to achieve an effective estimation of the proportion of resistance p i , with preassigned level of confidence and accuracy.
An upward adjustment to obtain the required number nb of slaughter batches for the estimation of the prevalence p.
Following the technical specifications on harmonised AMR monitoring (EFSA, 2019), the required number of MRSA isolates is ni = 97,4 guaranteeing an overall accuracy of at least 0.1 with a confidence level of 0.95. The upward adjustment to obtain nb depends on the unknown prevalence π by a factor, the inverse of the prevalence 1/p (EFSA, 2019). For example, if the (unknown) prevalence was 90%, nb = 97/0.9 ≈ 108. If an initial estimate of the prevalence for a particular MS is available, this estimate can be used for the adjustment 97/, with a maximal number of batches to be sampled of 194. This number of batches is expected to lead to the required number of 97 isolates only if the estimated prevalence . Table 2 shows the required number of slaughter batches in the first row, for prevalence decreasing from 100% to 50% in steps of 10%.
Table 2.
Required number of slaughter batches (sample size). First row: required sample sizes for varying prevalence without loss adjustment (LA, see Section 4.3.2). Second row: required sample sizes for varying prevalence with loss adjustment (LA, see Section 4.3.2). Subsequent rows 3–18: required sample sizes after the finite population correction (FPC) for different population sizes (in first column) (see Section 4.3.3)
| Population size | Prevalence | ||||||
|---|---|---|---|---|---|---|---|
| = 1 | = 0.9 | = 0.8 | = 0.7 | = 0.6 | ≤ 0.5 | ||
| without LA | Inf | 97 | 108 | 122 | 139 | 162 | 194 |
| with LA | Inf | 104 | 116 | 130 | 149 | 174 | 208 |
| with FPC (a) | 100 | 51 | 54 | 57 | 60 | 64 | 68 |
| with FPC | 200 | 69 | 74 | 79 | 86 | 93 | 102 |
| with FPC | 300 | 78 | 84 | 91 | 100 | 110 | 123 |
| with FPC | 400 | 83 | 90 | 99 | 109 | 121 | 137 |
| with FPC | 500 | 87 | 94 | 104 | 115 | 129 | 147 |
| with FPC | 600 | 89 | 97 | 107 | 119 | 135 | 155 |
| with FPC | 700 | 91 | 100 | 110 | 123 | 139 | 161 |
| with FPC | 800 | 92 | 101 | 112 | 126 | 143 | 165 |
| with FPC | 900 | 94 | 103 | 114 | 128 | 146 | 169 |
| with FPC | 1,000 | 95 | 104 | 115 | 130 | 148 | 173 |
| with FPC | 2000 | 99 | 110 | 122 | 139 | 160 | 189 |
| with FPC | 3,000 | 101 | 112 | 125 | 142 | 164 | 195 |
| with FPC | 4,000 | 102 | 113 | 126 | 144 | 166 | 198 |
| with FPC | 5,000 | 102 | 113 | 127 | 145 | 168 | 200 |
| with FPC | 10,000 (b) | 103 | 115 | 129 | 147 | 171 | 204 |
LA: loss adjustment; Inf: infinitely large population size; FPC: finite population correction.
The finite population correction is applied on the original size in row 2, with loss adjustment.
For very large finite populations, the sample sizes get closer to those shown in row 2, with loss adjustment.
4.3.2. Accounting for possible missing data and loss during storage
As discussed in the technical specifications for harmonised AMR monitoring (EFSA, 2019), the required number of slaughter batches nb should be further inflated by
5% in order to take into account a 5% occurrence of missing data,
2% in order to account for loss of strains during storage.
This leads to the required number of batches
with a maximum required number of slaughter batches 194 × 1.071 ≈ 208.
Table 2 shows the required number of slaughter batches after this ‘loss adjustment’ (LA) in the second row, for prevalence decreasing from 100% to 50% in steps of 10%.
4.3.3. Finite population correction factor for small MSs
If the sample of batches with sample size nb comprises more that 5% of the total population size Nb of batches of an MS, a correction factor resulting in a downward adjustment can be applied (see Appendix I of EFSA, 2019):
For instance, if Nb = 688 (the number for Iceland as mentioned in the table of Appendix I in EFSA, 2019), the maximum required number of slaughter batches 208 is adjusted to 208 × 688/(688 + 208) ≈ 160.
The total size of the population of batches of an MS is unknown but can be determined based on the total throughput of all selected slaughterhouses (SH).
Table 2 shows the required number of slaughter batches after the loss adjustment (LA) and with the finite population correction (FPC) from the third row onwards, for a range of population sizes and for prevalence decreasing from 100% to 50% in steps of 10%. The last column of Table 2 shows the maximum required number of slaughter batches, to be achieved in case the prevalence is 50% or less, or is unknown. In case the prevalence is unknown, an MS can opt for a quarterly adjusted sequential procedure, as explained and illustrated in the next section.
4.3.4. Proportional allocation of sample size per strata and per quarter
As discussed in EFSA (2019), the number of batches to be taken from a particular SH is proportional to the throughput of that SH. Denote the fraction of throughput of an SH by ft.
The total number of batches to be collected at an SH in a year equals and thus, the number of batches to be collected per quarter should therefore equal . For instance, if and , the quarter‐based number of batches equals 4.
In case the prevalence is unknown, the required number of slaughter batches can be adjusted by a sequential quarterly procedure, based on all data from previous quarters. A quarter is referring to the point in time where 1/4 of the total required number of slaughter batches has been reached, to be expected after 3 months (if sampling is done throughout the whole period from 1 January 2023 to 31 December 2023) or after 2.5 months (if sampling starts at 1 March 2023, until 31 December 2023). Of course, the adjustment needs to be performed after each quarter and can go in both directions.
If an MS opts for this sequential procedure, it is desirable to document it by providing relevant data of the previous quarter, and a short report to EFSA with the calculations leading to the adjusted sample size. If, for any reason, the sequential procedure needs to be abandoned, the required number of slaughter batches turns back to the maximum (last column of Table 2).
Some examples of calculations are shown in Table 3.
Table 3.
Two scenarios illustrating the sequential adaptation of the required number of slaughter batches
| Example 1 | Example 2 | |
|---|---|---|
| Starting point |
Unknown prevalence finite population of size 500 required sample size for the 1st quarter equals 147/4 = 37 |
Unknown prevalence finite population of size 500 required sample size for the 1st quarter equals 147/4 = 37 |
| After 1st quarter | Prevalence estimate (based on the 37 slaughter batches of quarter 1) equals 0.70, implying that the sample size for the 2nd quarter decreases to 115/4 = 29 | Prevalence estimate (based on the 37 slaughter batches of quarter 1) equals 0.70, implying that the sample size for the 2nd quarter decreases to 115/4 = 29 |
| After 2nd quarter | Prevalence estimate (based on the 37 + 29 = 66 slaughter batches of quarter 1 and 2) equals 0.80, implying that the sample size for the 3rd quarter decreases further to 104/4 = 26 | The member state has no longer the capacity to analyse the data and estimate the prevalence based on the 37 + 29 = 66 slaughter batches of quarter 1 and 2. The sample size for the 3rd quarter increases again to that of the starting situation: 147/4 = 37 |
| After 3rd quarter | Prevalence estimate (based on the 37 + 29 + 26 = 92 slaughter batches of quarter 1 to 3) reduces again to 0.70, implying that the sample size for the 4th quarter increases again to 115/4 = 29 | The sample size for the 4th quarter remains at 147/4 = 37 |
| Total sample size | 37 + 29 + 26 + 29 = 121 instead of 147 | 37 + 29 + 37 + 37 = 140 instead of 147 |
4.3.5. Batch sensitivity (required number of units of a batch)
A batch is defined to be positive if at least one unit is positive. The probability that a truly positive batch is detected to be positive (batch sensitivity BSe) depends on the batch size M, the number of truly positive batch units D > 0, the (unit‐) test sensitivity TSe, the (unit‐) test specificity TSp, and the number m (out of M) of units tested. Following Cannon (2002),5 we assume there are no false positives (TSp very high), leading to the batch sensitivity
Setting a required batch sensitivity BSe, having a value for the test sensitivity TSe, the batch size M, and the number of truly positive units D, the required number m of units of the batch to be tested can be determined.
As an example, the analysis of an exemplary data set provided by Anses (Jouy et al., 2009) shows that batch sizes M vary in this example from 1 to 370, with median 100 (see Figure 1). About 98% of the batches has a size M larger than 25.
Figure 1.
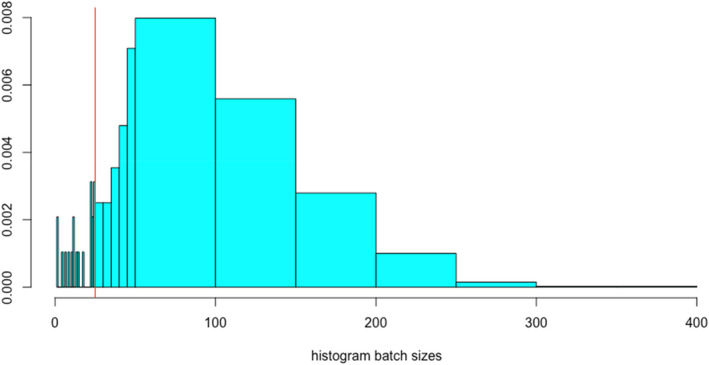
Distribution of batch sizes provided by a MS (Jouy et al., 2009)
Assume that the number D of truly MRSA‐positive pigs in the batch is 10% of the batch size M, the test sensitivity for testing an individual pig is TSe = 0.9 and that for a pooled sample, a pool test can detect one infected unit in a pool of size 5 with probability 0.80, and two or more infected animals in the pool with probability 1 (as in Section 3.2 in Cannon, 2002).
The batch sensitivity obtained when selecting 25,20,15,10,5 animals, tested individually or in 5,4,3,2,1 pools of size 5 is shown in Table 4.
Table 4.
Sensitivity of detection of MRSA in a batch of slaughter pigs characterised with a 10% contamination among the slaughter pigs of the batch when samples collected from sampled pigs are tested separately and when samples are pooled by 5 units
| # of animals selected per batch | Sensitivity of detection of MRSA at the batch level | |
|---|---|---|
| All samples tested individually | Pools of size 5 tested | |
| 25 | 0.905 | 0.878 |
| 20 | 0.848 | 0.815 |
| 15 | 0.757 | 0.718 |
| 10 | 0.611 | 0.570 |
| 5 | 0.376 | 0.344 |
With 20 animals sampled per batch, the batch sensitivity is still above 80%, and with 15 animals, the batch sensitivity is above 70%.
The required number m of randomly selected units from a batch of size M to be tested is: all units for batches up to size 20 and m = 20 for batches larger than 20, or
.
Units can be pooled in groups of at most size 5, so with a maximum of four pooled samples of 5 units.
4.4. Sampling plan
The simple and robust randomised sampling procedure currently in place for routine monitoring of AMR in bacteria from slaughter pigs, mostly relying on a stratified sampling approach with proportional allocation of the sample numbers per strata, is proposed to be applied for the MRSA BS. The general characteristics of the proportional stratified sampling approach are briefly presented in Table 5. It illustrates stratified sampling concepts, such as strata, proportional allocation, epidemiological unit, to the sampling plans proposed. Similar functional procedures as those presented in detail in Appendix J of EFSA (2019) can be applied.
Table 5.
General characteristics of the stratified sampling approach
| Sampling concept | Sampling of nasal samples at slaughter |
|---|---|
| Target populations | Domestically produced – Fattening Pigs (a) |
| Strata (1 st stage) | Slaughterhouses (b) |
| Proportional allocation | Sample size proportionate to the slaughterhouse throughput |
| 2 nd stage | Batches of fattening pig carcases originating from the same herd of pigs |
| Epidemiological Unit | Slaughter batches of fattening pigs |
| Sample/Isolate | Four pooled samples of 20 nasal swabs per epidemiological unit (c) |
NA: not applicable.
The source population of fattening pigs covers that domestically produced and slaughtered in the slaughterhouses representing at least 60% of fattening pigs slaughtered in the Member State.
Those slaughterhouses that accounted for at least 60% of all fattening pigs domestically produced in the previous years, according to the most recent statistics.
The 20 nasal swabs derive from 20 carcases per batch of carcases originating from the same herd of pigs are intended to be pooled by 5.
5. Sample collection
5.1. Type of samples and sample information
For each randomly selected epidemiological unit (slaughter batch), 20 nasal swabs (from 20 different pigs) are taken and pooled into four composite samples of five nasal swabs for further testing.
Each sample should be labelled with a unique number which should be used from sampling to testing. The use of unique numbering system is recommended.
5.2. Transport of samples
The EURL‐AR provides general recommendations on collection and storage of samples for monitoring of MRSA.6 Nasal swabs are obtained from individual slaughter pigs immediately after stunning by inserting a cotton tip into the anterior nares of each pig and rotating it five times. It is recommended to use commercially available transport swabs (which include suitable transport media) in accordance with the manufacturer's recommendations. In general, swab samples should be stored at 4–8°C, and isolation of MRSA should be initiated within seven working days of collection.
6. Laboratory analytical methods
6.1. Overview
To detect MRSA in a given sample, several successive analytical steps are needed. The first step is to isolate presumptive MRSA. Confirmation of MRSA is then obtained by polymerase chain reaction (PCR). Complementary analytical steps, antimicrobial susceptibility testing and WGS are performed to further characterise isolates.
6.2. Isolation method of MRSA
To ensure that the assessed MRSA prevalence is comparable between the MSs, the isolation procedure needs to be harmonised. The EURL‐AR has recently updated the advised protocol for isolation of MRSA from animals and the environment. 6 The EURL‐AR can be contacted for technical support. The previous technical specifications (EFSA, 2012) were based on the scientific results available at that time and recommended a two‐stage isolation method rather than that currently recommended by the EURL‐AR, which reflects recent findings and adopts a one‐stage method (Larsen et al., 2017). The one‐stage method has been shown to have increased relative sensitivity when applied to pigs (Larsen et al., 2017), though differences between the methods were not apparent in studies on cattle or poultry (Nemeghaire et al., 2013, 2014). The one‐stage method has already been adopted by several EU MSs, as shown elsewhere (EFSA, 2019), and recently confirmed by a survey performed by the EURL‐AR among NRL‐AR in spring 2022.
The EFSA WG has also assessed the relative intrinsic characteristics (sensitivity, Se and specificity, Sp) of the one‐stage (vs. two stage method) cited above when applied to pig samples and demonstrated that the one‐stage method has a higher sensitivity that the two‐stage method (0.924 vs. 0.825), while the specificity was slightly lower for the one‐stage method when compared with the two‐stage method (0.979 vs. 0.985).
The updated one‐stage method recommended by the EURL‐AR includes a pre‐enrichment step followed by incubation on a chromogenic MRSA‐selective and indicative agar plate:
Samples (i.e. pools of five nasal swabs) are covered in 10 mL of Mueller–Hinton broth containing 6.5% sodium chloride (NaCl) and incubated at 35–37°C for 16–24 h.
A 10‐μL loopful of pre‐enrichment culture is spread on a Brilliance MRSA 2 plate or an equivalent chromogenic screening plate for MRSA and incubated at 35–37°C for 16–24 h. Presumptive MRSA colonies appear as denim blue colonies after overnight incubation.
One presumptive MRSA colony from each chromogenic screening plate is then subcultured on a blood plate at 35–37°C for 24–48 h to look for characteristic morphology and haemolysis, and to perform catalase testing on doubtful isolates. MRSA colonies on blood agar are greyish or yellowish and usually surrounded by a zone of haemolysis. The catalase test can be used to distinguish staphylococci from enterococci, which sometimes produce similar colony morphology on Brilliance MRSA 2 agar.
The workflow for isolation of MRSA is illustrated in Figure 2.
Figure 2.
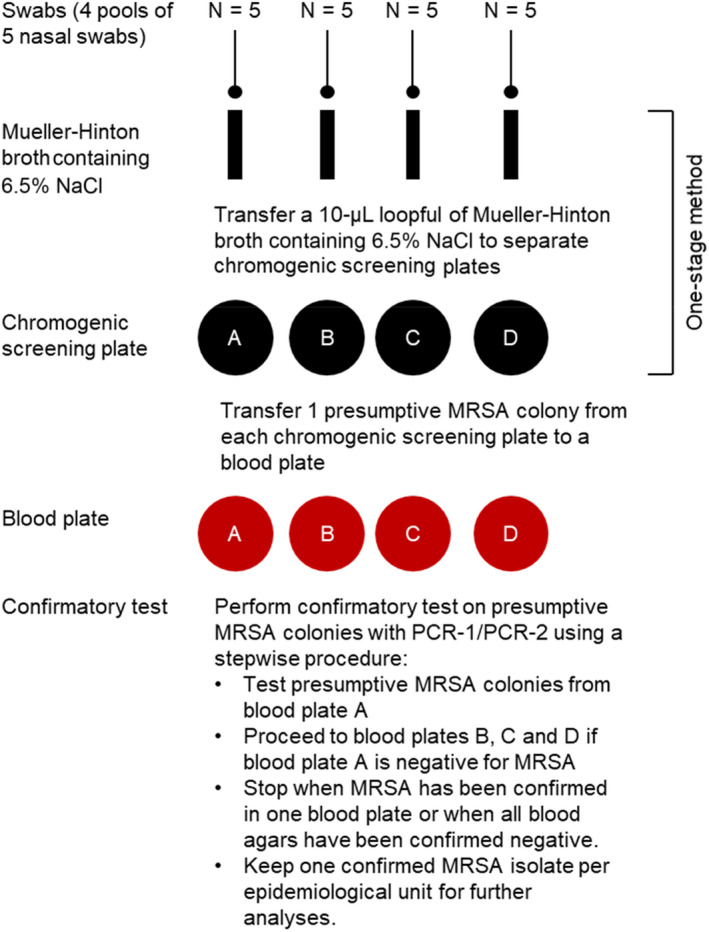
Workflow for isolation of MRSA
6.3. Confirmatory testing and typing of MRSA
The chromogenic screening plates available may produce to some extent false‐positive results, so presumptive MRSA colonies need to be confirmed by molecular testing of MRSA.
The EURL‐AR has provided protocols for DNA extraction and PCR‐based confirmation of MRSA through detection of the spa, mecA, mecC and lukF‐PV genes7 (hereafter referred to as PCR‐2) followed by spa typing of all isolates.8 Identification of the spa type can be used to assign isolates into clonal complexes (CCs).9 Isolates for which no CC can be inferred from the spa type should be subjected to multi locus sequence typing (MLST).10 It is expected that the vast majority of MRSA from pigs will be positive for the mecA and spa genes and belong to CC398.
To limit the costs of performing spa typing, presumptive MRSA isolates identified during the BS will be subjected to PCR‐1 assay developed at the National Reference Laboratory for Antimicrobial Resistance at Statens Serum Institute (SSI) in Denmark for surveillance purposes, rather than that currently recommended by the EURL‐AR, as it allows simultaneous confirmation of presumptive MRSA colonies and differentiation between S. aureus CC398 and S. aureus non‐CC398 (hereafter referred to as PCR‐1). The detailed protocol of PCR‐1 is available on the EURL‐AR homepage, and the EURL‐AR can be contacted for technical support.
The different analytical steps and corresponding methods are summarised in Figure 3.
Figure 3.
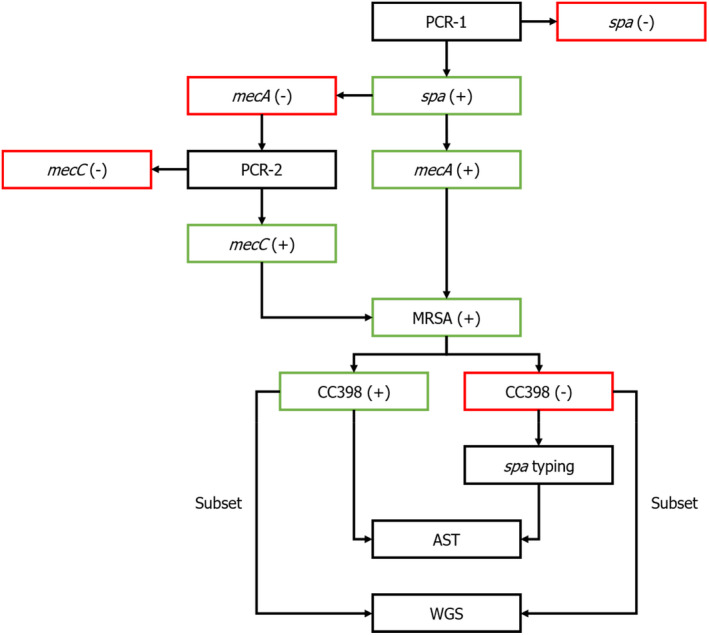
Flowchart for confirmatory testing, typing, antimicrobial susceptibility testing and whole‐genome sequencing of MRSA
- AST: antimicrobial susceptibility testing; MRSA: methicillin‐resistant Staphylococcus aureus; WGS: whole genome sequencing.
The goal is to determine the number of MRSA‐positive epidemiological units, and it is therefore sufficient to identify MRSA in one of the four blood plates from each epidemiological unit. Due to the high specificity of the one‐stage method, it is expected that most of the presumptive MRSA isolates growing on the blood plates will be confirmed as MRSA. To further limit the costs, it is therefore recommended to initially perform confirmatory tests on one of the four blood plates containing unique presumptive MRSA isolates. It is consequently only necessary to perform confirmatory tests of the remaining blood plates if the first blood plate is negative for MRSA. The protocol will therefore only lead to the isolation of one MRSA isolate per epidemiological unit and will therefore not be able to detect the occurrence of more than one MRSA variant within each epidemiological unit, but this limitation has been balanced against cost and available resources.
PCR‐1 shares the following features with the PCR‐2 (Table 6):
Table 6.
PCR assays
| Gene | Primer name | Primer sequence (5′ to 3′) | Product Size (bp) | PCR‐1 | PCR‐2 |
|---|---|---|---|---|---|
| spa | spa‐1113F | TAAAGACGATCCTTCGGTGAGC | 200–600 | + | + |
| spa‐1514R | CAGCAGTAGTGCCGTTTGCTT | + | + | ||
| mecA | mecA P4 | TCCAGATTACAACTTCACCAGG | 162 | + | + |
| mecA P7 | CCACTTCATATCTTGTAACG | + | + | ||
| lukF‐PVL | pvl‐FP | GCTGGACAAAACTTCTTGGAATAT | 85 | + | + |
| pvl‐RP | GATAGGACACCAATAAATTCTGGATTG | + | + | ||
| sau1‐hsdS1 | FP2sau1 | GAGAATGATTTTGTTTATAACCCTAG | 106 | + | − |
| CC398r1 | CAGTATAAAGAGGTGACATGACCCCT | + | − | ||
| scn | scnF1 | TACTTGCGGGAACTTTAGCAA | 130 | + | − |
| scnR1 | AATTCATTAGCTAACTTTTCGTTTTGA | + | − | ||
| mecC | mecALGA251 MultiFP | GAAAAAAAGGCTTAGAACGCCTC | 138 | − | + |
| mecALGA251 MultiRP | GAAGATCTTTTCCGTTTTCAGC | − | + |
Species identification of S. aureus by detection of the spa gene. It should be noted that the spa gene can also be present in S. argenteus and S. schweitzeri, but these species can be distinguished by their unique spa types.
Detection of the mecA gene, which is the dominant methicillin resistance determinant in MRSA from pigs.
Detection of the lukF‐PV gene, a marker of the phage‐encoded Panton–Valentine leukocidin (PVL).
In addition, PCR‐1 allows (Table 6):
Detection of the S. aureus CC398‐specific variant of the sau1‐hsdS1 genes (Stegger et al., 2011). It should be noted that the variant can also be present in S. aureus CC88, but this clone is not associated with pigs.
Detection of the scn gene, a marker of the phage‐encoded immune evasion cluster 1 (IEC1) associated with human adaptation (Sieber et al., 2020).
Isolates that are positive for the spa gene but negative for the mecA gene are subjected to PCR‐1 in order to determine the presence or absence of the mecC gene (Table 6). Isolates that are positive for the spa gene, the mecA or mecC gene and the S. aureus CC398‐specific variant of the sau1‐hsdS1 genes are designated as MRSA CC398 and subjected to antimicrobial susceptibility testing (AST). Isolates that are positive for the spa gene, the mecA or mecC gene but negative for the S. aureus CC398‐specific variant of the sau1‐hsdS1 genes are designated as MRSA and subjected to spa‐typing and AST. A subset of the MRSA CC398 and all MRSA non‐CC398 isolates will be selected based on their genetic diversity and subjected to WGS.
It is proposed that a proportion of 20% of isolates within each clone/spa type detected should be sequenced, with the additional rule that, within each clone, at least 1 isolate and a maximum of 20 isolates should be sequenced. It could also be relevant to sequence isolates that are resistant to certain antimicrobials (linezolid and vancomycin) or carry certain host‐adaptive/virulence genes (lukF‐PVL and scn). As the genetic diversity is unknown a priori, it would be desirable to take stock of the diversity after the first quarter of the survey to know more about the number of MRSA CC398 and the number of MRSA non‐CC398 of each spa types.
For those MSs performing it on a voluntary basis, an option could be to perform WGS of all presumptive MRSA isolates from the blood plates, each of which being seeded with a single colony isolated from the chromogenic screening agar for MRSA. It is believed that selection at this stage comes with a low risk of sequencing false‐positive isolates. However, the presence/absence of genes that are detected in PCR‐1 and PCR‐2 should be reported for the sake of harmonisation of data reporting.
6.4. Antimicrobial susceptibility testing
For this BS, it is proposed that MRSA isolates are susceptibility tested using micro‐dilution at least to a harmonised panel of antimicrobial substances. AST should be performed according to the EURL‐AR protocol. Broth microdilution is the recommended method and that European Committee on Antimicrobial Susceptibility Testing (EUCAST, http://www.eucast.org/) epidemiological cut‐off values (ECOFFs) should be used as interpretative criteria to define microbiological resistance (except where indicated differently). The concentration ranges to be included in the panel of antimicrobials used should ensure that both the ECOFF and the clinical breakpoints (CBPs) are included so that comparability of results with human data is made possible. It is recommended to perform phenotypic AST on all MRSA isolates, including those for which WGS is performed, since WGS may not perform well for all antibiotics (Bortolaia et al., 2020).
The 2019 EFSA technical specifications (EFSA, 2019) reviewed and revised the concentration ranges for testing the susceptibility of MRSA by broth microdilution and described a recommended set (Table 2) of antimicrobials for inclusion in the susceptibility testing panel and suggested concentration ranges to be tested.
The recommended panel includes two antimicrobial compounds used in human medicine which may be last resort compounds for the treatment of MRSA (linezolid and vancomycin). The other antimicrobials have been included based on their therapeutic applications or use in veterinary medicine, as well as because they can provide useful epidemiological information. Subsequently, a commercial microtitre plate has become available which covers the EFSA recommendation. It is proposed to use the recommended set of substances for the purpose of the BS on MRSA in pigs (Table 7).
Table 7.
Core panel of antimicrobial substances, ECOFFs, CBPs and concentration ranges (in mg/L) for S. aureus
| Antimicrobial | ECOFF 2022 | CBP 2022 | Suggested range, mg/L | Currently available plate format, mg/L (a) |
|---|---|---|---|---|
| Cefoxitin | > 4 | > 4 (b) | 0.5–16 | 0.5–16 |
| Chloramphenicol | > 16 | > 8 | 4–64 | 4–64 |
| Ciprofloxacin | > 2 | > 1 | 0.25–8 | 0.25–8 |
| Clindamycin | > 0.25 | > 0.25 | 0.12–4 | 0.12–4 |
| Erythromycin | > 1 | > 1 | 0.25–8 | 0.25–8 |
| Gentamicin | > 2 | > 2 | 0.5–16 | 0.5–16 |
| Linezolid | > 4 | > 4 | 1–8 | 1–8 |
| Mupirocin | > 1 | NA | 0.5–2 + 256 | 0.5–2 + 256 |
| Quinupristin/Dalfopristin | > 1 | > 2 | 0.5–4 | 0.5–4 |
| Sulfamethoxazole | > 128 | NA | 64–512 | 64–512 |
| Tetracycline | > 1 | > 2 | 0.5–16 | 0.5–16 |
| Tiamulin | > 2 | NA | 0.5–4 | 0.5–4 |
| Trimethoprim | > 2 | > 4 | 1–16 | 1–16 |
| Vancomycin | > 2 | > 2 | 1–8 | 1–8 |
NA: Not available; ECOFF: epidemiological cut‐off value; CBP: clinical breakpoint.
The currently commercially available plate also includes Fusidate (0.25–4), Kanamycin (4–32), Penicillin (0.06–1), Rifampin (0.015–0.5) and Streptomycin (4–32).
Not given as a clinical breakpoint by EUCAST, but rather stated that S. aureus with cefoxitin MIC values > 4 are methicillin resistant.
6.5. Whole‐genome sequencing
WGS will be performed on a subset of the MRSA CC398 and all MRSA non‐CC398 isolates, representing the geographic and genetic diversity within each country. The primary objective is to perform strain typing and to search for genetic determinants involved in AMR, host adaptation and virulence. The secondary objective is to infer the population structure and dynamics of the dominant MRSA clones. Previously, spa typing has revealed geographic clustering among MRSA CC398 isolates in Europe (EFSA, 2009 and 2010), but the small number of common spa types within CC398 and the potential for homoplasy within the spa gene limits its phylogenetic utility (Nübel et al., 2008).
The EURL‐AR has provided protocols for DNA extraction, DNA quality and quantity assessment, library preparation, library quality and quantity assessment, WGS and assembly.11 The protocols to be used specifically in the BS will be proposed by the EURL‐AR.
Quality assurance should address a number of mandatory quality checks12 (Table 8).
Table 8.
Mandatory quality checks
| Measure | Description |
|---|---|
| Mean read length | Mean value of the number of base pairs sequenced from a DNA fragment. This element contains integer. |
| Q30 rate | The percentage of bases with a quality score (a) of 30 or higher across the whole read length. This element contains decimal. |
| Total bases | Absolute number of bases sequenced. This value should be calculated after trimming. This element contains integer. |
| Assembly coverage | Average of number of nucleotide bases sequence aligned to a specific locus in a reference genome. This should be calculated after mapping the sequencing raw reads against the assembly. This element contains decimal. |
| Assembly N50 | The sequence length of the shortest contig at 50% of the total genome length. This element contains integer. |
| Assembly total length | Absolute number of bases in the assembly. This element contains integer. |
| Assembly Number of contigs | Number of contigs of the assembly. Contigs are continuous stretches of sequence containing bases without gaps. This element contains integer. |
A quality score is an estimate of the probability of a base being called wrongly by the sequencer and it is calculated as: q = −10 × log10(p).
In addition, species validation and check for contamination should be performed to verify that the FASTQ files contain sequences from a single species and that the species is equal to the one indicated by the user. Assigned reads to an unexpected organism should be less than 5%.
The bioinformatics tools and settings used to obtain mandatory quality check measures and perform species validation and check for contamination, and the accompanying results, should be provided.
6.6. Bioinformatics analysis
Bioinformatics analyses include determining a number of mandatory genotypic characteristics such as multi‐locus sequence typing (MLST), staphylococcus cassette chromosome mec (SCCmec) typing, detection of AMR genes and point mutations and detection of other genes associated with host adaptation and virulence (Table 9).
Table 9.
Mandatory genotypic characteristics
| Measure | Description | Tool (a) /database (b) | Settings (c) |
|---|---|---|---|
| MLST | – | MLST | |
| mec class | – | SCCmecFinder |
%ID: 90% Min. length: 60% Database: Referenced |
| ccr type(s) | – | ||
| SCCmec type | – | ||
| SCCmec subtype | – | ||
| AMR genes | – | ResFinder 4.1 or newer |
%ID: 90% Min. length: 60% |
| AMR point mutations | – | ||
| czrC | Cadmium and zinc resistance | MyDbFinder |
%ID: 90% Min. length: 60% |
| scn | Staphylococcal complement inhibitor (SCIN) | ||
| chp | Chemotaxis inhibitory protein of S. aureus (CHIPS) | ||
| sak | Staphylokinase (SAK) | ||
| sea | Staphylococcal enterotoxin A (SEA) | ||
| sep | Staphylococcal enterotoxin P (SEP) | ||
| IEC1 | Prophage‐borne immune evasion cluster encoding SCIN (genetic marker of IEC1) and different combinations of CHIPS, SAK, SEA and SEP (genetic marker of human adaptation) | ||
| IEC1 type | A schematic representation of the different IEC1 types are provided by van Wamel et al. (2006) | ||
| tarP | Prophage‐encoded wall teichoic acid glycosyltransferase (TarP) | ||
| vwb SaPI | Staphylococcal pathogenicity island (SaPI)‐encoded von Willebrand factor‐binding protein (genetic marker of ruminant adaptation | ||
| lukS‐PV | Prophage‐encoded Panton–Valentine leukocidin (PVL) | ||
| lukF‐PV | Prophage‐encoded Panton–Valentine leukocidin (PVL) | ||
| seb | Staphylococcal enterotoxin B (SEB) | ||
| sec | Staphylococcal enterotoxin C (SEC) | ||
| tsst | Staphylococcal pathogenicity island (SaPI)‐encoded toxic shock syndrome toxin 1 (TSST‐1) |
Tools recommended by the EURL‐AR are available from the CGE website (https://cge.cbs.dtu.dk/services/).
Links to tools and predefined databases will be made available on the EURL‐AR homepage.
To ensure harmonised monitoring, it is important to use predefined databases and settings.
The bioinformatics tools, settings and the type of sequence used to obtain mandatory genotypic characteristics, and the accompanying results, should be provided.
6.7. Storage of strains
Isolates verified as MRSA should be saved and stored under conditions not allowing changes in their properties at −80°C at least for 5 years. This is to allow, for instance, later testing for antimicrobial susceptibility or other types of characterisations if requested by the EFSA or for research or other purposes at a national or European level. Isolates sent to the EURL‐AR will also be stored for a minimum of 5 years.
7. Data reporting from the EU MSs/participating countries to EFSA
7.1. Overall description on the implementation of the survey
Three sets of data will be reported to cover all information collected during sampling and analysis:
Prevalence sample‐based: Detailed analytical results of all samples taken (positive and negative) reported using the EFSA standard for reporting laboratory results: Standard Sample Description version 2 (SSD2).
AMR isolate‐based: Isolate‐level quantitative antimicrobial resistance and WGS data reported according to the antimicrobial resistance (AMR) data model of EFSA.
Population data: Annual throughput of slaughterhouses involved in the survey and pig population size of the farms of origin.
The laboratory isolate code will be used to link the data reported in the prevalence sample‐based (SSD2) data model with those reported in the AMR isolate‐based data model. The slaughterhouse identification code and the holding identification code will be used to link the analytical results of sampled to population data.
Potential slight alterations to the data reporting model may still occur while implementing it at EFSA and they will be communicated to the reporting countries considering the appropriate time for implementing them.
7.2. Data to be reported
7.2.1. Prevalence sample‐based
The EU MSs/participating countries can use the SSD2 data model to report sample‐based zoonoses and zoonotic agent data to the Data Collection Framework (DCF) of EFSA. Specific guidance to report information under the framework of Directive 2003/99/EC, Regulation (EU) 2017/625, Commission Implementing Regulation (EU) 2019/627 and of Commission Delegated Regulation (EU) 2018/772 is published annually by EFSA (EFSA, 2022a). Analytical results for MRSA samples can already be reported to the DCF following the instructions provided there. However, some additional information will be requested in the context of the BS (Table 10).
Table 10.
SSD2 data model for reporting data on prevalence of zoonotic agents, adapted for the needs of the MRSA BS
| Data element | Description | Constraint | Data type | Catalogue/hierarchy | Default value |
|---|---|---|---|---|---|
| sampStrategy | Underlying strategy of selecting samples from the population | Mandatory | xs:string (5) | SAMPSTR/zooSampstr | ST10A (Objective sampling) |
| progType | Type of programme | Mandatory | xs:string (5) | PRGTYP/zooSampContext | K027A (EU baseline survey) |
| sampMethod | Sampling method | Mandatory | xs:string (5) | SAMPMD | N002A (Pooled/batch) |
| sampler | Type of organisation performing the sampling | Mandatory | xs:string (5) | SAMPLR | CX02A (Official sampling) |
| sampPoint | Point in the food chain where the sample was taken | Mandatory | xs:string (5) | SAMPNT/zooss | E311A (Slaughterhouse) |
| sampEventId | Sampling event identification code, in this case referring to the identification code of the sampled slaughter batch | Mandatory | xs:string (100) | – | – |
| sampUnitType | Sampling unit | Mandatory | xs:string (5) | SAMPUNTYP | G200A (Slaughter batch) |
| sampUnitSize | Size of the sampling unit, i.e. in this case the number of animals of the sampled slaughter batch | Mandatory | xs:double | – | – |
| sampUnitSizeUnit | Unit of measurement of the size of the sampling unit | Mandatory | xs:string (5) | UNIT | G199A (Animal) |
| sampUnitIds.batchId | Slaughter batch identification code. For the data reported in the context of the BS, the sampling unit is always the batch and, therefore, for each record, the value reported here should be equal to the value reported in sampEventId. | Mandatory | xs:string (250) | – | – |
| sampUnitIds.slaughterHouseId | Slaughterhouse identification code | Mandatory | xs:string (250) | – | – |
| sampUnitIds.sampHoldingId | Sampling holding identification code | Optional | xs:string (250) | – | – |
| sampEventInfo.durationTransport | Duration of transportation before arrival of the slaughter batch to the slaughterhouse | Optional | xs:double | – | – |
| sampEventInfo.durationLairage | Duration of lairage | Optional | xs:double | – | – |
| sampEventInfo.washingLairage | Misting of the sampled slaughter batch during lairage | Optional | xs:string (1) | YESNO | – |
| sampEventInfo.stunningMethod | Method of stunning of the sampled slaughter batch | Optional | xs:string | Potential values: electrical, carbon dioxide, other | – |
| sampEventInfo.prevSlaughteredBatches | Number of batches slaughtered on the same day before the sampled slaughter batch | Optional | xs:integer | – | – |
| sampId | Identification code of the collected sample | Mandatory | xs:string (100) | – | – |
| repCountry | Reporting country | Mandatory | xs:string (2) | COUNTRY/ EUSRrepCountry | – |
| sampCountry | Country of sampling | Mandatory | xs:string (2) | COUNTRY | – |
| sampArea | Area of sampling | Optional | xs:string (5) | Nuts Gaul/ nuts2021 | – |
| repYear | Reporting year (i.e. year for which the data are reported) | Mandatory | xs:integer (4) | – | 2023 |
| sampY | Year of sampling | Mandatory | xs:integer (4) | – | 2023 |
| sampM | Month of sampling | Mandatory | xs:integer (2) | – | – |
| sampD | Day of sampling | Mandatory | xs:integer (2) | – | – |
| sampSize | Size of sample taken, i.e. in this case, the number of swabs taken from different animals and pooled together in the same pooled sample | Mandatory | xs:double | – | – |
| sampSizeUnit | Sample taken size unit | Mandatory | xs:string (5) | UNIT | G199A (Animal) |
| sampMatType | Type of matrix | Mandatory | xs:string (5) | MTXTYP | S000A (Animal sample) |
| sampMatCode.base | Matrix of the sample taken | Mandatory | xs:string (5) | MTX | A0C9Y (Fattening pigs) |
| sampMatCode.part | Matrix part | Mandatory | xs:string (5) | MTX | A16HC (Nasal swab) |
| sampMatCode.prod | Organic or conventional production | Optional | xs:string (5) | MTX | – |
| origCountry | Country of origin of the sample taken | Mandatory | xs:string (2) | COUNTRY | – |
| origArea | Area of origin of the sample taken | Optional | xs:string (5) | Nuts Gaul/ nuts2021 | – |
| analysisY | Year of the individual analysis performed in the laboratory | Mandatory | xs:integer (4) | – | – |
| analysisM | Month of the individual analysis performed in the laboratory | Mandatory | xs:integer (2) | – | – |
| analysisD | Day of the individual analysis performed in the laboratory | Mandatory | xs:integer (2) | – | – |
| anPortSeq | The sequence of the portion of the sample analysed. Different portions of the same analysed with different methods sampled can be differentiated using a sequence of numbers (e.g. 1, 2, 3, etc.). (a) | Mandatory | xs:string (100) | – | – |
| labId | Laboratory identification code | Mandatory | xs:string (50) | – | – |
| paramType | Type of parameter | Mandatory | xs:string (5) | PARAMTYP | P001A (Individual) |
| paramCode, base | Coded description of the parameter | Mandatory | xs:string (15) | PARAM | RF‐00003853‐MCG (MRSA) |
| paramCode.t | spa‐type | Dependent | xs:integer | – | – |
| paramCode.st | Multi locus sequence | Dependent | xs:integer | – | – |
| paramCode.cc | Clonal complex | Dependent | xs:integer | – | – |
| paramCode.genes | Reporting the genes identified by the PCR tests | Dependent | xs:string | – | – |
| anMethRefCode | Analytical method reference code | Mandatory | xs:string (5) | ANLYREFMD | R049A (EURL method) |
| anMethType | Type of analytical method type | Mandatory | xs:string (5) | ANLYTYP | AT01A (Detection) |
| anMethCode | Analytical method | Mandatory | xs:string (5) | ANLYMD | – |
| resId | Unique identification code of the analytical result | Mandatory | xs:string (100) | – | – |
| resQualValue | Result qualitative value | Mandatory | xs:string (3) | POSNEG | – |
| resType | Type of result | Mandatory | xs:string (3) | VALTYP | BIN |
| isolId | Identification code of the isolate | Dependent | xs:string (100) | – | – |
| evalLimitType | Type of limit for the result evaluation | Mandatory | xs:string (5) | LMTTYP | W012A (Presence) |
| evalCode | Evaluation of the result | Mandatory | xs:string (5) | RESEVAL | – |
| evalInfo.sampTkAsses | Sample taken assessment, containing the final assessment of the sample, i.e. ‘Satisfactory’ if no MRSA was detected in the pooled sampled or ‘Unsatisfactory’ if MRSA was detected in the pooled sample. | Mandatory | xs:string (5) | RESEVAL | – |
| evalInfo.sampEventAsses | Sampling event assessment, containing the final assessment at the level of the sampling unit, which in this case is the slaughter batch, i.e. ‘Satisfactory’ if no MRSA was detected in any pooled sample of the slaughter batch or ‘Unsatisfactory’ if MRSA was detected in at least one pooled sample of the slaughter batch. | Mandatory | xs:string (5) | RESEVAL | – |
For a positive sample, anPortSeq should have different values for the first isolation test of presumptive MRSA and for all the subsequent tests. For example, the anPortSeq for the screening test can be equal to 1 and for the first PCR can be equal to 2. This data element is required in such cases for technical reason and EFSA is investigating the possibility of generating its values automatically.
The full list of data elements relevant for the MRSA BS is presented below together with the default (fixed) value to be used in the context of the BS, where applicable. The detailed description of all the data elements can be found in the latest prevalence sample‐based guidance (EFSA, 2022a).
The sampling unit for the BS is the slaughter batch, and therefore, all elements at the sampling unit level (e.g. sampEventId) refer to a slaughter batch sampled at a given time in a given slaughterhouse. The data will be reported at the level of the individual analytical results, e.g. if one pooled sample undergoes only one test for screening in the laboratory, one line will be reported for this sample, but if the screening test is positive and the samples undergo further testing, one additional line will be reported for each additional test. As a result, several lines will be reported per slaughter batch (at least one line per pooled sample) and possibly several lines will be reported per pooled sample. In this context, each analytical results can be reported with the exact date on which it was performed.13
7.2.2. AMR isolate‐based data
MSs can use the AMR data model to report isolate‐level quantitative antimicrobial resistance and WGS data to the DCF of EFSA. Guidance to report such data under the framework of Directive 2003/99/EC and Commission Implementing Decision 2020/1729/EC is published annually (EFSA, 2021). Isolate‐level quantitative antimicrobial resistance results for MRSA samples can already be reported to the DCF following the instructions provided there. In the context of the BS, the data model will be extended to receive WGS results of MRSA isolates.
The full list of data elements is presented below together with the default (fixed) value to be used in the context of the BS, where applicable (Table 11). The detailed description of all the data elements can be found in the latest guidance (EFSA, 2021).
Table 11.
EFSA data model for isolate‐based antimicrobial resistance data reporting
| Data element | Description | Constraint | Data type | Catalogue/hierarchy | Default value |
|---|---|---|---|---|---|
| resultCode | Unique result identifier | Mandatory | xs:string(100) | – | – |
| repYear | Reporting year | Mandatory | xs:integer(4) | – | – |
| repCountry | Reporting country | Mandatory | xs:string(2) | COUNTRY | – |
| zoonosis | Zoonotic agent | Mandatory | xs:string(4000) | PARAM/serovaramr | MRSA + Info about MLST, CC, spa |
| zoonosis.t | Spa type | Dependent | xs:integer | ||
| zoonosis.st | Multi locus sequence | Dependent | xs:integer | ||
| zoonosis.cc | Clonal complex | Dependent | xs:integer | ||
| matrix | Matrix from which the tested isolate derives | Mandatory | xs:string(4000) | ZOO_CAT_MATRIX | A006701A (Fattening pigs) |
| totUnitsTested | Total number of epidemiological units of interest (i.e. in this case slaughter batch) investigated in the context of the BS, i.e. it should be the total number of batches sampled for the BS. | Mandatory | xs:integer(10) | – | – |
| totUnitsPositive | Total number of epidemiological units of interest (i.e. in this case slaughter batch) investigated in the context of the BS and tested positive for MRSA. | Mandatory | xs:integer(10) | – | – |
| sampUnitType | Type of sampling unit | Mandatory | xs:string(5) | UNIT | G200A (Slaughter batch) |
| sampStage | Stage along the food chain at which the sample has been collected | Mandatory | xs:string(5) | SAMPNT | E311A (Slaughterhouse) |
| sampOrig | Country of origin of the sample | Mandatory | xs:string(2) | COUNTRY | – |
| sampType | Matrix part | Mandatory | xs:string(5) | ZOO_CAT_SMPTYP | S015A (nasal swab) |
| sampContext | Type of programme in the framework of which the sample was collected | Mandatory | xs:string(5) | PRGTYP | K027A (EU BS) |
| sampler | Type of organisation performing the sampling | Mandatory | xs:string(5) | SMPLR | CX02A (Official sampling) |
| progCode | Basis of the programme in the framework of which the sample/isolate has been collected/analysed | Mandatory | xs:string(7) | AMRPROG | AMR MON |
| progSampStrategy | Underlying strategy of selecting samples from the population | Mandatory | xs:string(5) | SAMPSTR | ST10A (Objective sampling) |
| labCode | Laboratory identification code | Mandatory | xs:string(100) | – | – |
| labIsolCode | Identification code of the isolate | Mandatory | xs:string(20) | – | – |
| sampY | Year of sampling | Mandatory | xs:integer(4) | – | – |
| sampM | Month of sampling | Mandatory | xs:integer(2) | – | – |
| sampD | Day of sampling | Mandatory | xs:integer(2) | – | – |
| isolY | Year of isolation | Mandatory | xs:integer(4) | – | – |
| isolM | Month of isolation | Mandatory | xs:integer(2) | – | – |
| isolD | Day of isolation | Mandatory | xs:integer(2) | – | – |
| analysisY | Year of susceptibility test | Dependent | xs:integer(4) | – | – |
| analysisM | Month of susceptibility test | Dependent | xs:integer(2) | – | – |
| analysisD | Day of susceptibility test | Dependent | xs:integer(2) | – | – |
| seqY | Year of sequencing | Dependent | xs:integer(4) | – | – |
| seqM | Month of sequencing | Dependent | xs:integer(2) | – | – |
| seqD | Day of sequencing | Dependent | xs:integer(2) | – | – |
| anMethCode | Method used for AMR testing | Mandatory | xs:string(5) | ANLYMD/amram | – |
| substance | Antimicrobial substance against which the isolate was tested | Dependent | xs:string(15) | PARAM/AMRsub | – |
| cutoffValue | Cut‐off value for the dilution method | Dependent | xs:double | – | |
| lowest | The lowest concentration of the concentration range used to test AMR in the laboratory | Dependent | xs:string(5) | ZOO_CAT_FIXMEAS/ number | – |
| highest | The highest concentration of the concentration range used to test AMR in the laboratory | Dependent | xs:string(5) | ZOO_CAT_FIXMEAS/ number | – |
| MIC | The MIC value (by default reported in mg/L) resulting from the susceptibility testing of the isolate in question | Dependent | xs:string(5) | ZOO_CAT_FIXMEAS/ mic | – |
| Genotype | Reporting the genes identified by the WGS tests included in Table 5 | Dependent | xs:string(100) | PARAM | – |
| perCC | Performed CC MRSA characterisation | Mandatory | xs:string(1) | YESNO | – |
| perMLST | Performed MLST MRSA characterisation | Mandatory | xs:string(1) | YESNO | – |
| seqTech | Instrument used for sequencing | Dependent | xs:string(8) | INSTRUM | – |
7.2.3. Population data
To improve the analysis that will be performed with the BS data, MSs are requested to provide information about the pig population in the involved slaughterhouses and in the farms of origin of the sampled slaughter batches. In particular, they should report the annual throughput of each slaughterhouse and the number of pigs in each farm of origin following the data model in the table below. This data model described below (Table 12) is a simplified version of a data model developed by EFSA to report animal population at the establishment level (EFSA, 2022b).
Table 12.
Data model to report population of animals in the farm of origin and annual slaughterhouse throughput
| Data element | Description | Constraint | Data type | Controlled terminology |
|---|---|---|---|---|
| recordId | Unique identifier of the record | Mandatory | xs:string(100) | – |
| recordCensusY | Year of extraction of census data | Mandatory | xs:integer(4) | – |
| recordCensusM | Month of extraction of census data | Mandatory | xs:integer(2) | – |
| recordCensusD | Day of extraction of census data | Mandatory | xs:integer(2) | – |
| estabId | Identification code of the slaughterhouse or the farm. The ‘establishment’ describes any premises, structure, or, in the case of open‐air farming, any environment or place, where animals or germinal products are kept, on a temporary or permanent basis, except for households (where pet animals are kept) and veterinary practices or clinics. This information is protected by the EU General Data Protection Regulation (EU GDPR). | Mandatory | xs:string(200) | – |
| estabType | Type of establishment | Mandatory | xs:string(5) | E311A (Slaughterhouse) OR E101A (Farm) |
| estabArea | Area of the establishment | Optional | xs:string(5) | Nuts Gaul |
| subUnitId | Identification code of the subunit of the slaughterhouse or the farm (or repeating estabId). The ‘subunit’ is the smallest management group of animals of the same species, sharing the same geographical location and the same rearing purpose in the context of a given establishment. This information is protected by the EU General Data Protection Regulation (EU GDPR). | Mandatory | xs:string(200) | – |
| subUnitSpecies | Subunit species | Mandatory | xs:string(5) | A0C9Y (Fattening pigs) |
| subUnitPurpType | Type of farm (e.g. farrow‐to‐finish, weaner‐to‐finish, finisher) | Mandatory for farms, not applicable for slaughterhouses | xs:string(5) | MTX |
| subUnitCapacity | Theoretical capacity of the farm. It refers to the number of registered fattening places. The information is mandatory for the farms and not applicable for the slaughterhouses. | Mandatory for farms, not applicable for slaughterhouses | xs:integer(9) | – |
| subUnitActualNumber | Actual number of animals in each subunit. In the case of farms, it refers to the number of animals at a given point in time, i.e. a snapshot of the pig population at the farm level close to the time of sampling. In the case of slaughterhouses, it refers to the annual throughput expressed in tonnes of carcase equivalent during the calendar year. | Mandatory | xs:integer(9) | – |
| subUnitArea | Area of the subunit | Optional | xs:string(5) | Nuts Gaul |
8. Analytical approach to data
8.1. Data validation
The submitted data will be checked to ensure that the mandatory elements are completed, the correct data type is used and for compliance with the controlled terminologies. A set of data validation criteria will be set up to identify and exclude non‐valid, non‐consistent and non‐plausible data in the MRSA data set submitted by the MSs to EFSA. The MSs will be given the opportunity to consider and correct data not fulfilling the data validation criteria. A report listing the identified errors will be sent to the data providers with advice on required modifications. The data providers must resubmit the data until the data set passes the validation checks and is considered as valid. The validated data sets at the level of batches of slaughtered pigs will be used to perform the phylogenetic analyses and assess MRSA prevalence.
8.2. Sample summary statistics and protocol‐sample comparison
Descriptive analysis of all data collected will be carried out, considering simple statistics, such as proportions, means, standard deviations, frequency tables and graphs in order to provide a general overview of the data submitted. A comparison between the BS protocol and the collected sample, notably in terms of sample size, stratification by slaughterhouse, stratification by month and time elapsed between sampling and testing, will be carried out using frequency tables and graphs.
8.3. Assessment of the observed prevalence of MRSA
A batch of slaughtered pigs will be considered positive if MRSA is detected in any of the four pooled samples of five nasal swabs, and negative otherwise. The prevalence of certain lineages of MRSA of particular public health interest may be specifically assessed.
The prevalence of batches of slaughtered pigs will be estimated for each MS through the slaughter batch positivity ratio (proportion of tested positive slaughter batches out of the total number of slaughter batches tested). Within each MS, the slaughterhouses will be considered as strata, for which the proportion of sampled batches of slaughtered pigs is not constant across slaughterhouses. The MRSA prevalence will be assessed by accounting for unequal sampling fractions among the slaughterhouses. At the EU level, the prevalence is going to be assessed while considering MSs as strata and accounting for unequal sampling fractions among MSs. Point estimates of the observed MRSA prevalence at the MS and EU level will be complemented with 95% confidence interval estimates.
Factors considered to be potentially related to the sensitivity positivity of the testing slaughtered batches and to have a potential impact on the probability of the detection of MRSA isolates in samples will be accounted for in the prevalence analysis investigated. To investigate such potential impact, logistic models predicting batch positivity as a function of country and those factors will be fitted. In the case of impact, the estimated prevalence figures will be adjusted by further logistic regression analyses.
Abbreviations
- AMR
antimicrobial resistance
- AST
antimicrobial Susceptibility Testing
- BS
baseline surveys
- BSe
batch sensitivity
- CBP
clinical breakpoint
- CC
clonal complex
- dCF
data collection framework
- ECOFF
epidemiological cut‐off value
- EURL‐AR
EU Reference Laboratory for Antimicrobial Resistance
- MIC
minimum inhibitory concentration
- MLST
multi locus sequence typing
- MRSA
methicillin‐resistant Staphylococcus aureus
- MS
EU Member States
- PCR
polymerase chain reaction
- SH
slaughterhouse
- SSD2
standard sample description version 2
- SSI
statens Serum Institute
- TSe
test sensitivity
- TSp
test specificity
- WGS
whole genome sequencing
Annex A – Protocol for designing technical specifications for a baseline survey on MRSA in pigs
Annex A can be found in the online version of this output (‘Supporting information’ section of the online version of this scientific report).
Supporting information
Protocol for designing technical specifications for a baseline survey on MRSA in pigs
Suggested citation: EFSA (European Food Safety Authority) , Aerts M, Battisti A, Hendriksen R, Larsen J, Nilsson O, Cortiñas Abrahantes J, Guerra B, Papanikolaou A and Beloeil P‐A, 2022. Technical specifications for a baseline survey on the prevalence of Methicillin Resistant Staphylococcus aureus (MRSA) in pigs. EFSA Journal 2022;20(10):7620, 33 pp. 10.2903/j.efsa.2022.7620
Requestor: European Commission
Question number: EFSA‐Q‐2022‐00213
Declarations of interest: If you wish to access the declaration of interests of any expert contributing to an EFSA scientific assessment, please contact interestmanagement@efsa.europa.eu.
Acknowledgements: EFSA wishes to thank Raquel Costa for the support provided to this scientific output. EFSA wishes to acknowledge Member State bodies and other organisations that provided data and comments for this scientific output.
Approved: 29 September 2022
Annex A is available under the Supporting Information section
This article was originally published on the EFSA website www.efsa.europa.eu on 17 October 2022 as part of EFSA's publication procedures.
Notes
EFSA (European Food Safety Authority), Aerts M, Battisti A, Hendriksen R, Kempf I, Teale C, Tenhagen B‐A, Veldman K, Wasyl D, Guerra B, Liebana E, Thomas‐Lopez D and Belœil P‐A, 2019. Scientific report on the technical specifications on harmonised monitoring of antimicrobial resistance in zoonotic and indicator bacteria from food‐producing animals and food. EFSA Journal 2019;17(6):5709, 122 pp. https://doi.org/10.2903/j.efsa.2019.5709
Commission Implementing Decision (EU) 2020/1729 of 17 November 2020 on the monitoring and reporting of antimicrobial resistance in zoonotic and commensal bacteria and repealing Implementing Decision 2013/652/EU. OJ L 387, 19 November 2020, pp. 8–21.
Commission Decision 2008/55/EC of 20 December 2007 concerning a financial contribution from the Community towards a survey on the prevalence of Salmonella spp. and Methicillin‐resistant Staphylococcus aureus in herds of breeding pigs to be carried out in the Member States. OJ L 14, 17.1.2008, p. 10–25.
For comparison, the R command (package MKpower)
ssize.propCI(prop = 0.5, width = a*2, conf.level = 0.95, method = ‘wald‐cc’)$n
with unknown proportion taken as 0.5 (worst case, leading to largest required sample size) and confidence level 0.95, leads to a required sample size of 106 for an accuracy of a = 0.10. Using method = ‘jeffreys’, the required sample size is 96.
Cannon RM. Demonstrating disease freedom‐combining confidence levels. Prev Vet Med. 2002 Jan 22;52(3–4):227–249. https://doi.org/10.1016/s0167‐5,877(01)00262‐8. PMID: 11849719.
Spa typing is primarily relevant for assigning S. aureus isolates into putative CCs based on previous knowledge on spa type/CC associations. As PCR‐2 includes a marker for CC398, there is no need to perform spa typing on these isolates (see also Section 6.5).
https://www.eurl-ar.eu/CustomerData/Files/Folders/21-protocols/284_8-protocols-for-mlst-typing.pdf
For example, if the first isolation test of presumptive MRSA is performed on 19 September 2023 and the first PCR is performed on 23 September 2023, two separate lines will be reported with the two different analysis dates.
References
- Agersø Y, Vigre H, Cavaco L and Josefsen M, 2013. Comparison of air samples, nasal swabs, ear‐skin swabs and environmental dust samples for detection of methicillin‐resistant Staphylococcus aureus (MRSA) in pig herds. Epidemiology and infection, 142, 1–10. 10.1017/S095026881300280X [DOI] [PMC free article] [PubMed] [Google Scholar]
- Bangerter PD, Sidler X, Perreten V and Overesch G, 2016. Longitudinal study on the colonisation and transmission of methicillin‐resistant Staphylococcus aureus in pig farms. Veterinary Microbiology, 183, 125–134. [DOI] [PubMed] [Google Scholar]
- Battisti A, Franco A, Merialdi G, Hasman H, Iurescia M, Lorenzetti R, Feltrin F, Zini M and Aarestrup FM, 2010. Heterogeneity among methicillin‐resistant Staphylococcus aureus from Italian pig finishing holdings. Veterinary Microbiology, 142, 361–366. [DOI] [PubMed] [Google Scholar]
- Beneke B, Klees S, Stührenberg B, Fetsch A, Kraushaar B and Tenhagen BA, 2011. Prevalence of methicillin‐resistant Staphylococcus aureus in a fresh meat pork production chain. Journal of Food Protection, 74, 126–129. 10.4315/0362-028X.JFP-10-250 [DOI] [PubMed] [Google Scholar]
- Bortolaia V, Kaas RS, Ruppe E, Roberts MC, Schwarz S, Cattoir V, Philippon A, Allesoe RL, Rebelo AR, Ferrer Florensa A, Fagelhauer L, Chakraborty T, Neumann B, Werner G, Bender JK, Stingl K, Nguyen M, Coppens J, Britto Xavier B, Malhotra‐Kumar S, Westh H, Pinholt M, Anjum MF, Duggett NA, Kempf I, Nykäsenoja S, Olkkola S, Wieczorek K, Amaro A, Clemente L, Mossong J, Losch S, Ragimbeau C, Lund O and Aarestrup FM, 2020. ResFinder 4.0 for predictions of phenotypes from genotypes. Journal of Antimicrobial Chemotherapy, 75, 3491–3500. 10.1093/jac/dkaa345 [DOI] [PMC free article] [PubMed] [Google Scholar]
- Broens EM, Graat EA, Van der Wolf PJ, Van de Giessen AW and De Jong MC, 2011. Transmission of methicillin resistant Staphylococcus aureus among pigs during transportation from farm to abattoir. Veterinary Journal, 189, 302–305. [DOI] [PubMed] [Google Scholar]
- de Neeling AJ, van den Broek MJM, Spalburg EC, van Santen‐Verheuvel MG, Dam‐Deisz WDC, Boshuizen HC, van de Giessen AW, van Duijkeren E and Huijsdens XW, 2007. High prevalence of methicillin resistant Staphylococcus aureus in pigs. Veterinary Microbiology, 122(3–4), 366–372. [DOI] [PubMed] [Google Scholar]
- Dierikx CM, Hengeveld PD, Veldman KT, de Haan A, van der Voorde S, Dop PY, Bosch T and van Duijkeren E, 2016. Ten years later: still a high prevalence of MRSA in slaughter pigs despite a significant reduction in antimicrobial usage in pigs The Netherlands. Journal of Antimicrobial Chemotherapy, 71(9), 2414–2418. [DOI] [PubMed] [Google Scholar]
- EFSA (European Food Safety Authority) , 2009a. Analysis of the baseline survey on the prevalence of methicillin‐resistant Staphylococcus aureus (MRSA) in holdings with breeding pigs, in the EU, 2008, Part A: MRSA prevalence estimates; on request from the European Commission. EFSA Journal 2009;7(11):1376, 82 pp. 10.2903/j.efsa.2009.1376 [DOI] [Google Scholar]
- EFSA (European Food Safety Authority) , 2009b. Analysis of the baseline survey on the prevalence of methicillin‐resistant Staphylococcus aureus (MRSA) in holdings with breeding pigs, in the EU, 2008, Part B: factors associated with MRSA contamination of holdings; on request from the European Commission. EFSA Journal 2010;8(6):1597, 10.2903/j.efsa.2010.1597 [DOI] [Google Scholar]
- EFSA (European Food Safety Authority) , 2012. Technical specifications on the harmonised monitoring and reporting of antimicrobial resistance in methicillin‐resistant Staphylococcus aureus in food‐producing animals and food. EFSA Journal 2012;10(10):2897, 56 pp. 10.2903/j.efsa.2012.2897 [DOI] [Google Scholar]
- EFSA (European Food Safety Authority) , Aerts M, Battisti A, Hendriksen R, Kempf I, Teale C (from March 2018 to March 2019), Tenhagen BA, Veldman K, Wasyl D, Guerra B, Liebana E, Thomas‐López D and Beloeil PA, 2019. Scientific report on the technical specifications on harmonised monitoring of antimicrobial resistance in zoonotic and indicator bacteria from food‐producing animals and food. EFSA Journal 2019;17(5):5709, 124 pp. 10.2903/j.efsa.2019.5709 [DOI] [PMC free article] [PubMed] [Google Scholar]
- EFSA (European Food Safety Authority) , Amore G, Beloeil P‐A, Bocca V, Garcia Fierro R, Gibin D, Guerra Roman B, Papanikolaou A, Rizzi V and Stoicescu A‐V, 2021. Antimicrobial resistance guidance for 2021 data reporting. EFSA supporting publication 2021:EN‐6653. 46 pp. 10.2903/sp.efsa.2021.EN-6653 [DOI] [Google Scholar]
- EFSA (European Food Safety Authority) , Boelaert F, Gibin D, Papanikolaou A, Rizzi V and Stoicescu A‐V, 2022a. Prevalence sample‐based guidance for reporting 2021 data. EFSA supporting publication 2022:EN‐7129. 46 pp. 10.2903/sp.efsa.2022.EN-7129 [DOI] [Google Scholar]
- EFSA (European Food Safety Authority) , Aminalragia‐Giamini R, Dhollander S, Gibin D, Mur L, Papanikolaou A and Zancanaro G, 2022b. Guidance for reporting at the SIGMA animal population data model. EFSA supporting publication 2022:EN‐7568, 23 pp. 10.2903/sp.efsa.2022.EN-7568 [DOI] [Google Scholar]
- EFSA and ECDC (European Food Safety Authority and European Centre for Disease Prevention and Control) , 2018. The European Union summary report on antimicrobial resistance in zoonotic and indicator bacteria from humans, animals and food in 2016. EFSA Journal 2018;16(2):5182, 270 pp. 10.2903/j.efsa.2018.5182 [DOI] [PMC free article] [PubMed] [Google Scholar]
- EFSA BIOHAZ Panel (EFSA Panel on Biological Hazards) , Koutsoumanis K, Allende A, Alvarez‐Ordóñez A, Bolton D, Bover‐Cid S, Chemaly M, Davies R, De Cesare A, Herman L, Hilbert F, Lindqvist R, Nauta M, Ru G, Simmons M, Skandamis P, Suffredini E, Argüello‐Rodríguez H, Dohmen W, Magistrali CF, Padalino B, Tenhagen B‐A, Threlfall J, García Fierro R, Guerra B, Liébana E, Stella P and Peixe P, in press. Scientific opinion on the transmission of antimicrobial resistance (AMR) during animal transport. EFSA Journal 2022;20(11):7586, 10.2903/j.efsa.2022.7586 [DOI] [PMC free article] [PubMed] [Google Scholar]
- Horgan M, Abbott Y, Lawlor PG, Rossney A, Coffey A, Fitzgerald GF, McAuliffe O and Paul Ross R, 2011. A study of the prevalence of methicillin‐resistant Staphylococcus aureus in pigs and in personnel involved in the pig industry in Ireland. Veterinary Journal, 190, 255–259. [DOI] [PubMed] [Google Scholar]
- Jouy E, Granier SA, Ruimy R, Felix B, Le Roux A, Pecorella E, Tocqueville V, Kempf I, Sanders P, Andremont A, Brisabois A and Chauvin C, 2009. Methicillin Resistant Staphylococcus aureus (MRSA) in French slaughtered pigs. ASM‐ESCMID Conference on Methicillin‐resistant Staphylococci in Animals. September 22–25, London, England.
- Kinross P, Petersen A, Skov R, Van Hauwermeiren E, Pantosti A, Laurent F, Voss A, Kluytmans J, Struelens MJ, Heuer O, Monnet DL and the European human LA‐MRSA study group , 2017. Livestock‐associated meticillin‐resistant Staphylococcus aureus (MRSA) among human MRSA isolates, European Union/European Economic Area countries, 2013. Eurosurveillance, 22. 10.2807/1560-7917 [DOI] [PMC free article] [PubMed] [Google Scholar]
- Larsen J, Sunde M, Islam MZ, Urdahl AM, Barstad AS, Larsen AR, Grøntvedt CA and Angen Ø, 2017. Evaluation of a widely used culture‐based method for detection of livestock‐associated meticillin‐resistant Staphylococcus aureus (MRSA), Denmark and Norway, 2014 to 2016. Euro Surveillance, 22, 30573. 10.2807/1560-7917.ES.2017.22.28.30573 [DOI] [PMC free article] [PubMed] [Google Scholar]
- Nemeghaire S, Roelandt S, Argudín MA, Haesebrouck F and Butaye P, 2013. Characterization of methicillin‐resistant Staphylococcus aureus from healthy carrier chickens. Avian Pathology, 42, 342–346. 10.1080/03079457.2013.805183 [DOI] [PubMed] [Google Scholar]
- Nemeghaire S, Argudin MA, Haesebrouck F and Butaye P, 2014. Epidemiology and molecular characterization of methicillin‐resistant Staphylococcus aureus nasal carriage isolates from bovines. BMC Veterinary Research, 10, 153. 10.1186/1746-6148-10-153 [DOI] [PMC free article] [PubMed] [Google Scholar]
- Normanno G, Dambrosio A, Lorusso V, Samoilis G, Di Taranto P and Parisi A, 2015. Methicillin‐resistant Staphylococcus aureus (MRSA) in slaughtered pigs and abattoir workers in Italy. Food Microbiol, 51, 51–56. 10.1016/j.fm.2015.04.007 [DOI] [PubMed] [Google Scholar]
- Nübel U, Roumagnac P, Feldkamp M, Song J‐H, Soo Ko K, Huang Y‐C, Coombs G, Ip M, Westh H, Skov R, Struelens MJ, Goering RV, Strommenger B, Weller A, Witte W and Achtman M, 2008. Frequent emergence and limited geographic dispersal of methicillin‐resistant Staphylococcus aureus . Proceedings of the National Academy of Sciences of the United States of America, 105, 14130–14135. 10.1073/pnas.0804178105 Epub 2008 Sep 4. [DOI] [PMC free article] [PubMed] [Google Scholar]
- Sasaki Y, Sakurada H, Yamanaka M, Nara K, Tanaka S, Uema M, Ishii Y, Tamura Y and Asai T, 2021. Effectiveness of ear skin swabs for monitoring methicillin‐resistant Staphylococcus aureus ST398 in pigs at abattoirs. The Journal of Veterinary Medical Science, 83, 112–115. 10.1292/jvms.20-0592 [DOI] [PMC free article] [PubMed] [Google Scholar]
- Sieber RN, Urth TR, Petersen A, Møller CH, Price LB, Skov RL, Larsen AR, Stegger M and Larsen J, 2020. Phage‐Mediated Immune Evasion and Transmission of Livestock‐Associated Methicillin‐Resistant Staphylococcus aureus in Humans. Emerging Infectious Diseases, 26, 2578–2785. 10.3201/eid2611.201442 [DOI] [PMC free article] [PubMed] [Google Scholar]
- Slifierz MJ, Friendship RM and Weese JS, 2015. Methicillin‐resistant Staphylococcus aureus in commercial swine herds is associated with disinfectant and zinc usage. Applied and Environmental Microbiology, 81, 2690–2695. [DOI] [PMC free article] [PubMed] [Google Scholar]
- Smith RP, Sharma M, Gilson D, Anjum M and Teale CJ, 2021. Livestock‐associated methicillin‐resistant Staphylococcus aureus in slaughtered pigs in England. Epidemiol and Infection, 149, e236. 10.1017/S0950268821002260 [DOI] [Google Scholar]
- Stegger M, Andersen PS, Kearns A, Pichon B, Holmes MA, Edwards G, Laurent F, Teale C, Skov R and Larsen AR, 2011. Rapid detection, differentiation and typing of methicillin‐resistant Staphylococcus aureus harbouring either mecA or the new mecA homologue mecALGA251 . Clinical Microbiology and Infection, 49, 732–734. [DOI] [PubMed] [Google Scholar]
- Stewart‐Johnson A, Dziva F, Abdela W, Rahaman S and Adesiyun A, 2019. Prevalence of methicillin resistant Staphylococcus aureus (MRSA) in pigs and workers at abattoirs in Trinidad and Tobago. Journal of Infection in Developing Countries, 13, 400–409. 10.3855/jidc.10552 [DOI] [PubMed] [Google Scholar]
- Tenhagen B‐A, Fetsch A, Stührenberg B, Schleuter G, Guerra B, Hammerl J, Hertwig S, Kowall J, Kämpe U, Schroeter A, Bräunig J, Käsbohrer A and Appel B, 2009. Prevalence of MRSA types in slaughter pigs in different German abattoirs. The Veterinary Record, 165, 589–593. 10.1136/vr.165.20.589 [DOI] [PubMed] [Google Scholar]
- van Wamel WJB, Rooijakkers SHM, Ruyken M, van Kessel KPM and van Strijp JAG, 2006. The innate immune modulators staphylococcal complement inhibitor and chemotaxis inhibitory protein of Staphylococcus aureus are located on beta‐hemolysin‐converting bacteriophages. Journal of Bacteriology, 188, 1310–1315. 10.1128/JB.188.4.1310-1315.2006 [DOI] [PMC free article] [PubMed] [Google Scholar]
Associated Data
This section collects any data citations, data availability statements, or supplementary materials included in this article.
Supplementary Materials
Protocol for designing technical specifications for a baseline survey on MRSA in pigs