Abstract
Since the emergence of the novel coronavirus in December 2019, it has rapidly swept across the globe, with a huge impact on daily life, public health and the economy around the world. There is an urgent necessary for a rapid and economical detection method for the Covid-19. In this study, we used the transformers-based deep learning method to analyze the chest X-rays of normal, Covid-19 and viral pneumonia patients. Covid-Vision-Transformers (CovidViT) is proposed to detect Covid-19 cases through X-ray images. CovidViT is based on transformers block with the self-attention mechanism. In order to demonstrate its superiority, this research is also compared with other popular deep learning models, and the experimental result shows CovidViT outperforms other deep learning models and achieves 98.0% accuracy on test set, which means that the proposed model is excellent in Covid-19 detection. Besides, an online system for quick Covid-19 diagnosis is built on http://yanghang.site/covid19.
Keywords: Deep learning, Covid-19, Self-attention, Transformers
Introduction
2019 novel coronavirus, on January 12, 2020, the World Health Organization (WHO) officially named it 2019-nCoV (Covid-19). Coronaviruses are a large group of viruses known to cause colds and more serious diseases, such as Middle East Respiratory Syndrome (MERS) and Severe Acute Respiratory Syndrome (SARS) [1]. The Covid-19 is a new type of coronavirus that has never been found in humans before. Covid-19 is an acute respiratory infection caused by a viral infection. The main symptoms of patients are fever, dry cough, fatigue, etc. Severe infections usually develop breathing difficulties after 7 days. In severe cases, it can rapidly develop into acute respiratory distress syndrome, coagulation dysfunction and multiple organ failure. More serious cases may be life-threatening [2].
The Covid-19 quickly swept the world due to its high infectivity and stealth. The popular detection method is reverse transcription polymerase chain reaction (RT-PCR), which is relatively expensive and time-consuming. Due to the low sensitivity of RT-PCR by 60–70%, RT-PCR may produce preliminary false negative results [3], promoting multiple RT-PCR tests to ensure the veracity of the results.
Radiological examination has become more important in the early diagnosis and evaluation of the disease course [4]. Despite X-ray images are cost-friendly, the difficulty of diagnosing Covid-19 from X-ray images makes it difficult to become a popular Covid-19 detection method.
With the development of deep learning, it has been widely applied in many fields, including the medical fields [5]. The stress of doctors will be extremely relieved with the help of deep learning. Convolutional neural network (CNN) is the mainstream deep learning model in the field of computer vision (CV), so many researchers employ it to diagnose Covid-19 through X-ray images. Ozturk [6] presented DarkCovidNet which achieved 87.02% accuracy, Dosovitskiy [7] implemented VGG-19 to diagnose Covid-19 and improved the accuracy to 93.48%, Al-Falluji [8] proposed the deep learning model based on ResNet-18, and it gained 96.73% accuracy.
However, besides the CNN, there is a new deep learning model based on the transformers architecture in the field of computer vision. At present, no researchers have carried out research on the transformers-based model in the diagnosis of Covid-19.
Transformers architecture was proposed by Google in 2017 [9], by introducing the self-attention mechanism into encoder and decoder, making it perform better than the traditional recurrent neural network (RNN) in machine translation. Many academics are attempting to apply transformers in CV applications due to the excellent performance in natural language processing (NLP). Dosovitskiy et al. [10] proposed vision transformers (ViT) which can be used in computer vision tasks. ViT is based on transformers architecture. It is worth emphasizing that ViT converts an image matrix to several vectors, allowing image data to be available for the self-attention mechanism.
In this paper, Covid-vision-transformers (CovidViT) model is proposed to detect Covid-19 with X-ray images. CovidViT is a model which has the self-attention mechanism and transformers architecture based on ViT. To the best of our knowledge, it is the first attempt that transformers architecture and self-attention mechanism are applied to Covid-19 detection.
Since CNN is still the mainstream in the field of CV, in order to illustrate the performance of our model, it is necessary to compare with several of the most popular convolutional neural networks, so we choose the VGG19 [7], ResNet50 [12], AlexNet [13] and designed CovidVGG, Single-CNN and Double-CNN as baseline models of CNN.
The contributions of this paper are as follows:
CovidViT: We propose CovidViT for Covid-19 detection, and apply the transformers architecture and self-attention mechanism to Covid-19 diagnosis for the first time.
We prove that the transformers-based model has the ability to surpass CNN in the diagnosis of Covid-19.
We employ all the outputs of transformers encoder to achieve a better result, while the original ViT only uses the first output of transformers encoder.
Online diagnostic system: An online system for quick Covid-19 diagnosis is built ( http://yanghang.site/covid19), and the diagnostic results are available to anyone without any specialized knowledge.
This paper is structured as follows. The method and materials are given in Sect. 2. Section 3 presents the experimental results and discussion. Finally, the conclusion is concluded in Sect. 4.
Materials and methods
Dataset description
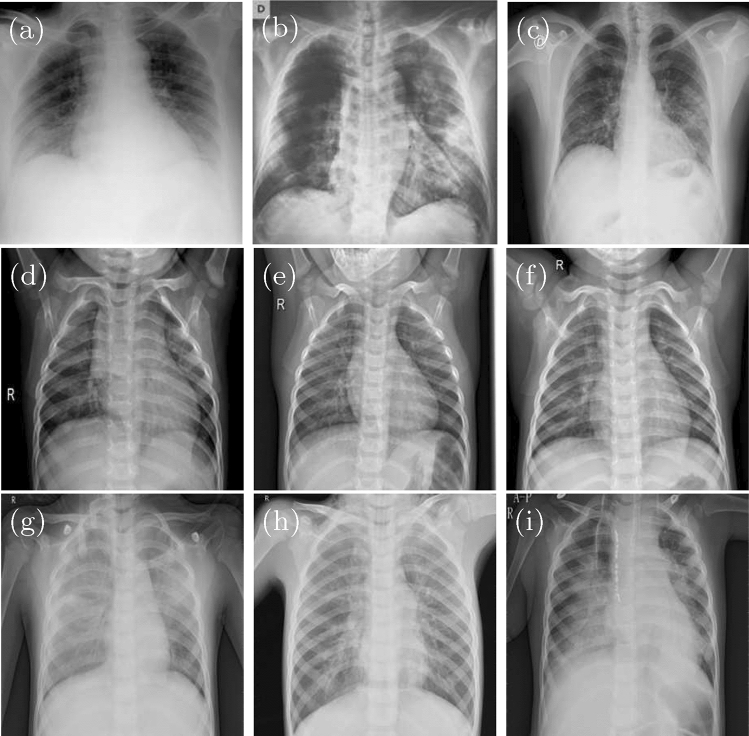
This dataset consists of 7 different datasets with a total of 15,153 X-ray images, and the details are shown as Table 1. An example image is shown as Fig. 1.
Table 1.
The detail of dataset used in this study
| Dataset | Category | Number and source |
|---|---|---|
| D1 | Covid-19 | 2473 |
| https://bimcv.cipf.es/bimcv-projects/bimcv-covid19/#1590858128006-9e640421-6711 | ||
| D2 | Covid-19 | 183 |
| https://github.com/ml-workgroup/covid-19-image-repository/tree/master/png | ||
| D3 | Covid-19 | 559 |
| https://sirm.org/category/senza-categoria/covid-19/ | ||
| https://github.com/ieee8023/covid-chestxray-dataset | ||
| https://doi.org/10.6084/m9.figshare.12580328 | ||
| https://eurorad.org | ||
| D4 | Covid-19 | 400 |
| https://github.com/armiro/COVID-CXNet | ||
| D5 | Normal | 8851 |
| https://www.kaggle.com/c/rsna-pneumonia-detection-challenge/data | ||
| D6 | Normal | 1341 |
| https://www.kaggle.com/paultimothymooney/chest-xray-pneumonia | ||
| D7 | Viral Pneumonia | 1345 |
| https://www.kaggle.com/paultimothymooney/chest-xray-pneumonia | ||
| Total | Covid-19 | 3616 |
| Normal | 10,192 | |
| Viral Pneumonia | 1345 |
Fig. 1.
Some image samples from dataset, Covid-19 (a–c), normal (d–f), and viral pneumonia (g–i)
Dataset preprocessing
There are two main steps for preprocessing, i.e., resize and split.
Resize: The original images have the fixed shape (channels = 1, height = 299, width = 299). Since the ViT-B-16 is pre-trained on ImageNet-21k with shape (3, 224, 224), all images have been resized to (1, 224, 224) first for convolutional neural networks, then broadcast the image on the first dim to 3, resulting the input shape of CovidViT being (3, 224, 224).
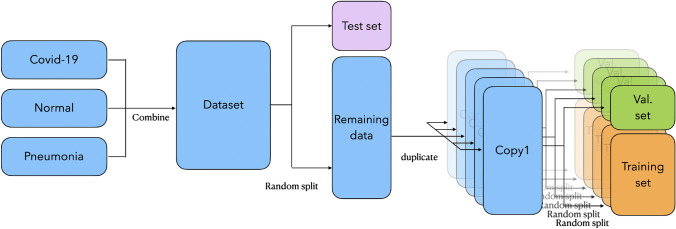
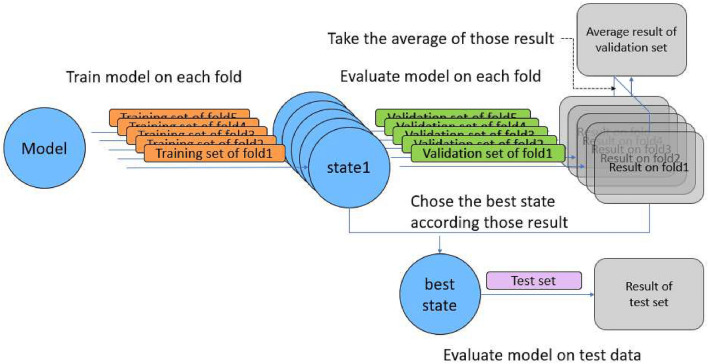
Split: First, the dataset has been randomly split into a test set with 1515 images and the remaining data with 13,638 images. Second, to reduce the impact of randomness on the results, we duplicate the remaining data into 5 copies, and then randomly split each copy into a validation set with 1515 images and a training set with 12,123 images. 5 replicas will generate 5 different validation sets and training sets, corresponding to folds 1–5. This process is shown as Fig. 2.
Fig. 2.
The preprocessing of datasets
Model’s architecture
Covid vision transformers (CovidViT)
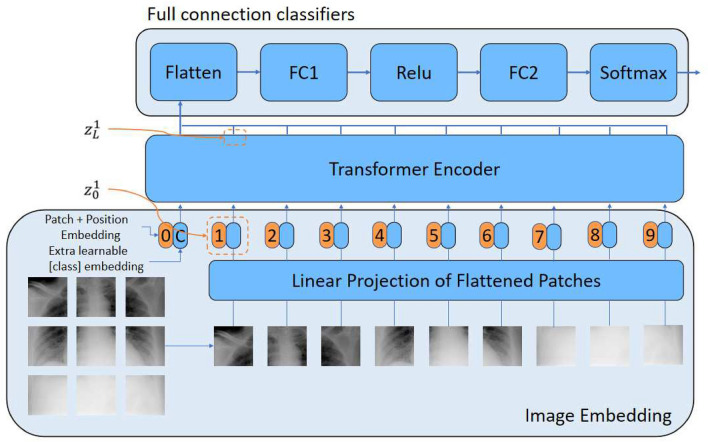
CovidViT is constructed based on ViT, and it has three basic parts, i.e., image embedding, transformers encoder and full connection classifier. The overview of CovidViT is shown in Fig. 3. Image embedding converts images to vector sequence, transformers encoder extracts the features of input vector sequence, and the full connection classifier (FCC) gives the final result according to the features.
Fig. 3.
CovidViT overview
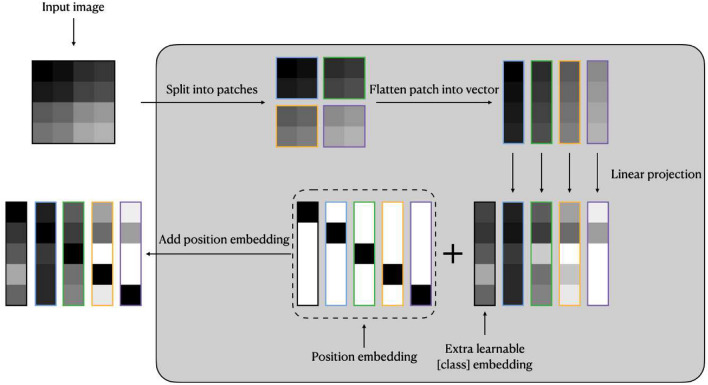
Image embedding: Given an image , image embedding first splits x into N patches , where , (H, W) is the resolution of the original image, C is the number of channels, (P, P) is the resolution of each image patch, and is the resulting number of patches.
Then flatten each image patch into image vector and multiply each with the learnable matrix .
Final step is to concatenate [class] token , a learnable embedding, with the image vectors, and plus the fixed position embedding .
The formula of image embedding can be represented as Eqs. 1 and 2, an overview of image embedding is shown as Fig. 4
| 1 |
| 2 |
where , represents the i-th row and j-th column of the matrix
Fig. 4.
Image embedding overview (in this case )
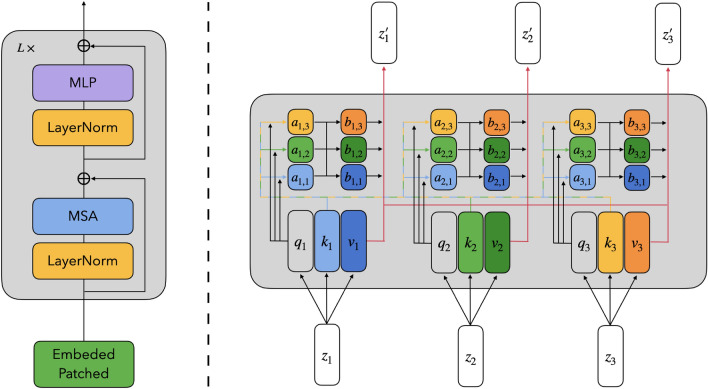
Transformers encoder: Transformers encoder is composed of a stack of identical layers. Each layer includes 2 sub-layers, multi-head self-attention layer (MSA) and multilayer Perception layer (MLP). Layer norm (LN) is applied before each sub-layer, and a residual connection after every sub-layer, the architecture of transformers encoder and self-attention block is shown as Fig. 5.
Fig. 5.
Transformers encoder (left) and self-attention block (right)
Self-attention (SA): For each vector in , we first compute the query (), key () and value () vectors according to Eqs. 3–5. Then we compute the attention weight by query and key vectors according to Eqs. 6 and 7. Finally, the i-th output of self-attention layer is gained by computing a weighted sum over all value vectors according to the attention weight , shown as Eq. 8.
| 3 |
| 4 |
| 5 |
| 6 |
| 7 |
| 8 |
where .
Multihead self-attention is an extension of self-attention in which we run h SA operations, and concatenate their outputs, then project them into the same dimension with Z (Eq. 9).
| 9 |
where .
MLP is applied to each vector separately and identically. This consists of two linear transformations with a GELU activation among them (Eqs. 10–12):
| 10 |
where X is a random variable obeying a Gaussian distribution. In practical, we use the following approximate function,
| 11 |
| 12 |
Now the formulas of transformers encoder can be represented as Eqs. 13 and 14, respectively. The overview of multi-head self-attention is shown as Fig. 6.
| 13 |
| 14 |
where .
Fig. 6.
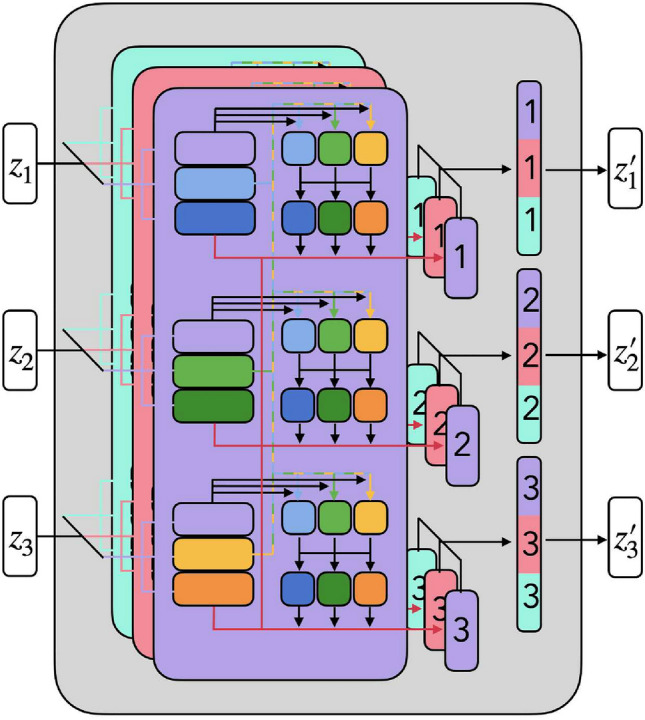
An overview of multi-head self-attention
FCC: FCC contains 2 full connection layers FC1 and FC2. FC1 is followed by a Relu activation function and FC2 is followed by a Softmax activation function. All the vectors from transformers encoder will be flattened into one vector, and then applied by FC1 and FC2. Relu and Softmax activation layers can be represented as Eqs. 15 and 16. The formulas of FCC is shown as Eqs. 17–19:
| 15 |
| 16 |
| 17 |
| 18 |
| 19 |
In the original ViT model, [class] token () state at the output of the transformers encoder () serves as the image representation. Both during pre-training and fine-tuning, a full connection classifier is attached to . So the of Eq. 17 in the original ViT should be .
However, in our CovidViT, we use not only the first output of the last transformers encoder , but also all the outputs attaching to FCC. We found it can achieve a better result compared to only using as input of FCC (OriginalViT).
In this paper, pre-trained model ViT-B-16 [16, 17] was chosen as the first two parts of CovidViT.
Popular CNNs
CNNs have made tremendous achievements in CV in the past few years, therefore it is easy to think that CNN can be used to detect Covid-19 by X-ray images. In addition, many researchers have shown that CNNs have excellent performance in the detection of Covid-19 [6–8, 14, 15, 22–30].
Besides, Santosh et al. [31] had systematically reviewed 58 research articles with search keywords: (Covid-19 OR Coronavirus) AND chest x-ray AND deep learning AND artificial intelligence AND medical imaging. Almost all used CNN as their base model.
In order to demonstrate our transformers-based CovidViT is capable of Covid-19 detection, we obviously have to compare our model with CNN which is the mainstream method in Covid-19 detection, therefore several popular CNNs were applied to handle this task. VGG19 [11], ResNet50 [12], AlexNet [13], truncated inception net (TIN) [33] and DNN [27] were implemented as baselines in this study.
Designed CNNs
In addition to the popular CNNs, we also design CovidVGG based on the idea of VGG, and in order to figure out what a very simple neural network will perform in this task, single-layer and double-layer convolutional networks (Single-CNN, Double-CNN) were applied in this task. The architecture of those models are shown as Tables 2, 3 and 4. Additionally, all convolutional layers in CovidVGG, Single-CNN and Double-CNN shared the same configuration of kernel size 3 and stride 2 as well as Relu activation function and same padding.
Table 2.
The architecture of Single-CNN
| Layer name | Layer parameter | Output shape |
|---|---|---|
| Conv | Filters num: 32 | (224, 224, 32) |
| Max pool | (112, 112, 32) | |
| Full connect | Activate: Softmax | (3) |
Table 3.
The architecture of Double-CNN
| Layer name | Layer parameter | Output shape |
|---|---|---|
| Conv | Filters num: 32 | (224, 224, 32) |
| Max pool | (112, 112, 32) | |
| Conv | Filters num: 32 | (112, 112, 32) |
| Max pool | (56, 56, 32) | |
| Full connect | Activate: Softmax | (3) |
Table 4.
The architecture of CovidVGG
| Layer name | Layer parameter | Output shape |
|---|---|---|
| Conv | Filters num: 16 | (224, 224, 16) |
| Conv | Filters num: 16 | (224, 224, 16) |
| Max pool | (112, 112, 16) | |
| Conv | Filters num: 32 | (112, 112, 32) |
| Conv | Filters num: 32 | (112, 112, 32) |
| Max pool | (56, 56, 32) | |
| Conv | Filters num: 64 | (56, 56, 64) |
| Conv | Filters num: 64 | (56, 56, 64) |
| Max pool | (28, 28, 64) | |
| Conv | Filters num: 128 | (28, 28, 128) |
| Conv | Filters num: 128 | (28, 28, 128) |
| Max pool | (14, 14, 128) | |
| Conv | Filters num: 256 | (14, 14, 256) |
| Conv | Filters num: 256 | (14, 14, 256) |
| Max pool | (7, 7, 256) | |
| Full connect | Activate: Relu | (1024) |
| Full connect | Activate: Relu | (512) |
| Full connect | Activate: Softmax | (3) |
Evaluation criteria
Confusion matrix, Accuracy (Acc), Recall (Rec), Precision (Prec), score () and the area under the receiver operating characteristic curve (AUC) are several evaluation criteria taken in this study. Normally, most of those criteria are employed to evaluate binary classification. In order to apply them into our models, all criteria are implemented with macro-averaging, i.e., taking all classes as equally important.
Confusion matrix is an important indicator to evaluate the accuracy of credit scoring model [18]. The horizontal axis represents the predicted label, the vertical axis represents the true label, and the number of diagonal blocks represents the number of correctly classified examples. TN, TP, FN and FP are some terms in the confusion matrix and will be used to calculate other standards. TN represents a true negative number, TP represents a true positive number, FN represents a false negative number, and FP represents a false positive number.
Accuracy: It is a most common criterion to evaluate the performance of models, which represents the ratio of right classification number to data size (Eq. 20):
| 20 |
Recall: It represents the ratio of TP to TP plus FN (Eq. 21):
| 21 |
Precision: It represents the ratio of TP to TP plus FP (Eq. 22):
| 22 |
score: It is the harmonic average of precision and recall. If we need to find a balance between precision and recall and there is an uneven class distribution, i.e., a large number of actual negative numbers, then score is very suitable (Eq. 23):
| 23 |
Receiver operating characteristic (ROC): It is a widely accepted method for comparing and analyzing the diagnostic accuracy of radiological tests [19]. The ROC curve is given by plotting the true positive rate (TPR) and false positive rate (FPR) under different threshold settings. TPR is also called recall rate in machine learning. FPR is also called false alarm probability. The equations of TPR and FPR are shown as Eqs. 24 and 25.
| 24 |
| 25 |
AUC: It is the area under the receiver operating characteristic curve, the value of AUC is from 0 to 1. 1 is a prefect classifier, and 0.5 is a random classifier.
Result and discussion
Experimental setup
The number of parameters in all models is shown in Table 5. Adam is an algorithm for the first-order gradient-based optimization of stochastic objective functions, and empirical results show that Adam performs well in practice and compares favorably to other stochastic optimization methods [32]. In addition, many researchers [23, 25] chose Adam as their optimizer in Covid-19 detection. Therefore Adam was chosen as optimizer and the learning rate was set to 0.001. Meanwhile, the batch size was set to 16 for all CNNs, 8 for OriginalViT and CovidViT due to memory limitations. All models have been trained for 50 epochs on training data of each fold. Therefore, we have 5 different states (from state-1 to state-5) and match 5 different folds (from fold-1 to fold-5) for each model. Then we took the average of those results as the final results on 5-fold validation data. The state which has the best result of validation will be evaluated on test set for each model, and this result is recorded. The whole process is shown as Fig. 7. Training process was implemented on NVIDIA GTX 2080 with 8 GB GPU memory.
Table 5.
Number of parameters in eight models
| Model | Number of parameters |
|---|---|
| CovidVGG | 7.6M |
| VGG19 | 139.7M |
| ResNet50 | 23.5M |
| AlexNet | 7.3M |
| Single-CNN | 1.2M |
| Double-CNN | 0.3M |
| TIN | 2.1M |
| DNN | 3.0M |
| OriginalViT | 86.8M |
| CovidViT | 202.6M |
Represents our proposed models
Fig. 7.
The process of training and evaluation
Comparison of different models from confusion matrix
The confusion matrices of all deep models are shown in Fig. 8. There is no doubt that CovidViT has the best performance in the diagnosis of Covid-19, most CNNs only have less than 93% probability to diagnose Covid-19 patients on both validation and test set. But this number of CovidViT is 96.8% on validation set and 97.31% on test set. In terms of Covid-19 detection rate, original ViT is even better than CovidViT on the test set, but the slight improvement in return of a huge error rate on normal and viral pneumonia cases.
Fig. 8.
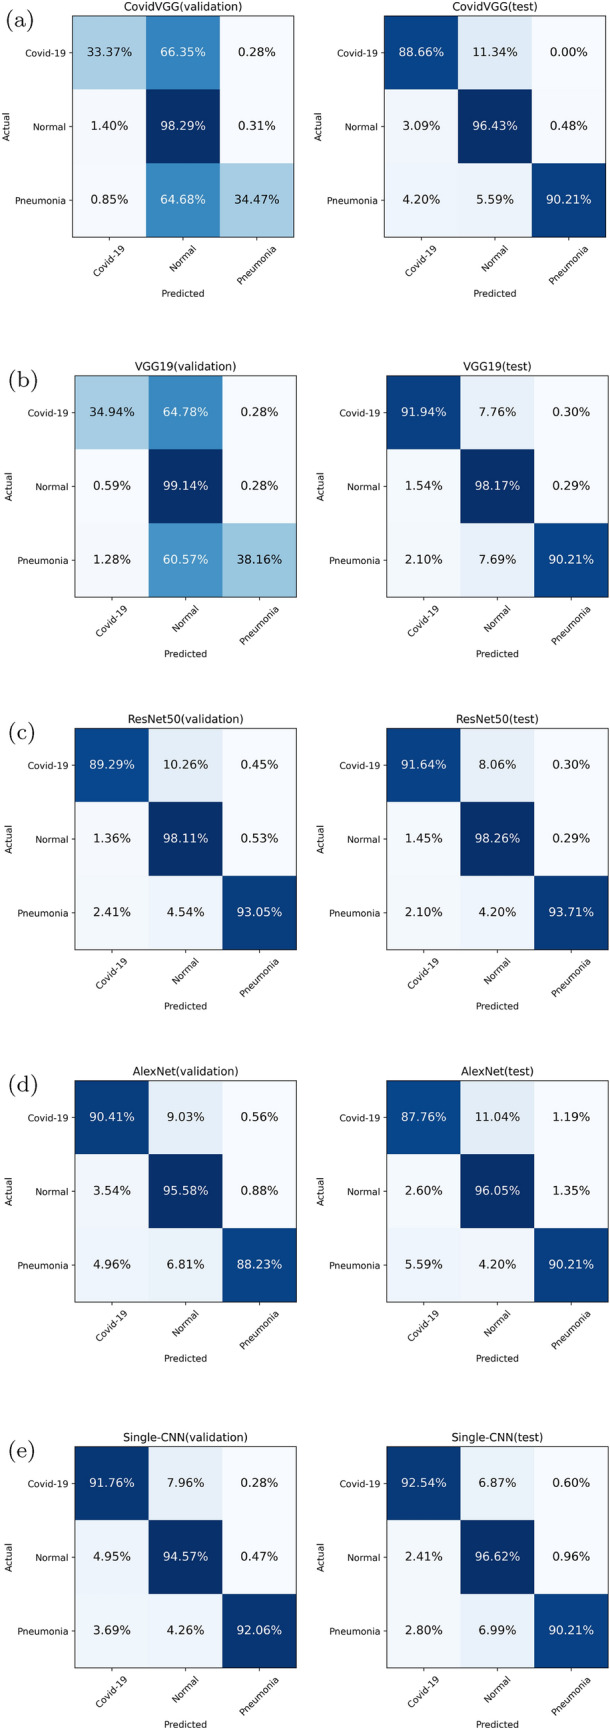
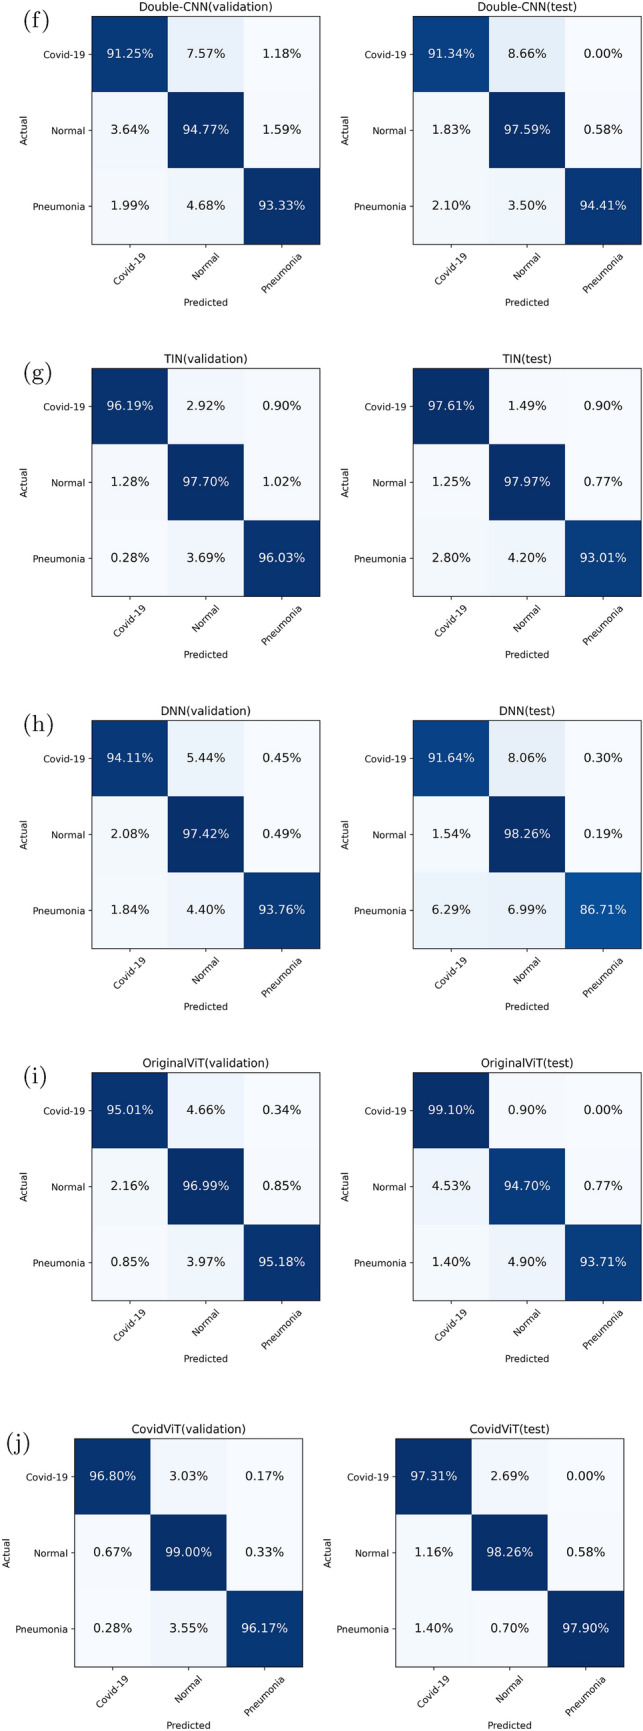
Confusion matrices of all models
TIN is the best model in CNNs, but it is still not good enough to outperform CovidViT. We also notice there is no significant difference in accuracy of normal cases between ViT-based model and CNN-based model. The main advantage of ViT-based model is higher Covid-19 and Pneumonia cases detection rate.
Comparison of different models from ROC curve and AUC
The ROC curve, is shown as Fig. 9, can be divided into three echelons, and there are obvious gaps between each echelon. Among them, CovidViT and TIN belong to the first echelon, CovidVGG and AlexNet belong to the third echelon, and the others belong to the second echelon. CovidViT performed the best of all models.
Fig. 9.
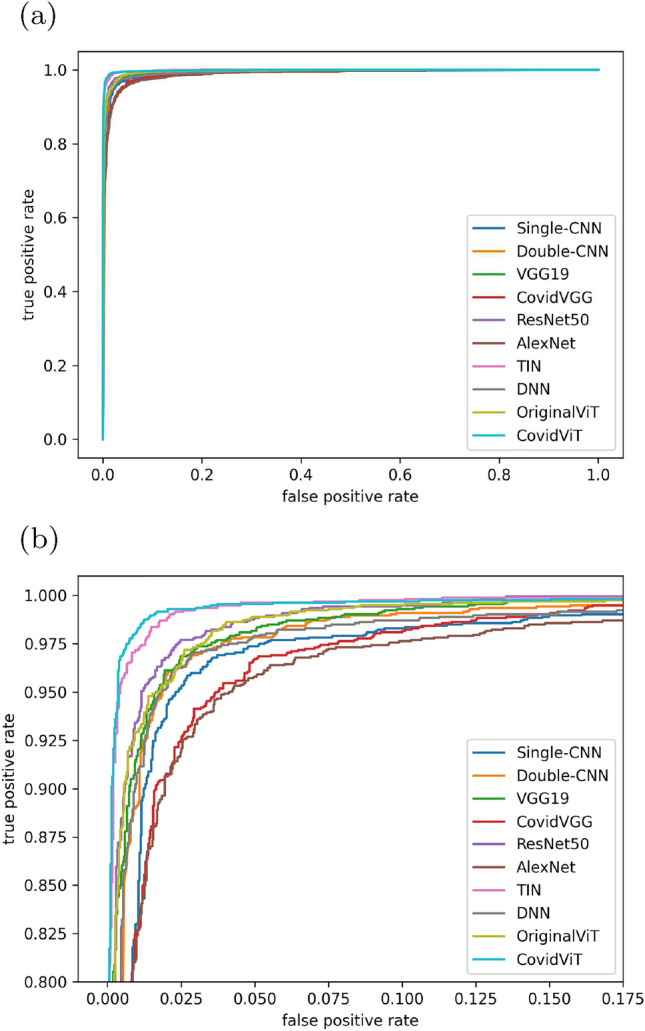
ROC curve of eight models on test data, a overview, b local
Comparison with different models from summarized results
Table 6 shows the average performance on validation set, each number represents the average plus and minus standard deviation of 5 fold results. The best model was picked from the 5 fold results, then evaluated it on test set, as shown in Table 7. CovidViT achieves the best performance in all terms of criteria except AUC compared to TIN, which achieves the best result in the traditional convolutional neural networks.
Table 6.
Performance comparison of eight models on 5-fold-validation set
| Models | ACC | AUC | Rec | Prec | |
|---|---|---|---|---|---|
| CovidVGG | 0.771 ± 0.127 | 0.693 ± 0.237 | 0.524 ± 0.315 | 0.562 ± 0.281 | 0.500 ± 0.340 |
| VGG19 | 0.784 ± 0.133 | 0.688 ± 0.237 | 0.534 ± 0.324 | 0.569 ± 0.288 | 0.512 ± 0.351 |
| ResNet50 | 0.956 ± 0.007 | 0.992 ± 0.002 | 0.943 ± 0.008 | 0.935 ± 0.010 | 0.952 ± 0.007 |
| AlexNet | 0.937 ± 0.004 | 0.984 ± 0.003 | 0.917 ± 0.007 | 0.915 ± 0.008 | 0.921 ± 0.016 |
| Single-CNN | 0.937 ± 0.026 | 0.987 ± 0.003 | 0.927 ± 0.024 | 0.928 ± 0.019 | 0.931 ± 0.023 |
| Double-CNN | 0.938 ± 0.036 | 0.985 ± 0.008 | 0.921 ± 0.047 | 0.931 ± 0.020 | 0.916 ± 0.066 |
| TIN | 0.972 ± 0.008 | 0.997 ± 0.001 | 0.959 ± 0.010 | 0.966 ± 0.004 | 0.954 ± 0.020 |
| DNN | 0.963 ± 0.007 | 0.991 ± 0.002 | 0.952 ± 0.007 | 0.951 ± 0.003 | 0.954 ± 0.012 |
| OriginalViT | 0.964 ± 0.003 | 0.995 ± 0.001 | 0.953 ± 0.003 | 0.957 ± 0.009 | 0.950 ± 0.009 |
| CovidViT | 0.982 ± 0.001 | 0.996 ± 0.002 | 0.976 ± 0.001 | 0.973 ± 0.004 | 0.978 ± 0.005 |
The best results are in bold
Represents our proposed models
Table 7.
Performance comparison of eight models on test set
| ACC | AUC | Rec | Prec | ||
|---|---|---|---|---|---|
| CovidVGG | 0.941 | 0.987 | 0.926 | 0.918 | 0.935 |
| VGG19 | 0.960 | 0.994 | 0.946 | 0.934 | 0.959 |
| Resnet50 | 0.964 | 0.996 | 0.953 | 0.945 | 0.961 |
| AlexNet | 0.937 | 0.982 | 0.912 | 0.913 | 0.910 |
| Single-CNN | 0.951 | 0.986 | 0.932 | 0.931 | 0.932 |
| Double-CNN | 0.959 | 0.989 | 0.948 | 0.944 | 0.953 |
| TIN | 0.974 | 0.998 | 0.958 | 0.962 | 0.954 |
| DNN | 0.957 | 0.990 | 0.938 | 0.922 | 0.955 |
| OriginalViT | 0.956 | 0.997 | 0.945 | 0.958 | 0.935 |
| CovidViT | 0.980 | 0.998 | 0.974 | 0.978 | 0.969 |
The best results are in bold
Represents our proposed models
There is a question that why some models perform worse on validation set, but better on test set, especially the VGG-based models? Meanwhile, Table 8 shows the accuracy of eight models on 5 folds validation set. We noticed the accuracy of VGG-based models is below 70% on some folds, but more than 90% on other folds. This give an explanation of the above question, VGG-based models are more sensitive to initial values, a bad initial value results in bad performance, and the performance of the validation set is to average all these results, even if only one fold has bad performance, it will degrade the average performance of the validation set, but the test results is only based on the optimal parameters according to the results on validation set, therefore a bad initial value will seldom affect it.
Table 8.
The accuracy of eight models on 5 folds validation set
| Model | Fold-1 | Fold-2 | Fold-3 | Fold-4 | Fold-5 |
|---|---|---|---|---|---|
| CovidVGG | 0.670 | 0.680 | 0.652 | 0.940 | 0.912 |
| VGG19 | 0.670 | 0.958 | 0.933 | 0.682 | 0.675 |
| Resnet50 | 0.964 | 0.961 | 0.945 | 0.956 | 0.951 |
| AlexNet | 0.935 | 0.936 | 0.944 | 0.935 | 0.934 |
| Single-CNN | 0.951 | 0.957 | 0.886 | 0.947 | 0.943 |
| Double-CNN | 0.947 | 0.968 | 0.956 | 0.868 | 0.952 |
| TIN | 0.975 | 0.964 | 0.963 | 0.983 | 0.974 |
| DNN | 0.973 | 0.964 | 0.954 | 0.966 | 0.958 |
| OriginalViT | 0.966 | 0.966 | 0.965 | 0.957 | 0.964 |
| CovidViT | 0.982 | 0.982 | 0.981 | 0.985 | 0.981 |
The best results are in bold
Represents our proposed models
In addition, we also performed the Wilcoxon signed rank test on Table 8, the p-value is shown in Table 9, which showed that the accuracy of CovidViT was significantly different from other models. Where null hypothesis is that the median of differences between CovidViT and test model in Table 8 equals 0.
Table 9.
The p-value of related-samples Wilcoxon signed rank test between CovidViT and different models
| Test model | p-value |
|---|---|
| CovidVGG | 0.043 |
| VGG19 | 0.043 |
| Resnet50 | 0.043 |
| AlexNet | 0.043 |
| Single-CNN | 0.043 |
| Double-CNN | 0.043 |
| TIN | 0.041 |
| DNN | 0.043 |
| OriginalViT | 0.039 |
Represents our proposed models
Comparison of different models from time consumption
Table 10 shows the time cost in training process and diagnosis process. It can be found that CovidViT needs more time to train and diagnose compared to most convolutional neural networks, especially for the shallow-CNNs, but it only needs less than 0.1 s to diagnose an X-ray image, so we believe this can be ignored in practical.
Table 10.
Time consumption of eight models about training and diagnosis phase
| Models | Training time for one epoch (s) | Diagnosis time for one image (ms) |
|---|---|---|
| CovidVGG | 25.54 | 8.98 |
| VGG19 | 211.54 | 17.15 |
| ResNet50 | 74.74 | 40.39 |
| AlexNet | 12.2 | 3.99 |
| Single-CNN | 9.14 | 2.79 |
| Double-CNN | 11.51 | 1.90 |
| TIN | 40.52 | 7.00 |
| DNN | 32.03 | 2.13 |
| OriginalViT | 86.02 | 50.66 |
| CovidViT | 130.38 | 33.31 |
The best results are in bold
Represents our proposed models
Rapid diagnosis system based on CovidViT
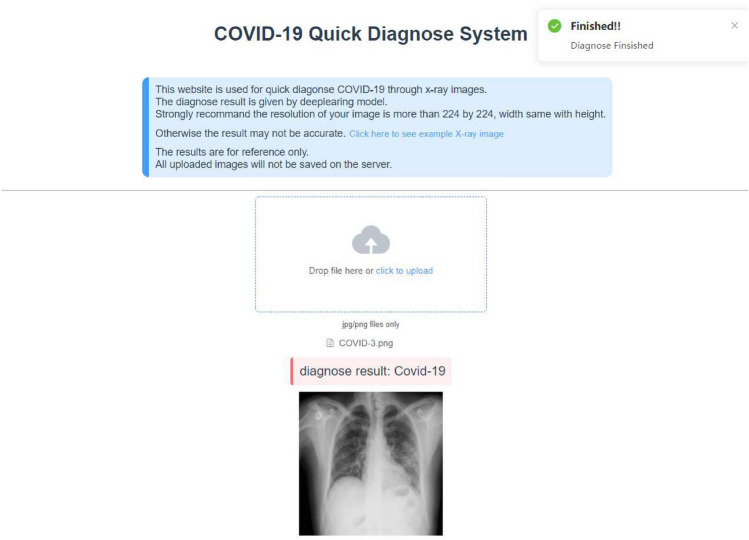
To successfully implement it in practice, a website was built to quickly diagnose Covid-19 by X-ray images through the proposed CovidViT, shown as Fig. 10. Everyone can easily get the diagnosis results by uploading the X-ray images in the website http://yanghang.site/covid19.
Fig. 10.
Covid-19 quick diagnosis by X-ray image
Discussion
In this study, CovidViT demonstrated the ability of transformers to diagnose Covid-19 through X-ray images. From the summarized results, better performance is gained compared with the traditional CNN architecture, which implied that transformers architecture may be more suitable than CNN to diagnose Covid-19. Transformers have the ability to compute the attention of all different patches no matter the distance, while traditional CNNs has to add more convolutional layers to increase the receptive field to calculate the relationship between two adjacent pixels, which makes CNNs more difficult to have long-range computation ability.
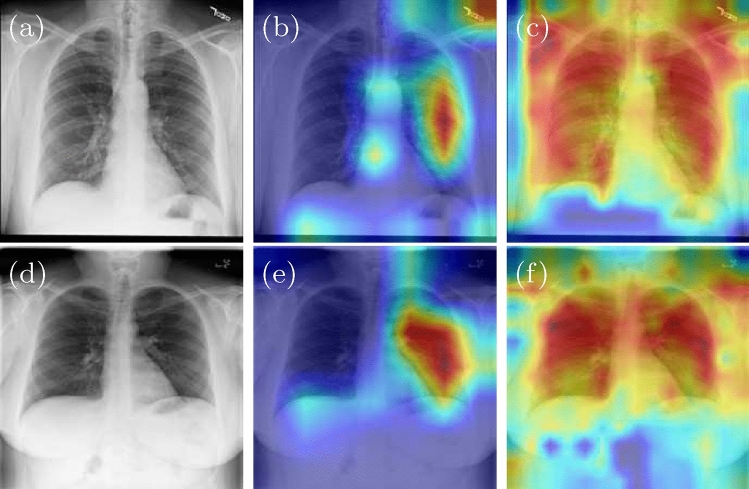
We also apply Grad-CAM [20, 21] heat map approach to give a visual explanation of the reason why CovidViT outperforms than CNN, Grad-CAM heat map indicates the most important region for model prediction. The heat maps of ResNet50 and CovidViT are shown as Fig. 11. The heat map shows ResNet50 mainly focuses on the right lung, but our CovidViT looks at the entire lung rather than its part, which means ResNet50 only has a local visual field while CovidViT has a global visual field. CovidViT gives its prediction with the information of the entire lung, we believe that transformers architecture has better long-range computation ability than CNN.
Fig. 11.
Heat map of ResNet50 and CovidViT, original image (a, d), ResNet50 (b, e), and CovidViT (c, f)
From the confusion matrix, it can be found that CovidViT has a better accuracy on Covid-19 and Pneumonia cases. However, CNNs have a trend to misdiagnose Covid-19 and Pneumonia cases into Normal cases due to the training data is unbalanced (more than 67% data belongs to Normal cases), which indicates that CovidViT is more robust than CNNs in dealing with the unbalanced dataset.
Meanwhile, we note that Single-CNN and Double-CNN outperform CovidVGG, VGG19, and AlexNet, which belong to deep CNNs, indicating that complex architectures do not guarantee to produce better performance. While shallow-CNNs are not the best models, they are really impressive when we consider their number of parameters, Double-CNN has only 300k parameters, 1% of ResNet50 and 0.1% of CovidViT.
Many researchers have applied convolutional neural networks to diagnose Covid-19 by X-ray images, but this is the first time to apply transformers and self-attention mechanism in this task. Additionally, other previous results were compared with the results in this work, as shown in Table 11.
Table 11.
Performance comparison of the proposed Covid-19 diagnostic method with other deep learning methods
| Labels | Researcher | Model | Accuracy (%) |
|---|---|---|---|
| Binary labels | Wehbe et al. [22] | DeepCOVID-XR | 83 |
| Sethy et al. [24] | ResNet50+SVM | 95.38 | |
| Loey et al. [26] | ResNet50 with augmentation | 82.91 | |
| Kawsher Mahbub et al. [27] | DNN | 99.87 | |
| Mukherjee et al. [28] | DNN | 96.28 | |
| Das et al. [33] | TIN | 98.77 | |
| Multiple labels | Ozturk [6] | DarkCovidNet | 87.02 |
| Apostolopoulos et al. [7] | VGG-19 | 93.48 | |
| Al-Falluji [8] | Modified ResNet18-Based | 96.73 | |
| Wang et al. [23] | COVID-Net | 92.4 | |
| Dev et al. [25] | HCN-DML | 96.67 | |
| Das et al. [33] | TIN | 97.4 | |
| Kawsher Mahbub et al. [27] | DNN | 95.7 | |
| Proposed study | CovidViT | 98.0 |
Denotes the accuracy is gained by training on the same dataset with CovidViT by ourselves
We need to point out that this comparison may not be fair because each researcher used different datasets, including dataset size and number of categories. Although DNN [27] and TIN [33] gained high accuracy (99.87% and 98.77%), they were based on the binary classification problem. However, our model is based on the three classes classification problem. For the fair comparison, we apply model DNN and TIN into the three classes classification problem, it gains 95.7% and 97.4% accuracy, and is less than accuracy (98.0%) of our model. The corresponding results are shown in Table 11.
However, there is no prefect model, we also have to point out that the long-range compute ability of CovidViT also makes it need more data to train, so the CovidViT model has pre-trained on ImageNet-21k while others have not. So if researchers lack large data or the computation ability to pre-train, CNNs may still surpass CovidViT model.
Conclusion
Covid-19 has had huge impact on the world, and it is very important to get rid of this epidemic. An accurate, easy, and low-cost detection method can help a lot nowadays. X-ray is cheaper and quicker method compared with the popular detection methods. In this study, we proposed CovidViT and achieved 98.0% accuracy in the task of Covid-19 detection through X-ray images.
CovidViT is an end to end model, when inputting the X-ray image, it will output the diagnosis result in 33.31 ms on GTX2080 with 98.0% accuracy. The system we designed will offer a reliable result, which can be applied in the hospital, especially for those are facing a shortage of radiologists. More importantly, the cost friendly and high speed make it suitable for the large-scale detection.
Furthermore, in order to help those people who do not have experience in deep learning to get their diagnosis results, we build an online diagnose system on http://yanghang.site/covid19. They can upload their X-ray image to this website and achieve the diagnosis result immediately.
Acknowledgements
The authors gratefully acknowledge the helpful comments of the reviewers, which have improved the presentation. This work was supported by the National Natural Science Foundation of China (nos. 12071475, 11671010), Beijing Natural Science Foundation, China (no. 4172035), Chinese Universities Scientific Fund (no. 2022TC083), and National Precision Agriculture Application Project (no. JZNYYY001).
Declarations
Conflict of interest
The authors declared that they have no conflicts of interest to this work.
Footnotes
Publisher's Note
Springer Nature remains neutral with regard to jurisdictional claims in published maps and institutional affiliations.
Hang Yang and Liyang Wang contributed equally to this work.
Contributor Information
Yitian Xu, Email: xytshuxue@cau.edu.cn.
Xuhua Liu, Email: liuxuhua@cau.edu.cn.
References
- 1.Huang C, Wang Y, Li X, Ren L, Zhao J, et al. Clinical features of patients infected with 2019 novel coronavirus in Wuhan, China. Lancet. 2020;395(10223):497–506. doi: 10.1016/S0140-6736(20)30183-5. [DOI] [PMC free article] [PubMed] [Google Scholar]
- 2.Singhal T. A review of coronavirus disease-2019 (COVID-19) Indian J Pediatr. 2020;87(4):281–286. doi: 10.1007/s12098-020-03263-6. [DOI] [PMC free article] [PubMed] [Google Scholar]
- 3.Long C, Xu H, Shen Q, Zhang X, Fan B, Wang C, Zeng B, Li Z, Li X, Li H. Diagnosis of the coronavirus disease (COVID-19): rRT-PCR or CT? Eur J Radiol. 2020;126:108961. doi: 10.1016/j.ejrad.2020.108961. [DOI] [PMC free article] [PubMed] [Google Scholar]
- 4.Zu ZY, Jiang MD, Xu PP, Chen W, Ni QQ, Lu GM, Zhang LJ. Coronavirus disease 2019 (COVID-19): a perspective from China. Radiology. 2020;296(2):E15–E25. doi: 10.1148/radiol.2020200490. [DOI] [PMC free article] [PubMed] [Google Scholar]
- 5.Faust O, Hagiwara Y, Hong TJ, Lih OS, Acharya UR. Deep learning for healthcare applications based on physiological signals: a review. Comput Methods Progr Biomed. 2018;161:1–13. doi: 10.1016/j.cmpb.2018.04.005. [DOI] [PubMed] [Google Scholar]
- 6.Ozturk T, Talo M, Yildirim EA, Baloglu UB, Yildirim O, Acharya UR. Automated detection of COVID-19 cases using deep neural networks with X-ray images. Compute Biol Med. 2020;121:103792. doi: 10.1016/j.compbiomed.2020.103792. [DOI] [PMC free article] [PubMed] [Google Scholar]
- 7.Apostolopoulos ID, Mpesiana TA. COVID-19: automatic detection from X-ray images utilizing transfer learning with convolutional neural networks. Phys Eng Sci Med. 2020;43(2):635–640. doi: 10.1007/s13246-020-00865-4. [DOI] [PMC free article] [PubMed] [Google Scholar]
- 8.Al-Falluji RA. Automatic detection of COVID-19 using chest X-ray images and modified ResNet18-based convolution neural networks. Comput Mater Contin. 2021;66(2):1301–1313. [Google Scholar]
- 9.Vaswani A, Shazeer N, Parmar N et al (2017) Attention is all you need. In: Proceedings of the 31st International Conference on Neural Information Processing Systems (NIPS'17). Curran Associates Inc., Red Hook, NY, USA, 6000–6010
- 10.Dosovitskiy A, Beyer L, Kolesnikov A, Weissenborn D et al (2021) An image is worth 16x16 words: transformers for image recognition at scale. In: 2021 International conference on learning representations (ICLR), pp 1–14
- 11.Simonyan K, Zisserman A (2015) Very deep convolutional networks for large-scale image recognition. In: 2015 International conference on learning representations (ICLR)
- 12.He K, Zhang X, Ren S, Sun J (2016) Deep Residual Learning for Image Recognition. In: 2016 IEEE conference on computer vision and pattern recognition (CVPR), pp 770–778. 10.1109/CVPR.2016.90
- 13.Krizhevsky A, Sutskever I, Hinton G. Imagenet classification with deep convolutional neural networks. Adv Neural Inf Process Syst. 2012;25:1097–1105. [Google Scholar]
- 14.Chowdhury M, Rahman T, Khandakar A, et al. Can AI help in screening viral and COVID-19 pneumonia? IEEE Access. 2020;8:132665–132676. doi: 10.1109/ACCESS.2020.3010287. [DOI] [Google Scholar]
- 15.Rahman T, Khandakar A, Qiblawey Y, et al. Exploring the effect of image enhancement techniques on COVID-19 detection using chest X-ray images. Comput Biol Med. 2021;132:104319. doi: 10.1016/j.compbiomed.2021.104319. [DOI] [PMC free article] [PubMed] [Google Scholar]
- 16.Wu B, Xu C, Dai X, Wan A, Zhang P, Yan Z, Tomizuka M, Gonzalez J, Keutzer K, Vajda P (2020) Visual transformers: token-based image representation and processing for computer vision. CoRR. 10.48550/arxiv.2006.03677
- 17.Deng J, Dong W, Socher R, Li L, Li K, Fei-Fei L (2009) Imagenet: a large-scale hierarchical image database. In: 2009 IEEE conference on computer vision and pattern recognition (CVPR), pp 248–255. 10.1109/CVPR.2009.5206848
- 18.Zeng G. On the confusion matrix in credit scoring and its analytical properties. Commun Stat Theory Methods. 2020;49(9):2080–2093. doi: 10.1080/03610926.2019.1568485. [DOI] [Google Scholar]
- 19.Erkel A, Pattynama P. Receiver operating characteristic (ROC) analysis: basic principles and applications in radiology. Eur J Radiol. 1998;27(2):88–94. doi: 10.1016/S0720-048X(97)00157-5. [DOI] [PubMed] [Google Scholar]
- 20.Selvaraju RR, Cogswell M, Das A, Vedantam R, Parikh D, Batra D (2017) Grad-cam: Visual explanations from deep networks via gradient-based localization. In: 2017 Proceedings of the IEEE international conference on computer vision (ICCV), pp 618–626. 10.1109/ICCV.2017.74
- 21.Gildenblat J and Contributors (2021) PyTorch library for CAM methods. GitHub. https://github.com/jacobgil/pytorch-grad-cam. Accessed 20 Nov 2021
- 22.Wehbe RM, Sheng J, Dutta S, Chai S, et al. DeepCOVID-XR: an artificial intelligence algorithm to detect COVID-19 on chest radiographs trained and tested on a large US clinical data set. Radiology. 2021;299(1):E167–E176. doi: 10.1148/radiol.2020203511. [DOI] [PMC free article] [PubMed] [Google Scholar]
- 23.Wang L, Lin Z, Wong A. COVID-Net: a tailored deep convolutional neural network design for detection of COVID-19 cases from chest X-ray images. Sci Rep. 2020;10(1):1–12. doi: 10.1038/s41598-020-76550-z. [DOI] [PMC free article] [PubMed] [Google Scholar]
- 24.Sethy PK, Santi K, Behera, et al. Detection of coronavirus disease (COVID-19) based on deep features and Support Vector Machine. Int J Math Eng Manag Sci. 2020;5(4):643–651. [Google Scholar]
- 25.Dev K et al (2021) Triage of potential COVID-19 patients from chest X-ray images using hierarchical convolutional networks. Neural Comput Appl. 10.1007/s00521-020-05641-9 [DOI] [PMC free article] [PubMed]
- 26.Loey M, Manogaran G, Khalifa NEM (2020) A deep transfer learning model with classical data augmentation and CGAN to detect COVID-19 from chest CT radiography digital images. Neural Comput Appl. 10.1007/s00521-020-05437-x [DOI] [PMC free article] [PubMed]
- 27.Kawsher Mahbub Md, Biswas M, Gaur L, et al. Deep features to detect pulmonary abnormalities in chest X-rays due to infectious diseaseX: Covid-19, pneumonia, and tuberculosis. Inf Sci. 2022;592:389–401. doi: 10.1016/j.ins.2022.01.062. [DOI] [PMC free article] [PubMed] [Google Scholar]
- 28.Mukherjee H, Ghosh, et al. Deep neural network to detect COVID-19: one architecture for both CT Scans and Chest X-rays. Appl Intell. 2021;51:2777–2789. doi: 10.1007/s10489-020-01943-6. [DOI] [PMC free article] [PubMed] [Google Scholar]
- 29.Santosh KC, Ghosh S. Covid-19 imaging tools: how big data is big? J Med Syst. 2021;45(71):1–8. doi: 10.1007/s10916-021-01747-2. [DOI] [PMC free article] [PubMed] [Google Scholar]
- 30.Santosh KC. AI-driven tools for coronavirus outbreak: need of active learning and cross-population train/test models on multitudinal/multimodal data. J Med Syst. 2020;44(5):1–5. doi: 10.1007/s10916-020-01562-1. [DOI] [PMC free article] [PubMed] [Google Scholar]
- 31.Santosh KC, Ghosh et al (2022) Deep learning for Covid-19 screening using chest X-rays in 2020: a systematic review. Int J Pattern Recognit Artif Intell 36(5):2252010
- 32.Kingma Diederik P, Adam JB (2015) A method for stochastic optimization. In: 2015 International conference on learning representations (ICLR)
- 33.Das D, Santosh KC, Pal U. Truncated inception net: COVID-19 outbreak screening using chest X-rays. Phys Eng Sci Med. 2020;43:915–925. doi: 10.1007/s13246-020-00888-x. [DOI] [PMC free article] [PubMed] [Google Scholar]


