

Abstract
By harmonizing the pre-preparation conditions and also removing some donors’ variations, the current study took one step forward to investigate whether different leukocyte filtration sets influence the quality of RBCs throughout the storage time. Twelve whole blood units were collected, and each unit was split into three equal parts. Thirty-six divided bags were filtered using three different leukocyte-filtration sets including Red Cell and Whole Blood Filters (12 units per filter). The prepared RBCs were refrigerated for up to 42 days and assessed for microvesicle count and size, clotting- and prothrombin time, hemolysis index, and biochemical parameters. A significant increment in erythrocytes microvesicle count (EMVs/μL) was observed during the time in the three filtration sets. The number of EMVs in WBF-RBCs was higher (~1.6 fold) than in F-RCF on day 42 (p=0.035). Interestingly the median fluorescence intensity of EMVs decreased during the storage. The size of MVs rose during the time without any significant differences among the filters. Coagulation time decreased in RBCs over the storage, with no significant differences among the filters. Hemolysis index and lactate concentration increased while glucose level decreased significantly throughout the time. The changes in WBF-RBCs were more drastic rather than RCF-RBCs. The only significant difference in the count of EMVs was between WBF and F-RCF components on day 42. Though the changes in WBF products were more drastic, all the values fell within the standard limits. Accordingly, all three filtration sets can be considered.
Key Words: Leukocytes filtration procedure, erythrocyte-derived microvesicle, hemolysis index, coagulation time
Ethical Publication Statement
We confirm that we have read the Journal’s position on issues involved in ethical publication and affirm that this report is consistent with those guidelines.
As a common life-saving therapeutic approach, Red Blood Cell components (RBCs) are the most transfused component worldwide. However, the repercussions related to components' preparation and storage have remained the most significant challenge facing transfusion medicine.1,2 Accordingly, quality assurance possesses a crucial dignity in all products' collection, preparation, and storage level.3 Until now, the accomplishment of several processing strategies including leukocyte depletion has improved the quality of the components. Above all, blood components’ leukocyte-filtration is a momentous achievement that reduces the risk of leukocyte-associated complications such as febrile and febrile non-hemolytic reactions, HLA alloimmunization, and cytomegalovirus transmission.4
During storage, erythrocytes undergo a variety of detrimental oxidative, biochemical, and biomechanical alterations collectively denoted as “hypothermal storage lesions”.5-7 Exposure to various stressors makes erythrocytes susceptible to destruction, hemolysis, and several membrane alterations, which end up with the formation of microvesicles (MVs).2,6MVs are submicron membrane-covered particles heterogeneous in size (50 nm-1 μm) and originated from different cells under various circumstances in health and disease. They carry their parents' molecular contents and cell-specific markers by which they are characterized.8-10 As a permanent feature of the aging process, vesiculation occurs in both in and ex vivo conditions.5-11 Actually, in the context of blood transfusion erythrocytes-derived microvesicles (EMVs) are assumed as storage lesions.
Growing documents have signified they are involved in a broad spectrum of physiological and pathological mechanisms and may boost some pathways, including coagulation and inflammation.2,8,12,13 In addition to storage conditions, variability of donors, pre-processing conditions, and blood processing techniques are referred to as sources of RBCs quality variations associated with undesired clinical consequences and poor outcomes.2,6,14,15 As regards, the issued RBCs produced through different preparation procedures are not equally processed, even though the whole process is tightly supervised, elucidating the role of blood preparation methods in the quality of the components is crucially important.3,16 At the Iranian Blood Transfusion Organization (IBTO), the leukocyte-filtration process began in 2005, and today about one-third of the RBCs components are produced using two different leukocyte filtration procedures including whole blood- (WBF) and red cell (RCF) filtration. Regarding the emphasis on using leukocyte-filtered products, the current experimental study was established to investigate the possible effects of three different leukocyte-depletion filters (which are currently used at IBTO) on the EMVs formation in RBCs components and also the quality of the components by harmonizing the preparation conditions and eliminating some confounding variables.
Materials and Methods
Blood collection
This study was performed in line with the principles of the Declaration of Helsinki. Approval was granted by the Ethics Committee of the High Institute for Research and Education in Transfusion Medicine with the ethics code ID IR.TMI.REC.1398.014. Following receiving informed consent, 12 whole blood units (450±45 mL) from eligible healthy volunteers at IBTO were collected into blood collection bags. All the components were then processed under the same condition, within a maximum storage period of 6 hours of stop-bleed time at 20-24 °C.
Whole blood dividing and RBC component preparation
All the units were obtained from young male donors with blood type A+ to remove confounding individual variables. After measuring weight and calculating the exact volume, each unit was split into three equal parts using a sterile tubing welder (Terumo BCT TSCD II) in a completely closed system. Therefore, 36 units were provided from the primarily donated bags, which were then filtered using three different filters including two RCF and one WBF (12 units per filter). When the relevant filters were conjoined to the divided bags, in the first, for the WBF procedure (using PQ31555, Fresenius Kabi, Homburg, Germany), 12 whole blood bags were filtered and then centrifuged (Jouan KR 4-22 floor refrigerated centrifuge, REUZEit, US). Later, the centrifuged units were separated into RBC and plasma components using a manual plasma extractor (Grey, Fresenius, Rs 63840). Finally, the prepared RBCs were suspended in 33 mL of [saline-adenine-glucose-mannitol (SAGM)]. In the second, for the RCF method, following centrifugation and separation of the components, 33 mL of SAGM was added to the RBCs. The products were subsequently filtered using two different leukocyte-filtration sets including PQ31250, Fresenius Kabi, Homburg, Germany and LQE615Q, Leucoflex LCR5, Macopharma, France (12 products per filter). In the last, all the RBCs were stocked at 2-6 °C for up to 42 days. Afterward, RBCs sampling was accomplished four times on days 2, 14, 28, and 42, and to avoid contamination, each day 15 mL of well-mixed RBCs were conducted into accessory bags using a sterile tubing welder in a completely closed system; the samples were next emptied into 15 mL conical tubes and centrifuged to assess subsequently.
MVs isolation
Before running the protocols, phosphate buffer solution (PBS) and Annexin binding buffer were filtered using 0.22 μm syringe filters (TPP, Switzerland) to remove any artificial particles.
To isolate MVs, we followed a standard protocol based on sequential centrifugations (17); 8 mL of RBCs was first centrifuged for 15 min at 1200×g at room temperature (RT) (Eppendorf centrifuge 5702, Germany); the supernatant was transferred into a clean tube and centrifuged again for 15 min at 1500×g, RT. Second, the supernatant was transferred into a suitable 15 mL conical tube and centrifuged for 35 min at 14000×g, 4 °C. (Sigma 3K30 Zentrifugen, Germany). After discarding the supernatant, the tubes were reversely placed on a paper towel for 5 min to absorb all the residual liquid. Third, the pellet was re-suspended in 1000 μL PBS, transferred into a 1.5 mL microtube, and centrifuged once again for 35 min at 14000×g, 4 °C. Afterward, the supernatant was completely decanted and the pellet was re-suspended in 500 μL PBS to be analyzed subsequently.
Flow cytometry assay
We followed the instructions of some previous analyses performed in the flow cytometry department at our institution, as other published studies,3,7,12,17 to determine the counts and phenotypes of MVs. The samples were freshly analyzed by a bench-top CY flow space flow cytometer (Partec PAS, Karlsruhe, Germany).
Three markers including Phycoerythrin (PE) anti-glycophorin A (CD235a), Fluorescein isothiocyanate (FITC) mouse anti-human CD42b, and FITC Annexin V (AnnV) (all supplied from BD Pharmingen, San Diego, CA, USA) were applied to label EMVs, platelet-derived (PMVs) and phosphatidylserine-positive MVs (PS+MVs) respectively. Fluorescent monodispersed polystyrene microspheres 1.0 μm (Fluoresbrite® YG Carboxylate Microsphere, Polysciences, Warrington, PA, USA) was used as a size guide to determine and gate true MVs (less than 1.0 μm). It contained precise numbers of fluorescent beads which were utilized for calculating the absolute number of MVs/μL. In the test tubes, series one, 30 μL MVs were marked with 3 μL PE-anti CD235a and incubated in the dark at 4 °C for 20 min; then 300 μL Ann binding buffer 1 x (pH 7.4, 0.1 mol/L HEPES, 1.4 mol/L NaCl, 25 mmol/L CaCl2) and 5 μL human FITC-Ann V was added to the tubes, mixed and incubated in the dark at RT for 30 min. In the test tubes, series two, 30 μL MVs were marked with 5 μL FITC-anti-human CD42b and incubated in the dark for 20 min. Immediately before running, 5 μL vortex-mixed fluorescent beads (diluted 1:500 in double-distilled water) were added to each tube. Following that, the number of MVs was analyzed compared to 10000 bead events. The instrument flow rate was 2000 events/sec and the counting limit was defined on 10000 bead events. Count of MVs/μL
Table 1.
Count and size of microvesicles.
| Test | Day 2 | Day 14 | Day 28 | Day 42 | p-value⁑ |
|---|---|---|---|---|---|
| CD235a+MVs(count/µL) | |||||
| F-RCF | 4938±3884 | 10660±5976 | 26327±15554 | 38626±20955 | <0.001a |
| M-RCF | 4017±2930 | 9361±4803 | 25831±14748 | 58278±24727 | <0.001a |
| WBF | 4260±3821 | 9718±6452 | 35086±20962 | 62384±26974 | <0.001a |
| P-value‡ | 0.809 | 0.852 | 0.350 | 0.035 # | - |
| # Significant difference between F-RCF&WBF: Bonferroni. | |||||
| Median Fluorescent Intensity of CD235a | |||||
| F-RCF | 34.54±29.7 | 6.8±3.64 | 4.92±3.37 † | 1.92±0.83 | 0 004 a |
| M-RCF | 28.12±28.6 | 7.72±5.51 | 5±3.66 † | 1.43±0.61 | 0.015a |
| WBF | 24.39±26.24 | 6.31±4.68 | 3.63±2.69 † | 1.24±0.47 | 0.021a |
| P-value‡ | 0.676 | 0.757 | 0.521 | 0.05 | - |
| † P-value >0.05 in comparison to day 14 | |||||
| Annexin V+MVs (count/µL) | |||||
| F-RCF | 23.67±16 | 48.33±26.03 | 125.92±45.04 | 238±118.18 | <0.001a |
| M-RCF | 18.25±14.8 | 61.25±33.53 | 169.67±70.48 | 299.33±147.05 | <0.001a |
| WBF | 20.58±14.92 | 72.24±34.35 | 150.06±63.84 | 350.5±124.99 | <0.001a |
| P-value‡ | 0.686 | 0.189 | 0.239 | 0.123 | - |
| CD42b+MVs (count/µL) | |||||
| F-RCF | 75±106.2 | 64.83±98.4 | 19.42±29 | 7.33±7.94 | >0.05 |
| M-RCF | 78.92±101.66 | 43.67±55.85 | 14±14.95 † | 5±6.3 † | <0.05a |
| WBF | 163.75±198.15 | 129.58±177.76 | 57.92±84 † | 8.5±8.9 † | <0.05a |
| p-value‡ | 0.192 | 0.246 | 0.097 | 0.542 | - |
| † P-value >0.05 in comparison to day 14 & 28 | |||||
| Dynamic light scattering (nm) results | |||||
| F-RCF | 57.13±3.13 | 187.6±27.26 | 211.45±22.13 † | 203.15±7.73 † | <0.001 |
| M-RCF | 59.25±15.57 | 172.52±30.12 | 223.27±6.14 † | 213.42±15.23 † | <0.001 |
| WBF | 45±7.54 | 187.4±26.37 | 194.3±38.56 † | 195.32±15.31 † | <0.001 |
| p-value‡ | 0.157 | 0.698 | 0.328 | 0.208 | - |
| † P-value >0.05 in comparison to day 14 & 28 | |||||
Data are presented as mean ± standard deviation. a Greenhouse-Geisser test. ⁑ Differences over the days in each filter (simple and repeated contrast), adjustment for multiple comparisons: Bonferroni. ‡ Differences among the filters each day. The mean differences are significant at the level of 0.05. F-RCF: Fresenius Kabi Red Cell Filtration; M-RCF: Macopharma Red Cell Filtration; WBF: Whole Blood Filtration.
Moreover, commercial isotype controls (PE mouse IgG2b ĸ, FITC mouse IgG1 ĸ, BD Pharmingen) and unstained samples, as well as negative control (PBS 1x with antibodies but no samples), were utilized to account for nonspecific antibodies bindings and to discriminate background noise of the appliance.
Dynamic light scattering (DLS)
The size distribution of EMVs was measured through a NANO-flex 180° (Particle Metrix, Germany) instrument. For this purpose, RBCs (3 mL) were centrifuged and the microvesicles were prepared according to method MVs isolation. The final MVs pellet was resuspended in 1.5 mL PBS buffer. After the appliance verification, each sample was run for 90 s using refractive indexes 1.43 and 1.33 for the sample and PBS, respectively. Heterogeneity of MVs size was defined based on the samples’ polydispersity index (PDI).
Prothrombin- and clotting time assays
PT and CT were applied to assess the potency of EMVs to support coagulation. To perform PT (11), 25 μL normal pooled plasma (NPP) was mixed with 25 μL EMVs and incubated for 60 sec at 37 °C. 100 μL PT solution (Diagnostica Stago Inc STA-Neoplastine CI Plus) was next added to the mixture and the time of coagulation was recorded. We used a semi-automated benchtop system (Diagnostica Stago STart® 4 Hemostasis Analyzer, USA) to accomplish both the assays. For CT, we followed the procedure of a previously published study.12 Additionally, at the end of the storage time (day 42), we carried out an extra PT assay using serial dilutions of EMVs samples in PBS including 1:2, 1:4, 1:18, 1:16, and 1:32. The first tube contained 50 μL NPP and 50 μL PBS. The other tubes contained 50 μL NPP and 50 μL of each EMVs dilution, respectively. After adding 200 μL PT solution to the mixtures, the coagulation time of each tube was defined.
Fig 1.
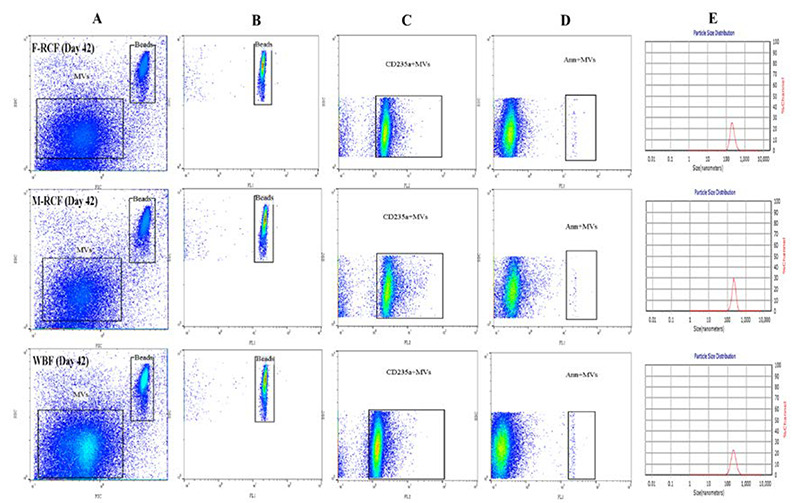
The illustration of flow cytometry gating strategy (A-D, Flowjo v10) and size distribution of MVs using dynamic light scattering (E). Plot A depicts two populations of MVs and beads (as the size guide) on the FSC vs SSC channel (logarithmic scale). Plots B, C, and D demonstrate the populations of beads, CD235a+MVs (FL2, log scale) and Ann V+MVs (FL1, log scale), respectively. The size distribution (diameter) of MVs is shown in plot E. F-RCF: Fresenius Kabi Red cell filtration, M-RCF; Macopharma Red cell filtration, WBF: Whole Blood filtration.
Hemolysis index and biochemical parameters
RBC samples were undergone centrifugation at 1000 ×g for 10 min at 4 °C, and the supernatant was analyzed to determine biochemical parameters (lactate and glucose) and hemolysis index. We applied a benchtop automated analyzer (Roche’s Cobas Mira chemistry analyzer, Germany) to enzymatically measure lactate (Audit Diagnostics, Glenbio Ireland) and glucose (Darman Faraz Kave, Iran). Before analysis, the instrument was verified using serum controls (Darman Faraz Kave, Iran). The hemolysis amounts were assessed by the absorption spectrum of free hemoglobin at 415, 450, and 700 nm by a spectrophotometer (UNICO UV-2100, USA). The percentage of hemolysis was then calculated according to the other studies.18,19
Statistical analyses
The one-way ANOVA test was used to compare the means among the groups at each follow-up time. One-way repeated measure ANOVA test was used to analyze the means' changes in each group over time. Concerning the Post hoc analysis, simple and repeated contrasts and pairwise comparison with Bonferroni adjustment were considered for one-way ANOVA and repeated measure analysis, respectively. Mauchly’s Sphericity test was used for validating repeated measured analysis and choosing appropriate adjustments. Pearson correlation coefficient was used to evaluate the association of two quantitative variables. Statistically significant levels were set at 0.05. All statistical analyses were conducted by SPSS (version 25) software.
Results
Count and phenotype of MVs
Altogether, flow cytometric analysis divulged a significant gradual increase in the absolute count of EMVs/μL and PS+EMVs/μL, and also a gradual decrease in the median fluorescence intensity for the expression of CD235a on EMVs (MFI of EMVs) in the all three filtration sets during the storage time (Table 1). For gating strategy, MVs were first gated based on the forward versus side scatter as a slightly smaller population than 1.0 μm beads. By using unstained samples and isotype controls, the true population was differentiated from the background noises and debris. Afterward, the MVs population was characterized using PE anti-human CD235a (FL2 channel) and FITC Ann V (FL1 channel) markers to identify EMVs and PS+EMVs populations, respectively (Figure 1). Statistically significant increments were observed in the number of EMVs/μL and PS+EMVs/μL on days 14, 28, and 42, with the greatest increase on day 28 in the three filtration bags (p<0.001). Generally, the changes in EMVs population were similar among the filters on days 2 to 28, although the alterations became dramatic late in storage (day 42) so that the EMVs population in WBF and Macopharma RCF (M-RCF) showed a more drastic increase in comparison to Fresenius RCF (F-RCF). Further investigation demonstrated that the difference was significant between F-RCF and WBF procedures (p=0.035). We also observed differences between M-RCF and WBF bags or M-RCF and F-RCF, though they weren’t statistically significant. Interestingly, the results revealed significant decrements in MFI of EMVs on days 14, 28, and 42, with the highest reduction on day 14 (p<0.05); no significant differences were observed among the filtration sets. Besides, the total number of PMVs decreased in the filtration bags at the time of storage. The reduction was significant in M-RCF and WBF but not in F-RCF (Table 1). It probably indicates that leukocyte-depleted RBCs contain an inconsequential count of platelets.
Fig 2.
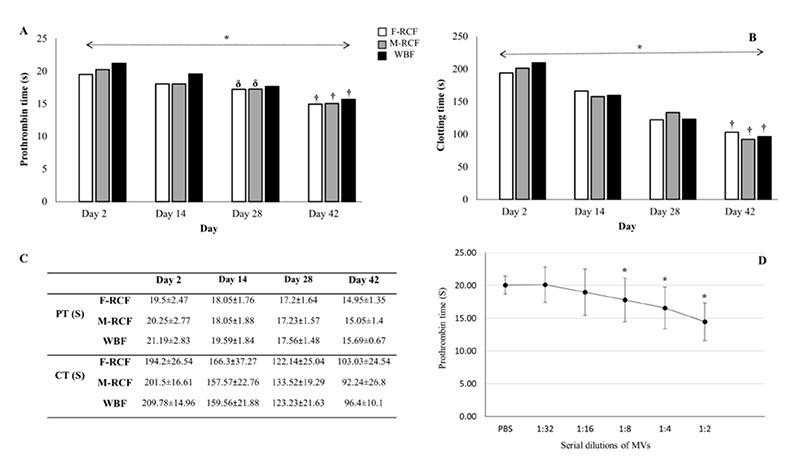
Assessment of coagulation time in stored RBCs during storage (simple and repeated contrasts). (A) Prothrombin time, (B) Clotting time, (C) data are presented as mean ± standard deviation, (D) reduction of PT vs the increasing amount of MVs (serial dilutions). * Significant differences at the level of 0.05. † The time point when corresponds to the most decrement among the days. δ Time points when did not change significantly compared to the immediate before time (repeated contrast). F-RCF: Fresenius Kabi Red Cell Filtration; M-RCF: Macopharma Red Cell Filtration; WBF: Whole Blood Filtration.
Size of MVs
DLS results depicted the size of MVs shifted significantly from under 100 nm on day 2 to near 200 nm on day 14 (p<0.001) and remained relatively unchanged by day 42. Although the population of MVs in the WBF method seemed smaller at first, we did not observe any significant differences among the filtration sets (p>0.05, Table 1).
Coagulation assays
As EMVs and PS+EMVs elevated with storage time, PT and CT decreased significantly on days 14, 28, and 42 in all three filtration bags (p<0.001, Figure 2); it demonstrates the ability of EMVs to support coagulation. Our results did not show any significant differences among the blood filtration sets (p>0.05, Figure 2). The results also indicated negative moderate correlations between the count of EMVs/μL and PT or CT in the three filtration sets (p<0.001, Figure 3). Moreover, the outcomes of PT assay using EMVs serial dilutions on day 42 proved that the time of coagulation dropped by adding an increasing amount of EMVs to NPP. PT (S) reduced gradually from 1:32 dilution of EMVs (F-RCF: 20.31±1.5, M-RCF: 19.85±0.94, WBF: 20.2±1.6) to 1:2 dilution (F-RCF: 14.3±1.6, M-RCF: 14.55±1.6, WBF: 13.9±1.4. The reductions were significant in 1:8, 1:4, and 1:2 dilutions (p<0.05, Figure 2).
Fig 3.
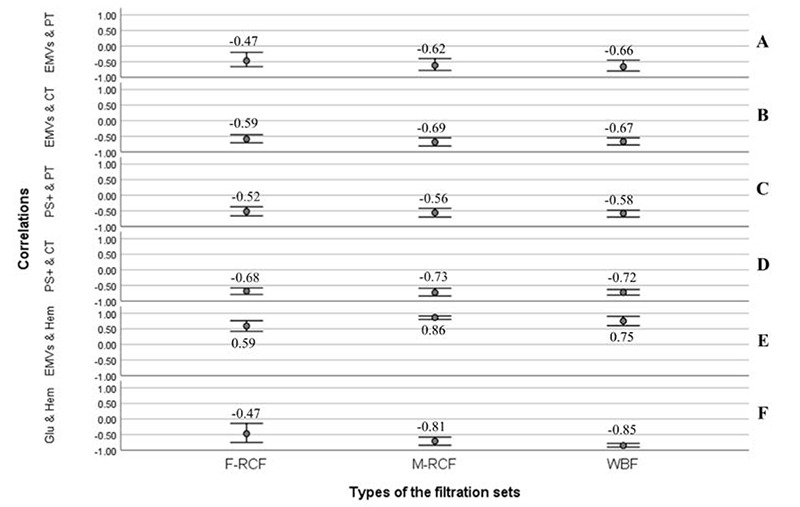
Bivariate correlation analysis (Pearson coefficient). (A and B) Negative relationships between the counts of EMVs & PT (p<0.001) and EMVs & CT (p<0.001), (C and D) Negative relationships between the counts of PS+MVs & PT (p<0.001) and PS+MVs & CT (p<0.001). (E) Positive correlation between the counts of EMVs and hemolysis index (p<0.001). (F) Negative correlation between glucose and hemolysis index (p<0.001). Significant correlations are considered at the level of 0.01. F-RCF: Fresenius Kabi Red Cell Filtration; M-RCF: Macopharma Red Cell Filtration; WBF: Whole Blood Filtration.
Hemolysis index and chemical parameters of RBCs
The hemolysis index rose throughout the storage with the most increment on day 14 (p<0.001, Figure 4). The increment trend of hemolysis was similar among the filters early in storage, although it accelerated in the WBF procedure on days 28 and 42. Besides, the differences were significant between WBF and F-RCF or M-RCF methods on days 28 and 42 so that the percent of hemolysis in WBF was greater than in both RCF sets (p<0.05, Figure 4). Noteworthy that the hemolysis percent of all samples fell within the standard admitted level (<0.8%). In all the three filtration sets, significant diminution in glucose concentration was observed on days 14, 28, and 42, with the most drop occurring on day 14 (p<0.001, Figure 4). Further investigations indicated the rate of glucose reduction in WBF-RBCs was more than in F-RCF or M-RCF-RBCs, and the differences were statistically significant on days 14, 28, and 42 (p<0.001). In contrast, lactate concentration increased significantly (p<0.001), and the greatest level belonged on day 14. Additionally, a significantly higher concentration of lactate was seen in WBF-RBCs compared with F-RCF or M-RCF-RBCs on days 2, 14, 28, and 42 (p<0.001). In general, no significant differences were manifested between F-RCF and M-RCF components in hemolysis index, glucose, and lactate concentrations (p>0.05). More analysis revealed that the hemolysis index was correlated significantly with EMVs/μL count (moderate positive) and glucose concentration (strong negative) in all the filtration sets (Figure 3).
Discussion
Through the current study, we contributed to understanding the possible role of different leukocyte filtration procedures on the characteristics of RBCs during storage. We observed the count of EMVs in WBF-RBCs was significantly higher than in F-RCF on day 42, and the changes in the quality parameters of WBF components were significantly more drastic than in both RCFs. During ex-vivo storage, erythrocytes undergo cytoskeleton reorganization and lose their asymmetrical distribution of phospholipids, so PS exposes to the outer layer.20-22 Increment of EMVs verifies that vesiculation is a part of oxidative damages occurring permanently with the storage.23 In agreement with other studies,3,14,16,23,24 this supports our data that the total numbers of EMVs and PS+EMVs increased significantly in the three filtration sets over time. Though it is also indicated the count of MVs, especially PS+MVs, varies depending on the isolation techniques used in different works,16,24,25
Fig 4.
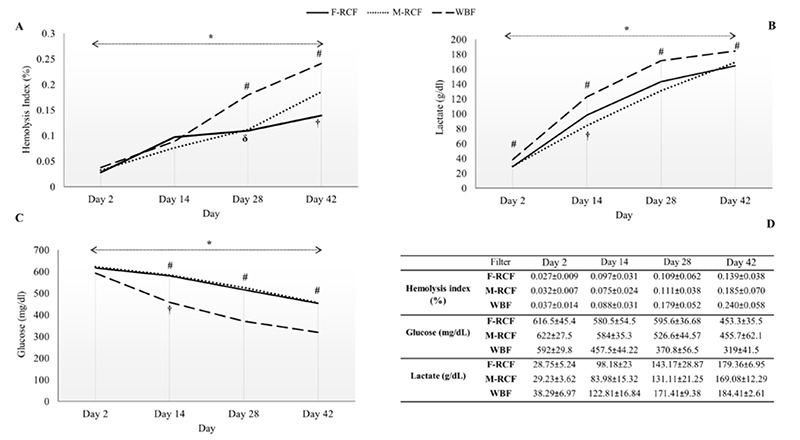
Evaluation of hemolysis index and biochemical parameters of RBCs over the storage time (simple and repeated contrasts). (A) Hemolysis index, (B) lactate concentration, (C) glucose concentration, and (D) Data are presented as mean ± standard deviation. # Significant differences between WBF and F-RCF/ WBF and M-RCF. * Significant differences at the level of 0.05. † The time point when corresponds to the most increment and decrement among the days. δ Time points when did not change significantly compared to the immediate before time. F-RCF: Fresenius Kabi Red Cell Filtration; M-RCF: Macopharma Red Cell Filtration; WBF: Whole Blood Filtration.
Almizraq et al. (2018)3 reported the count of EMVs (by flow cytometry) on day 7 and the concentration of MVs<200 nm and ≥200 nm (using TRPS) on days 43 and 22, respectively, were significantly different between WBF and RCF procedures. Along the same line, Gamonet et al. (2020)23 represented the EMVs population in WBF and M-RCF were greater than other RCF components. On the contrary, Bicalho et al. (2015)16 did not find any significant differences in the concentration of EMVs between the methods. They demonstrated the average MVs size in WBF-RBCs was smaller than RCF. Notably, Freitas et al. (2020)8 by using cryo transmission electron microscopy claimed that due to the accumulation of EMVs in the medium during storage, vesiculation continued within them, which could explain small MVs’ presence. It is also implied that isolation methods and processing differences (such as temperature or the length of pre-storage) are the major sources of contradictions in MVs characterization.24,26 In the present study, all the components were processed under the same condition, and RBCs produced by different filtration sets (n=12 per filter) possessed the same whole blood sources (12 whole blood units were split into 36 equal units). Our findings showed the different filtration sets contained a different number of EMVs and PS+EMVs. Nonetheless, the only statistically significant one was between WBF and F-RCF for EMVs count on day 42. Noteworthy that flow cytometry is not capable of detecting small MVs, so the observed difference could be related to MV>200 nm. DLS analysis revealed the average size of MVs grew as a function of storage in all the RBCs, however, no significant differences were seen among the filtration sets. Taking into account that leukocyte filtration and buffy coat descanting remove platelets and their MVs,3,16,23,26 PMVs number remained unchanged or dropped with the storage. Interestingly, the MFI of CD235a decreased significantly in all the RBCs during storage. Decreased expression of GlyA on older erythrocytes has been described as an innate property of aged-stored RBCs. Enzymes and proteases released from platelets and degraded leukocytes, early in storage, cause destruction and decrement of GlyA.27 Hereupon, we hypothesized that due to the reduction of GlyA on erythrocytes’ surface, it also decreases on the MVs derived from them. Even though donors’ age, sex, and blood groups were similar in this study, high variation in MVs count was observed within the samples, which suggests other factors like underlying exercises or genetics may be involved.28,29 EMVs and PS+EMVs trigger the coagulation process and thrombin generation through several pathways.24,25,30,31 Our results, consistent with others’,13,25,30,31 indicated that significant decrements occurred in coagulation time (PT and CT assays) in RBCs throughout the time, without any significant differences among the filters. Moreover, the inverse correlations between EMVs/μL and the assays verified the possible role of EMVs in coagulation activities and thromboembolic complications, as suggested before.12,30 Further analysis of RBCs demonstrated hemolysis index and lactate concentrations increased while glucose levels decreased as storage time extended, confirming other data.3,18,22,32-34 Owing to erythrocytes’ anaerobic metabolism, glucose is consumed, resulting in decrement and increment of ATP and lactate, respectively. Since blood-containing bags lack the buffering potential, lactate accumulates in the medium.34 Excess amounts of lactate and accumulation of other metabolites cause erythrocyte alterations and dysfunction, which negatively affect the patients’ outcomes.18 Notably, the rate of glucose reduction in WBF-RBCs was significantly more drastic than in both RCF-RBCs. Almizraq et al. (2018)3 reported that ATP concentration (supplied by glucose) was significantly lower in WBF-RBCs. Besides, we found higher lactate concentration in WBF-RBCs. The storage of RBCs in artificial conditions disrupts the metabolic mechanisms resulting in morphology changes and reduction of deformability of erythrocytes, so they become more susceptible to lysis.22,34,35 In addition, more glucose intake causes more ATP depletion, on which erythrocyte integrity depends, resulting in hemolysis and EMVs shedding rising.5 Previous studies have manifested that hemolysis and fragmentation of erythrocytes in RBCs lead to an increment of free and vesicular Hb, both of which scavenge nitric oxide; it causes endothelial cell dysfunction in the patients.7,13,36 Our study, like other works,3,16 displayed that the hemolysis rate increased with storage in all the components, and it was higher in WBF-RBCs. Howbeit, the hemolysis index in all samples was within the standard range. Furthermore, our results signified that severe biochemical and structural changes occurred early and late in the storage time, respectively, consistent with other works.3,5,7,8 In conclusion, our results manifested that except for day 42, which is the last day of storage, there was no significant difference in the count of EMVs among the different leukocyte filtration sets. Although the changes in the hemolysis index in WBF components were more severe, none of the products exceeded the standard limits. Accordingly, all three filtration sets can be considered. Nevertheless, the reasons for the differences and their possible influences on the erythrocytes’ post-transfusion survival and clinical outcomes are worthy of further investigation.
Acknowledgments
We sincerely acknowledge the efforts of Dr. Deyhim, Mrs. Golzadeh, and the staff of the Coagulation Lab, Quality Control laboratory, and Center of Innovation of IBTO.
List of acronyms
- CT
clotting time
- DLS
dynamic light scattering
- EMVs
erythrocytes-derived microvesicles
- FITC
fluorescein isothiocyanate
- F-RCF
Fresenius red cell filtration
- IBTO
Iranian Blood Transfusion Organization
- MFI
median fluorescence intensity
- M-RCF
Macopharma red cell filtration
- MVs
microvesicles
- NPP
normal pooled plasma
- PBS
phosphate buffer solution
- PDI
polydispersity index
- PMVs
platelet-derived MVs
- PS+MVs
phosphatidylserine-positive MVs
- PT
prothrombin time
- RBCs
red blood cell components
- RCF
red cell filtration
- RT
room temperature
- SAGM
saline-adenine-glucose-mannitol
- WBF
whole blood filtration
Funding Statement
Funding: This study was granted by AJA University of Medical Sciences.
Contributor Information
Fateme Roshanzamir, Email: fatemelab@gmail.com.
Mahin Nikougoftar Zarif, Email: nikougoftar@gmail.com.
Ali Arabkhazaeli, Email: a.khazaeli@tmi.ac.ir.
Mahshid Mohammadipour, Email: mahshid127@yahoo.com.
References
- 1.Gamonet C, Mourey G, Aupet S, Biichle S, Petitjean R, Vidal C, Pugin A, Naegelen C, Tiberghien P, Morel P, Angelot-Delettre F, Seilles E, Saas P, Bardiaux L, Garnache-Ottou F. How to quantify microparticles in RBCs? A validated flow cytometry method allows the detection of an increase in microparticles during storage. Transfusion. 2017. Mar;57(3):504-516. doi: 10.1111/trf.13989. [DOI] [PubMed] [Google Scholar]
- 2.Maheen R, Yasir A, Omar N, Nazish M, Navida M, Rao SA, Muhammad R, Shahida M. Levels of red blood cells derived microparticles in stored erythrocyte concentrate. Afr J Pharm Pharmacol. 2020. Jul 31;14(6):185-91. doi: 10.5897/AJPP2020.5126 [Google Scholar]
- 3.Almizraq RJ, Holovati JL, Acker JP. Characteristics of Extracellular Vesicles in Red Blood Concentrates Change with Storage Time and Blood Manufacturing Method. Transfus Med Hemother. 2018. May;45(3):185-193. doi: 10.1159/000486137. [DOI] [PMC free article] [PubMed] [Google Scholar]
- 4.Pandey P, Pande A, Setya D, Kumar P, Shanker A. Comparative Study for Measurement of Residual Leucocytes in Leucodepleted Red Blood Cells by Two Different Methods. Indian J Hematol Blood Transfus. 2020. Oct;36(4):740-744. doi: 10.1007/s12288-020-01325-5. [DOI] [PMC free article] [PubMed] [Google Scholar]
- 5.Almizraq R, Tchir JD, Holovati JL, Acker JP. Storage of red blood cells affects membrane composition, microvesiculation, and in vitro quality. Transfusion. 2013. Oct;53(10):2258-67. doi: 10.1111/trf.12080. [DOI] [PubMed] [Google Scholar]
- 6.Delobel J, Barelli S, Canellini G, Prudent M, Lion N, Tissot JD. Red blood cell microvesicles: a storage lesion or a possible salvage mechanism ISBT Sci Ser. 2016. Jan;11(S1):171-7. doi.org/10.1111/voxs.12179. [Google Scholar]
- 7.Hashemi Tayer A, Amirizadeh N, Mghsodlu M, Nikogoftar M, Deyhim MR, Ahmadinejad M. Evaluation of blood storage lesions in leuko-depleted red blood cell units. Iranian J Ped Hematol Oncol. 2017. Jul 10;7(3):171-9. [Google Scholar]
- 8.Freitas Leal JK, Lasonder E, Sharma V, Schiller J, Fanelli G, Rinalducci S, Brock R, Bosman G. Vesiculation of Red Blood Cells in the Blood Bank: A Multi-Omics Approach towards Identification of Causes and Consequences. Proteomes. 2020. Mar 31;8(2):6. doi: 10.3390/proteomes8020006. [DOI] [PMC free article] [PubMed] [Google Scholar]
- 9.Kent MW, Kelher MR, West FB, Silliman CC. The pro-inflammatory potential of microparticles in red blood cell units. Transfus Med. 2014. Jun;24(3):176-81. doi: 10.1111/tme.12123. [DOI] [PMC free article] [PubMed] [Google Scholar]
- 10.Konoshenko MY, Lekchnov EA, Vlassov AV, Laktionov PP. Isolation of Extracellular Vesicles: General Methodologies and Latest Trends. Biomed Res Int. 2018. Jan 30;2018:8545347. doi: 10.1155/2018/8545347. [DOI] [PMC free article] [PubMed] [Google Scholar]
- 11.Rubin O, Canellini G, Delobel J, Lion N, Tissot JD. Red blood cell microparticles: clinical relevance. Transfus Med Hemother. 2012. Oct;39(5):342-7. doi: 10.1159/000342228. Epub 2012 Aug 27. [DOI] [PMC free article] [PubMed] [Google Scholar]
- 12.Hashemi Tayer A, Amirizadeh N, Ahmadinejad M, Nikougoftar M, Deyhim MR, Zolfaghari S. Procoagulant Activity of Red Blood Cell-Derived Microvesicles during Red Cell Storage. Transfus Med Hemother. 2019. Aug;46(4):224-230. doi: 10.1159/000494367. Epub 2018 Nov 13. [DOI] [PMC free article] [PubMed] [Google Scholar]
- 13.Thangaraju K, Neerukonda SN, Katneni U, Buehler PW. Extracellular Vesicles from Red Blood Cells and Their Evolving Roles in Health, Coagulopathy and Therapy. Int J Mol Sci. 2020. Dec 25;22(1):153. doi: 10.3390/ijms22010153. [DOI] [PMC free article] [PubMed] [Google Scholar]
- 14.Almizraq RJ, Norris PJ, Inglis H, Menocha S, Wirtz MR, Juffermans N, Pandey S, Spinella PC, Acker JP, Muszynski JA. Blood manufacturing methods affect red blood cell product characteristics and immunomodulatory activity. Blood Adv. 2018. Sep 25;2(18):2296-2306. doi: 10.1182/bloodadvances.2018021931. [DOI] [PMC free article] [PubMed] [Google Scholar]
- 15.Heddle NM, Arnold DM, Acker JP, Liu Y, Barty RL, Eikelboom JW, Webert KE, Hsia CC, O'Brien SF, Cook RJ. Red blood cell processing methods and in-hospital mortality: a transfusion registry cohort study. Lancet Haematol. 2016. May;3(5):e246-54. doi: 10.1016/S2352-3026(16)00020-X. [DOI] [PubMed] [Google Scholar]
- 16.Bicalho B, Pereira AS, Acker JP. Buffy coat (top/bottom)- and whole-blood filtration (top/top)-produced red cell concentrates differ in size of extracellular vesicles. Vox Sang. 2015. Oct;109(3):214-20. doi: 10.1111/vox.12272. [DOI] [PubMed] [Google Scholar]
- 17.Menck K, Bleckmann A, Schulz M, Ries L, Binder C. Isolation and Characterization of Microvesicles from Peripheral Blood. J Vis Exp. 2017. Jan 6;(119):55057. doi: 10.3791/55057. [DOI] [PMC free article] [PubMed] [Google Scholar]
- 18.Ghezelbash B, Azarkeivan A, Pourfathollah AA, Deyhim M, Hajati E, Goodarzi A. Comparative Evaluation of Biochemical and Hematological Parameters of Pre-Storage Leukoreduction during RBC Storage. Int J Hematol Oncol Stem Cell Res. 2018. Jan 1;12(1):35-42. [PMC free article] [PubMed] [Google Scholar]
- 19.Sawant RB, Jathar SK, Rajadhyaksha SB, Kadam PT. Red cell hemolysis during processing and storage. Asian J Transfus Sci. 2007. Jul;1(2):47-51. doi: 10.4103/0973-6247.33446. [DOI] [PMC free article] [PubMed] [Google Scholar]
- 20.Almizraq RJ, Seghatchian J, Acker JP. Extracellular vesicles in transfusion-related immunomodulation and the role of blood component manufacturing. Transfus Apher Sci. 2016. Dec;55(3):281-291. doi: 10.1016/j.transci.2016.10.018. [DOI] [PubMed] [Google Scholar]
- 21.Rubin O, Crettaz D, Canellini G, Tissot JD, Lion N. Microparticles in stored red blood cells: an approach using flow cytometry and proteomic tools. Vox Sang. 2008. Nov;95(4):288-97. doi: 10.1111/j.1423-0410.2008.01101.x. [DOI] [PubMed] [Google Scholar]
- 22.Rubin O, Crettaz D, Tissot JD, Lion N. Microparticles in stored red blood cells: submicron clotting bombs? Blood Transfus. 2010. Jun;8 Suppl 3(Suppl 3):s31-8. doi: 10.2450/2010.006S. [DOI] [PMC free article] [PubMed] [Google Scholar]
- 23.Gamonet C, Desmarets M, Mourey G, Biichle S, Aupet S, Laheurte C, François A, Resch E, Bigey F, Binda D, Bardiaux L, Naegelen C, Marpaux N, Delettre FA, Saas P, Morel P, Tiberghien P, Lacroix J, Capellier G, Vidal C, Garnache-Ottou F. Processing methods and storage duration impact extracellular vesicle counts in red blood cell units. Blood Adv. 2020. Nov 10;4(21):5527-5539. doi: 10.1182/bloodadvances.2020001658. [DOI] [PMC free article] [PubMed] [Google Scholar]
- 24.Fouda R, Enein AA, El-Desoukey NA, Elfetouh RM, Hafez AM. Impact of storage, leukofiltration, and ascorbic acid fortification on red cell-derived microparticles in stored packed red blood cells: A flow cytometric and procoagulant study. J Appl Hematol. 2020. Apr 1;11(2):51. doi: 10.4103/joah.joah_76_19. [Google Scholar]
- 25.Aung HH, Tung JP, Dean MM, Flower RL, Pecheniuk NM. Procoagulant role of microparticles in routine storage of packed red blood cells: potential risk for prothrombotic post-transfusion complications. Pathology. 2017. Jan;49(1):62-69. doi: 10.1016/j.pathol.2016.10.001. [DOI] [PubMed] [Google Scholar]
- 26.Bakkour S, Acker JP, Chafets DM, Inglis HC, Norris PJ, Lee TH, Busch MP. Manufacturing method affects mitochondrial DNA release and extracellular vesicle composition in stored red blood cells. Vox Sang. 2016. Jul;111(1):22-32. doi: 10.1111/vox.12390. [DOI] [PubMed] [Google Scholar]
- 27.Sparrow RL, Healey G, Patton KA, Veale MF. Red blood cell age determines the impact of storage and leukocyte burden on cell adhesion molecules, glycophorin A and the release of annexin V. Transfus Apher Sci. 2006. Feb;34(1):15-23. doi: 10.1016/j.transci.2005.09.006. [DOI] [PubMed] [Google Scholar]
- 28.Noulsri E, Palasuwan A. Effects of donor age, donor sex, blood-component processing, and storage on cell-derived microparticle concentrations in routine blood-component preparation. Transfus Apher Sci. 2018. Aug;57(4):587-592. doi: 10.1016/j.transci.2018.07.018. [DOI] [PubMed] [Google Scholar]
- 29.Nemkov T, Skinner SC, Nader E, Stefanoni D, Robert M, Cendali F, Stauffer E, Cibiel A, Boisson C, Connes P, D'Alessandro A. Acute Cycling Exercise Induces Changes in Red Blood Cell Deformability and Membrane Lipid Remodeling. Int J Mol Sci. 2021. Jan 18;22(2):896. doi: 10.3390/ijms22020896. [DOI] [PMC free article] [PubMed] [Google Scholar]
- 30.Noubouossie DF, Henderson MW, Mooberry M, Ilich A, Ellsworth P, Piegore M, Skinner SC, Pawlinski R, Welsby I, Renné T, Hoffman M, Monroe DM, Key NS. Red blood cell microvesicles activate the contact system, leading to factor IX activation via 2 independent pathways. Blood. 2020. Mar 5;135(10):755-765. doi: 10.1182/blood.2019001643. [DOI] [PMC free article] [PubMed] [Google Scholar]
- 31.Stavrou EX. Thromboinflammatory effects of RBC microvesicles. Blood. 2020. Mar 5;135(10):708-709. doi: 10.1182/blood.2020004985. [DOI] [PMC free article] [PubMed] [Google Scholar]
- 32.Grisendi G, Finetti E, Manganaro D, Cordova N, Montagnani G, Spano C, Prapa M, Guarneri V, Otsuru S, Horwitz EM, Mari G, Dominici M. Detection of microparticles from human red blood cells by multiparametric flow cytometry. Blood Transfus. 2015. Apr;13(2):274-80. doi: 10.2450/2014.0136-14. Epub 2014 Oct 23. [DOI] [PMC free article] [PubMed] [Google Scholar]
- 33.Marabi PM, Musyoki SK, Amayo A. Evaluation of cellular changes in blood stored for transfusion at Bungoma County Referral Hospital, Kenya. Pan Afr Med J. 2021. Mar 17;38:280. doi: 10.11604/pamj.2021.38.280.22327. [DOI] [PMC free article] [PubMed] [Google Scholar]
- 34.Oyet C, Okongo B, Onyuthi RA, Muwanguzi E. Biochemical changes in stored donor units: implications on the efficacy of blood transfusion. J Blood Med. 2018. Jun 25;9:111-115. doi: 10.2147/JBM.S163651. [DOI] [PMC free article] [PubMed] [Google Scholar]
- 35.Verma M, Dahiya K, Malik D, Sehgal PK, Devi R, Soni A, Ghalaut VG. Effect of blood storage on complete biochemistry. J Blood Disord Transfus. 2015;6(6):1-4. doi: 10.4172/2155-9864.1000329. [Google Scholar]
- 36.Dinkla S, Peppelman M, Van Der Raadt J, Atsma F, Novotný VM, Van Kraaij MG, Joosten I, Bosman GJ. Phosphatidylserine exposure on stored red blood cells as a parameter for donor-dependent variation in product quality. Blood Transfus. 2014. Apr;12(2):204-9. doi: 10.2450/2013.0106-13. [DOI] [PMC free article] [PubMed] [Google Scholar]