. 2022 Oct 11;11:e79966. doi: 10.7554/eLife.79966

Figure 5. The wound epithelium is involved in resorption induction.

(A) Time course of resorption during zeugopod regeneration upon full skin flap (FSF) surgery. Calcein-stained axolotls were amputated at the distal end of the calcified tissue. Arrowheads: resorption in control cases. Scale bar: 1 mm (n=9). (B) Alcian blue/alizarin red staining of limbs at 25 dpa after FSF surgery. Arrowhead: resorption of distal radius. Scale bar: 1 mm (n=9). (C) In situ hybridization (ISH) for Ctsk in limb sections at 9 dpa after FSF surgery. Scale bar: 500 µm (n=3 for control, n=4 for FSF). (D) Whole mount ISH (WISH) for Krt17 in limbs upon zeugopod amputation at different dpa. Dashed lines: skeletal elements position. Scale bar: 500µm (n=3). (E) Masson’s trichrome staining from limb sections upon zeugopod amputation at different dpa. Yellow arrowheads: beginning of wound epithelium. White arrowheads: osteoclasts (n=3). (F) Inset from (E) 5 dpa. Scale bar: 200µm. (G) Inset from (E) 7dpa. White arrowheads: osteoclasts. Scale bar: 200µm. (H) Quantification of position of osteoclasts in zeugopod at 7 dpa. Each dot represents an osteoclast. Position of wound epithelium (WE) is shown with a red line. Image of a quantified section shows the position of osteoclasts in the sample (three independent experiments, n=101).

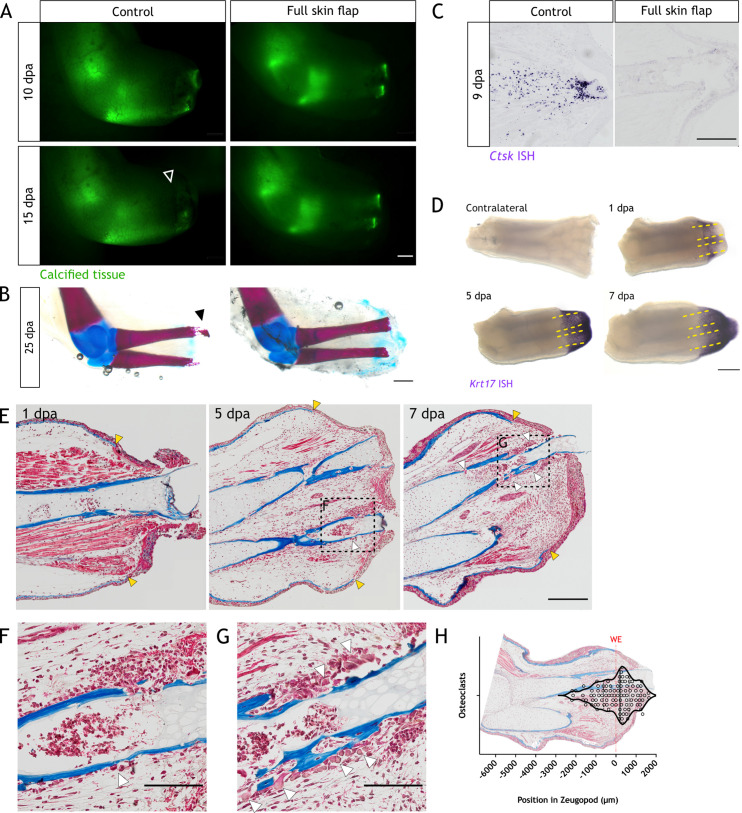
Figure 5.

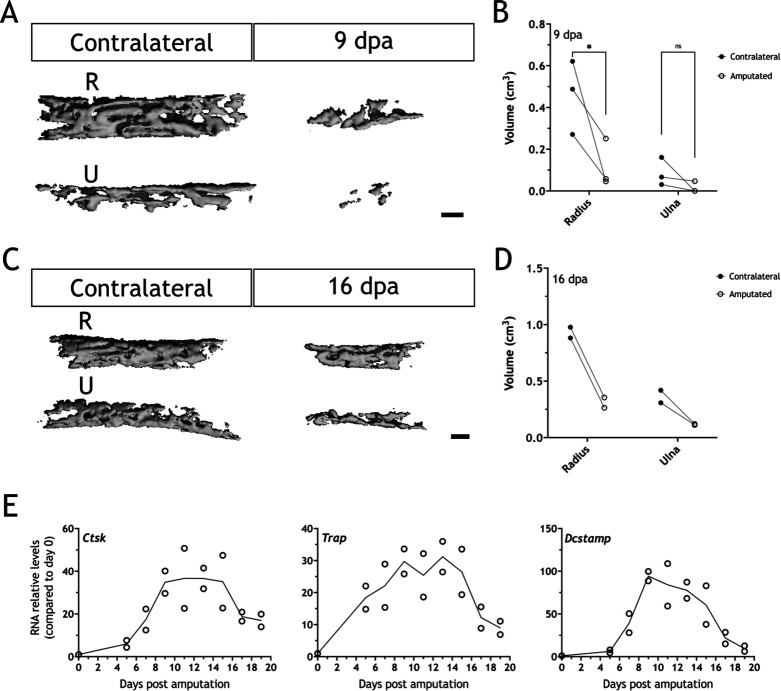
Figure 5—figure supplement 1. Bones are resorbed upon amputation in 16cm snout-to-tail axolotls.

Figure 5—figure supplement 1.

(A) Three-dimensional (3D) reconstructions from µCT scans for radius (R) and ulna (U) in the contralateral and a 9 dpa limb upon amputation at the distal end of the calcified tissue. Scale bar: 200µm (n=3). (B) Quantification of bones volume (cm3) for samples in (A). Each dot represents an animal (n=3; * p<0.05, two-way ANOVA, Bonferroni’s multiple comparisons test, contralateral versus amputated). (C) 3D reconstructions from µCT scans for radius and ulna in the contralateral and a 16 dpa limb upon amputation at the distal end of the calcified tissue. Scale bar: 200µm (n=2). (D) Quantification of bones volume (cm3) for samples in (C). Each dot represents an animal (n=2). (E) RT-qPCR for Ctsk, Trap, and Dcstamp at different dpa upon zeugopodial amputation. Solid line represents mean, each dot is an animal (n=2).
Figure 5—figure supplement 2. Ctsk+ cells are located in the vicinity of the wound epithelium (WE) at 7 dpa.

Figure 5—figure supplement 2.

(A) Left: eGFP+ cells from Ctsk:eGFP axolotl at 7 dpa. Hoechst was used for nuclear staining (white). Middle: Masson’s trichrome staining of same section. Right: overlay of eGFP image in Masson’s trichrome image. Yellow arrowheads: beginning of wound epithelium. Scale bar: 500 µm (n=3). (B) Quantification of position of eGFP+ cells in zeugopod at 7 dpa. Each dot represents an osteoclast. Position of WE is shown with a red line. Image of a quantified section shows the position of osteoclasts in the sample (three independent experiments, n=135).