Abstract
Background
Bone nonunion is a serious complication of fracture. This study explored the differentially expressed lncRNAs (DELs) and mRNAs (DEGs) and identified potential lncRNA-mRNA interactions in bone nonunion.
Methods
We extracted total RNA from three bone nonunion and three bone union patient tissue samples. RNA sequencing was performed to detect DELs and DEGs between bone nonunion and union tissue samples. The lncRNAs and genes with absolute log2-fold change (log2FC) > 1 and adjusted p value < 0.05 were further chosen for gene ontology (GO) and Kyoto Encyclopedia of Genes and Genomes (KEGG) enrichment analysis. lncRNA and targeted mRNA interaction networks were constructed.
Results
We observed 179 DELs and 415 DEGs between the bone nonunion and union tissue samples. GO analysis indicated that DELs and DEGs were mainly enriched in the chondroitin sulfate proteoglycan biosynthetic process. DELs and DEGs were enriched in “ECM-receptor interaction” and “Staphylococcus aureus infection” KEGG pathways. Several potential lncRNA-mRNA interactions were also predicted.
Conclusions
This study identified bone nonunion-associated lncRNAs and mRNAs using deep sequencing that may be useful as potential biomarkers for bone nonunion.
1. Introduction
Bone nonunion, a serious complication of fracture, occurs in approximately 5–10% of patients with bone fractures [1–7]. Infected bone nonunion is caused by many factors, including fractures and accidents. Bone nonunion may lead to delayed union and amputation, which further contributes to functional limitation, disability, and poor quality of life [1, 2]. The most common causes of bone nonunion include infection, insufficient local blood supply, separation of fracture ends, and insufficient fracture stabilization [8, 9]. The use of antibiotics has improved the treatment of bone infections, but bone nonunion remains an obstacle in the repair of damaged bone [3, 4].
Currently, nonunion is a serious challenge in the treatment of bone loss associated with bone infections. The process of bone remodeling includes the breakdown and resorption of bone and the formation of new bone. Osteoclasts are responsible for bone breakdown and resorption, whereas osteoblasts are responsible for new bone formation. Osteoclasts attach to the older bone area, secrete acidic substances to dissolve minerals, secrete protease to digest the bone matrix, and form bone resorption lacuna. Subsequently, osteoblasts migrate to the resorbed site and secrete the bone matrix that is then mineralized to form new bone. The balance between osteoclastic and osteogenic processes is substantial in maintaining the normal bone mass. However, this balance is compromised because resorption replaces formation in case of bone infection, resulting in bone loss or bone nonunion [10]. A previous study indicated that differentially expressed miRNAs might be a potential diagnostic and therapeutic biomarker for infected tibial nonunion [11]. Additionally, the data from the GEO dataset indicated that ADAMTS18 and TGFBR3 genes were differentially expressed in nonunion skeletal fracture [12]. Moreover, the coinjection of BMP and DCN into the bone nonunion area could improve the induction of bone formation [13, 14]. However, the exact molecular mechanisms underlying bone nonunion remain unclear at present. Therefore, it is critical to explore the etiological mechanism of bone nonunion and to develop new targets for the diagnosis and treatment of infected bone nonunion.
Long noncoding RNAs (lncRNAs) are a class of RNAs longer than 200 nucleotides. Previous studies have indicated that lncRNAs can act as master regulators, affecting target gene expression levels [15]. Growing evidence suggests that lncRNAs are involved in the epigenetic regulation of gene expression, transcription, cell death, and other important biological processes [16, 17]. Previous reports showed that many lncRNAs are related to osteoclast and osteoblast cell functions. For instance, lncGHET1, lncRhno1, lncTUG1, and lncUCA1 are identified to be involved with osteoblast proliferation and differentiation [18–21], whereas lncXIST [22], lncNeat1 [23], and lncCRNDE [24] are reported to be associated with osteoclast differentiation. However, at present, there is insufficient information on specific lncRNAs involved in bone nonunion.
In this study, we obtained bone nonunion and union tissue samples from patient fracture sites. We performed transcriptome sequencing of these tissues to determine the differentially expressed lncRNAs (DELs) and differentially expressed mRNAs (DEGs) and identify potential lncRNA-mRNA interactions. Our findings may provide new insights to further elucidate the pathogenesis of, and develop biomarkers for, bone nonunion.
2. Methods
2.1. Sample Collection
The samples used in this study were obtained from three patients with normal fracture healing and three patients with bone nonunion (Table 1). The specimens were collected from the normal healing fracture site and scar tissue approximately 3 mm in size at the bone nonunion site. The diagnosis of bone nonunion was based on the definition given by the Food and Drug Administration. First, the fractures went unhealed for six months and there was no further healing trend within three months. Clinical X-ray examination was performed to confirm bone nonunion, and surgery further confirmed the formation of a small amount of scar tissue and callus at the fracture end or with only a small amount of scar tissue. None of the patients included in the study had infections, tumors, autoimmune diseases, bone nonunion caused by pathological fractures, history of hormone use, and history of smoking.
Table 1.
Basic characteristics of enrolled patients.
| Sample | Sex | Age (years) | Location | Healing status |
|---|---|---|---|---|
| No. 1 | Male | 41 | Left humerus | Union |
| No. 2 | Male | 45 | Right tibia | Union |
| No. 3 | Male | 24 | Right femur | Union |
| No. 4 | Male | 47 | Right humerus | Nonunion |
| No. 5 | Male | 46 | Left tibia | Nonunion |
| No. 6 | Male | 25 | Left femur | Nonunion |
2.2. Total RNA Extraction
We extracted total RNA using TRIzol reagent following the manufacturer's protocol. The absorbance ratio at 260/280 nm (A260/A280) was measured using SmartSpec Plus to determine the concentration and purity of the isolated RNA. The integrity of the extracted RNA was confirmed using electrophoresis (1.5% agarose gel). The RNA was then transcribed into first-strand cDNA using the First-Strand cDNA Synthesis Kit (TaKaRa) for performing gene expression analysis.
2.3. lncRNA and mRNA Sequencing
We used 3 μg RNA per sample for sample preparation. Following ribosomal RNA (rRNA) depletion, the RNA was fragmented and a cDNA library was constructed using the VAHTS Total RNA-seq (HMR) Library Prep Kit. Libraries were sequenced on an Illumina HiSeq 2500 platform according to the manufacturer's instructions, and 125 bp paired-end reads were produced (Table S1 & S2). DELs and DEGs between samples were identified using the Cuffdiff program in the Cufflinks package. As cutoff criteria, p values < 0.05 and |log2FC| > 1 were used.
2.4. Analysis of DELs and DEGs
Gene Ontology (GO) Enrichment and Kyoto Encyclopedia of Genes and Genomes (KEGG) pathway analysis for these DEGs and predicted target genes for DELs were conducted using the clusterProfiler R package. We obtained all the gene sets used in these functional annotations from the DAVID database. p values were adjusted by Benjamini & Hochberg methods, and FDR < 0.05 was defined as significantly enriched.
2.5. Prediction of Cis- and Trans-Regulated Target Genes of DELs
lncRNAs directly regulate adjacent target genes in the genome and this is termed cis-acting regulation. According to the taxonomic annotation information of lncRNA, neighboring known genes are predicted to be potential cis-regulated target genes. lncRNAs that are located far from their target genes play an indirect regulatory role through sequence complementarity, which is referred to as trans-acting regulation. We used RepeatMasker to search the Alu repeat structure of lncRNAs and 3′-UTRs. We used BLASTN sequence alignment to search for complementary sequence regions of lncRNAs and 3′-UTRs. The thermodynamic stability and binding ability of complexes formed by lncRNAs and 3′-UTRs were predicted by RNAplex and RIsearch, with an aim to predict trans-regulated target genes of lncRNAs.
3. Results
3.1. Boxplot and Principal Component Analysis (PCA) Diagram
Boxplots describe data using five statistics, including the minimum, first quartile (25%), median (50%), third quartile (75%), and maximum. Through boxplots, we can gauge the symmetry of the data and the degree of dispersion of the distribution. As shown in Figure 1(a), we observed that the gene expression level of samples 1–5 was stable, while sample N6 was different, which may have been caused by a more serious fracture in patient 6.
Figure 1.
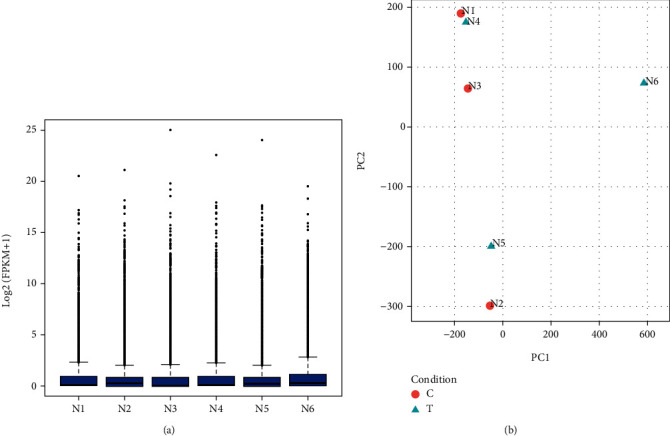
Transcript expression abundance and PCA plot of samples. (a) Boxplot of known transcript expression abundance; (b) PCA plot of the sample.
It is possible to observe the similarity between samples through PCA plots. The closer the distance between samples on the PCA diagram, the closer the expression trend of sample genes is. As shown in Figure 1(b), the PCA diagram revealed that the expression features of samples 1–5 were similar, while sample N6 was different, which may be caused by a more serious fracture in patient 6.
3.2. Differential Expression of mRNAs and lncRNAs
As shown in Figure 2, a volcano plot of DELs between normal fracture healing and bone nonunion tissue samples indicated 167 upregulated lncRNAs and 12 downregulated lncRNAs (Figures 2(a) and 2(b)). Additionally, 195 DEGs were upregulated and 220 DEGs were downregulated (Figures 3(a) and 3(b)). Figures 2(c) and 3(c) are cluster heatmaps of DELs and DEGs, respectively, indicating a large difference in the expression between normal fracture healing and bone nonunion tissue samples. The top 10 DELs and DEGs were indicated in Tables 2 and 3, respectively. Additionally, we annotated and classified the studied lncRNAs and they were mainly divided into intergenic lncRNAs, sense lncRNAs, intronic lncRNAs, antisense lncRNAs, sRNA host lncRNAs, enhancer lncRNAs, and bidirectional lncRNAs, accounting for 75.1%, 15.3%, 3.4%, 2.8%, 1.7%, and 0.6%, respectively (Figure S1).
Figure 2.
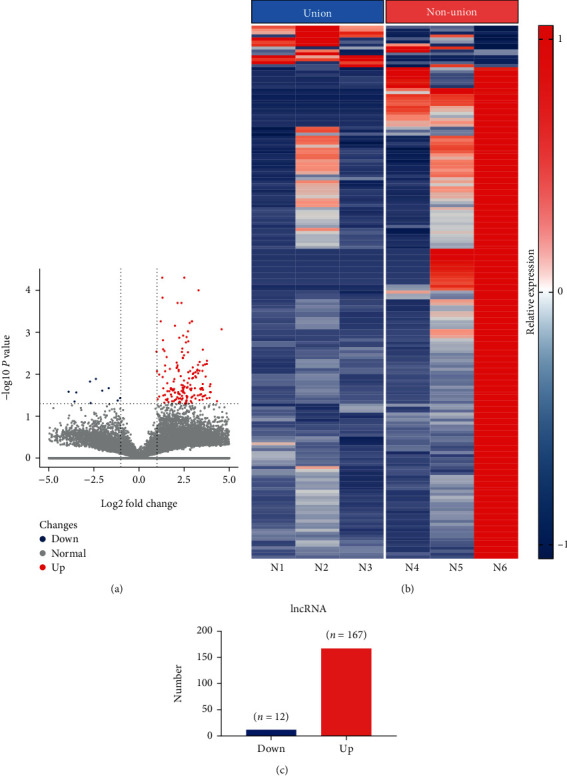
Differential expression of lncRNAs (DELs) between bone nonunion and union tissues. (a) Volcano plot showing DELs; (b) 179 DELs between bone nonunion and union group comprising 12 downregulated lncRNAs and 167 upregulated lncRNAs; (c) heatmap of DELs. T1, T2, and T3: bone union group; T4, T5, and T6: bone nonunion group.
Figure 3.
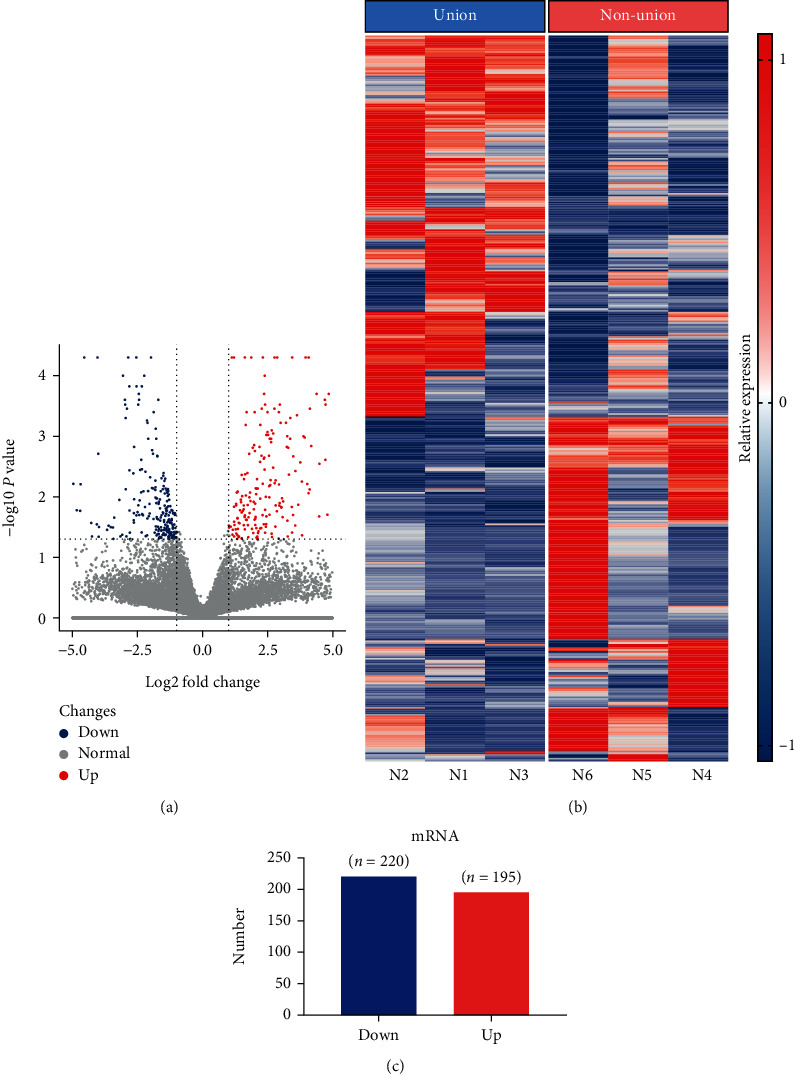
Differential expression of genes (DEGs) between bone nonunion and union tissues. (a) Volcano plot showing DEGs; (b) 415 DELs between bone nonunion and union group comprising 220 downregulated genes and 195 upregulated genes; (c) heatmap of DEGs. T1, T2, and T3: bone union group; T4, T5, and T6: bone nonunion group.
Table 2.
Top 10 differentially expressed lncRNAs.
| Gene ID | Gene | Locus | log2 (fold change) | p value |
|---|---|---|---|---|
| Upregulated lncRNAs | ||||
| ENST00000485567 | FN1 | 2:216225162-216300895 | 30.494 | 0.0017 |
| ENST00000605228 | RP1 | 1:182403027-182403596 | 5.023756571 | 0.00845 |
| ENST00000603389 | WI2 | 2:16330518-16330662 | 4.381871684 | 0.044 |
| ENST00000452690 | RP11 | X:40122130-40146973 | 3.95783 | 0.01945 |
| ENST00000420417 | RP11 | 8:99973655-99980512 | 3.94771 | 0.0366 |
| ENST00000366224 | RP11 | X:47157250-47158120 | 3.9219 | 0.02685 |
| ENST00000331301 | AP002387.1 | 11:71093646-71134469 | 3.90025 | 0.02675 |
| ENST00000550756 | OLA1P3 | 12:56263831-56266386 | 3.88772 | 0.0173 |
| ENST00000475135 | DPPA4 | 3:109044987-109056419 | 3.79153 | 0.0377 |
| ENST00000603371 | RP11 | X:35882974-35887748 | 3.78534 | 0.0057 |
| Down-regulated lncRNAs | ||||
| ENST00000463060 | COL6A1 | 21:47401650-47424964 | −33.8802 | 0.00215 |
| ENST00000546357 | EMP1 | 12:13349649-13369708 | −11.3747 | 0.0211 |
| ENST00000577048 | AF001548.6 | 16:15005407-16444465 | −3.90021 | 0.0262 |
| ENST00000563492 | CDH11 | 16:64977655-65160015 | −3.54485 | 0.04475 |
| ENST00000522659 | FABP4 | 8:82351670-82445510 | −3.4878 | 0.0273 |
| ENST00000573866 | SNORD3D | 17:19015312-19015949 | −2.80835 | 0.01495 |
| ENST00000550557 | NR4A1 | 12:52416615-52453291 | −2.6977 | 0.04875 |
| ENST00000497048 | KLF4 | 9:110247132-110252763 | −2.3589 | 0.01295 |
| ENST00000566457 | CTD | 8:22532053-22541522 | −1.9616 | 0.0247 |
| ENST00000569449 | RP11 | 4:156655599-156658214 | −1.05101 | 0.0372 |
Table 3.
Top 10 differentially expressed genes.
| Gene ID | Gene | Locus | log2 (fold change) | p value |
|---|---|---|---|---|
| Upregulated genes | ||||
| ENST00000457143 | ATP5J | 21:26931715-27589700 | 45.5374 | 0.04015 |
| ENST00000539409 | FAM60A | 12:31433517-31479992 | 11.9547 | 0.03395 |
| ENST00000401325 | AC009695.1 | 8:21351538-21351627 | 11.40504571 | 0.044 |
| ENST00000582836 | AC003035.1 | X:14093909-14094010 | 10.67193906 | 0.044 |
| ENST00000365209 | Y_RNA | 1:247458136-247458243 | 9.618411199 | 0.044 |
| ENST00000363299 | RNU5D-1 | 1:45196726-45196842 | 8.430795412 | 0.03395 |
| ENST00000435777 | COL22A1 | 8:139600477-139926249 | 5.3695 | 0.0358 |
| ENST00000226284 | IBSP | 4:88720732-88733074 | 4.97665 | 5.00E − 05 |
| ENST00000324559 | ANO5 | 11:22214721-22304903 | 4.81686 | 0.0002 |
| ENST00000361131 | PPP1R14C | 6:150464211-150571493 | 4.57736 | 0.00285 |
| Down-regulated genes | ||||
| ENST00000505243 | RPS3A | 4:152020724-152246795 | −142.886 | 0.0414 |
| ENST00000502527 | VCAN | 5:82767283-82878122 | −17.498 | 0.015 |
| ENST00000455022 | UTRN | 6:144606290-145174170 | −13.8992 | 0.0163 |
| ENST00000390603 | IGHV3-15 | 14:105992939-107283280 | −5.23362 | 0.00945 |
| ENST00000512158 | CXCL14 | 5:134895266-134970564 | −5.00246 | 0.02945 |
| ENST00000326245 | ITLN1 | 1:160846328-160854960 | −4.95648 | 0.0061 |
| ENST00000390600 | IGHV3-9 | 14:105992939-107283280 | −4.88897 | 0.01665 |
| ENST00000492446 | IGKV1D-16 | 2:90139077-90139580 | −4.76505 | 0.01705 |
| ENST00000390598 | IGHV3-7 | 14:105992939-107283280 | −4.73485 | 0.0062 |
| ENST00000343267 | APOD | 3:195295572-195311076 | −4.44718 | 5.00E − 05 |
3.3. Function and Pathway Predictive Analysis of DELs and DEGs
The biological processes (BP), cellular components (CC), and molecular functions (MF) of DEGs and DELs were analyzed using the DAVID database. GO analysis of DELs in terms of MF showed carbohydrate derivative transporter activity and Se-containing compound transmembrane transporter activity as most enriched. GO analysis of DELs in terms of CC was enriched in the CD95 death-inducing signaling complex in cellular components and smooth muscle contractile fiber. GO analysis of DELs in terms of BP was predominantly enriched in the regulation of peptidase activity and dermatan sulfate proteoglycan metabolic process (Figure 4).
Figure 4.
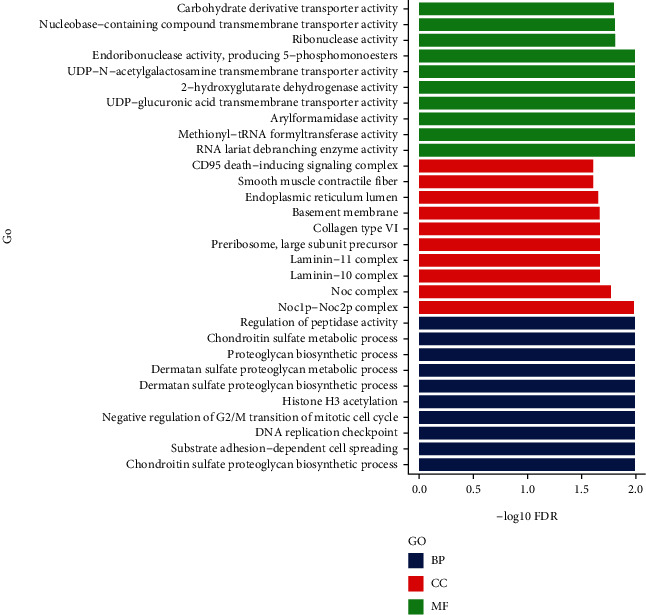
GO term enrichment analysis of DELs; the abscissa represented the −log10 FDR value and the ordinate represented the GO classification; green, red, and blue indicated molecular function (MF), cell component (CC), and biological process (BP), respectively.
GO analysis of DEGs for MF was primarily enriched in MHC class II receptor activity and chemokine activity, CC showed enrichment in cell surface and plasma membrane components, and BPs showed developmental processes and cell migration (Figure 5).
Figure 5.
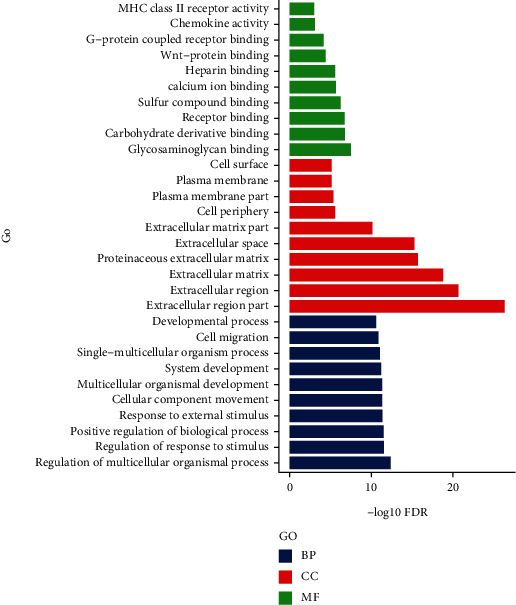
GO term enrichment analysis of (B) DEGs; the abscissa represented the −log10 FDR value and the ordinate represented the GO classification; green, red, and blue indicated molecular function (MF), cell component (CC), and biological process (BP), respectively.
The KEGG analyses for DELs (Figure 6) and DEGs (Figure 7) were also performed. The significant KEGG functional enrichment of DELs was ECM-receptor interaction (Figure 8), viral carcinogenesis (Figure 9), drug metabolism, cytochrome P450, p53 signaling pathway, nucleotide-binding oligomerization domain- (NOD-) like receptor signaling pathway, viral myocarditis, peroxisome proliferator-activated receptor (PPAR) signaling pathway, metabolism of xenobiotics by cytochrome P450, and riboflavin metabolism. The significant KEGG functional enrichment of DEGs was valine, leucine and isoleucine biosynthesis, Staphylococcus aureus infection (Figure 10), prion diseases, riboflavin metabolism, viral myocarditis, malaria, rheumatoid arthritis (Figure 11), complement and coagulation cascades, asthma, legionellosis, intestinal immune network for IgA production, allograft rejection, graft-versus-host disease, tumor necrosis factor (TNF) signaling pathway, legionellosis, epithelial cell signaling in Helicobacter pylori infection, type I diabetes mellitus, systemic lupus erythematosus, pertussis, and autoimmune thyroid disease.
Figure 6.
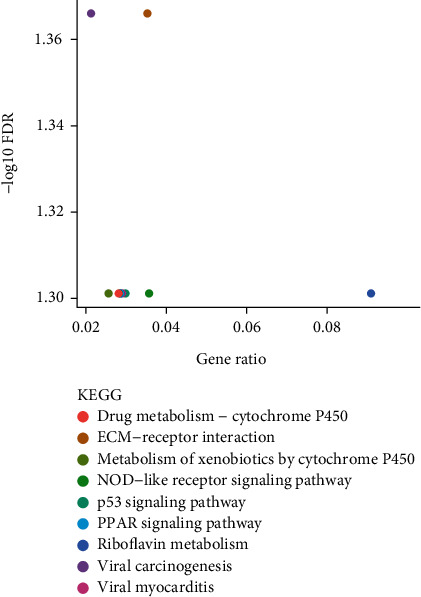
KEGG analysis of the potential pathway enriched by DELs; the abscissa represented the gene ratio and the ordinate represented the −log10 FDR value.
Figure 7.
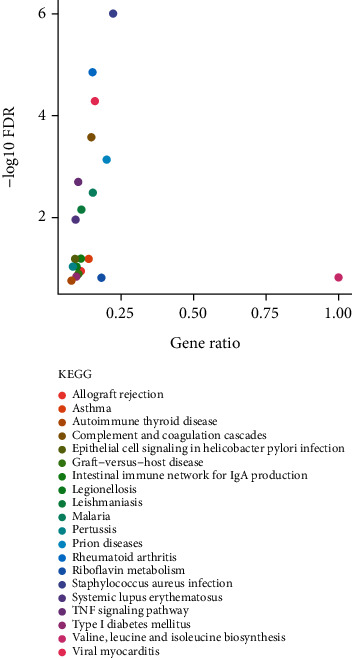
KEGG analysis of the potential pathway enriched by DEGs; the abscissa represented the gene ratio and the ordinate represented the −log10 FDR value.
Figure 8.
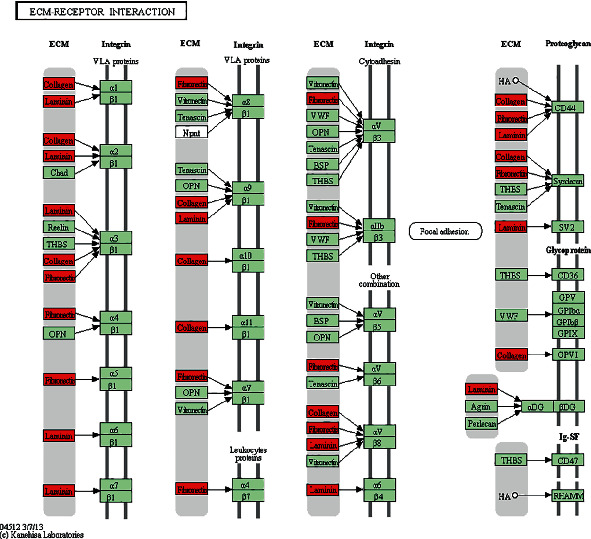
KEGG pathway of ECM-receptor interaction. Red indicated significantly different expression genes in the bone nonunion group compared with bone union group. Organism-specific genes or pathways were colored green.
Figure 9.
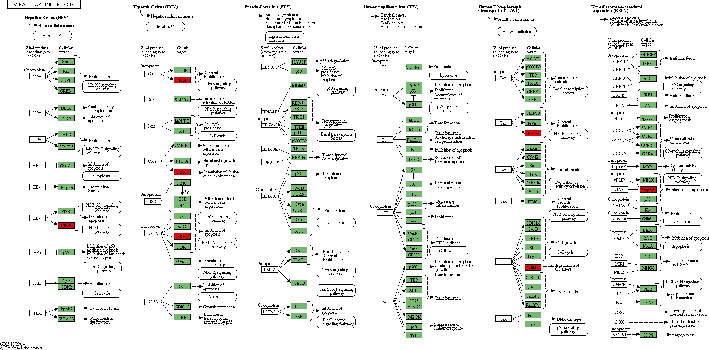
KEGG pathway of viral carcinogenesis. Red indicated significantly different expression genes in the bone nonunion group compared with the bone union group. Organism-specific genes or pathways were colored green.
Figure 10.
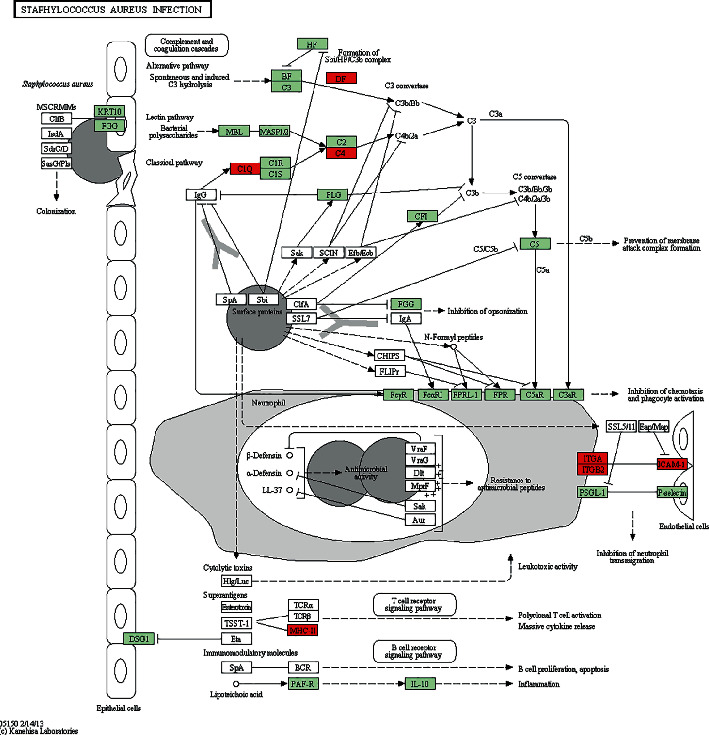
KEGG pathway of staphylococcus aureus infection. Red indicated significantly different expression genes in the bone nonunion group compared with the bone union group. Organism-specific genes or pathways were colored green.
Figure 11.
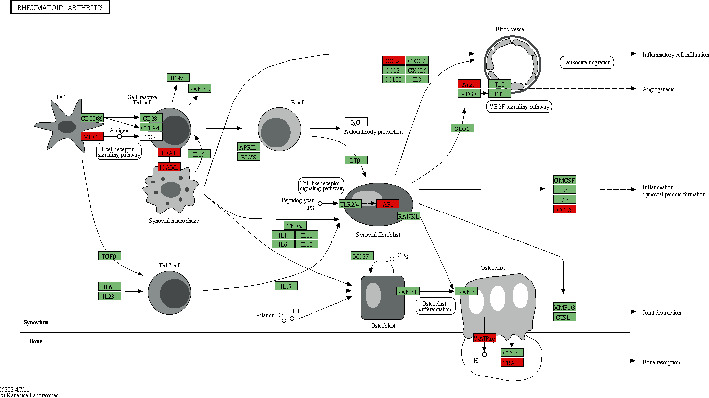
KEGG pathway of rheumatoid arthritis. Red indicated significantly different expression genes in the bone nonunion group compared with the bone union group. Organism-specific genes or pathways were colored green.
3.4. lncRNA Cis- and Trans-Regulated Genes
Differential expression of lncRNA cis- and trans-regulated genes was predicted. As shown in Figure 6, lncRNA ENST00000453060 cis-regulates COL6A1, lncRNA ENST00000577048 cis-regulates MYH11, lncRNA ENST00000606343 cis-regulates BCAN, etc. (Figure 12). Additionally, several lncRNA trans-regulated genes were reported, including lncRNA UCSC_TCONS_00017121 trans-regulating RBP1, MLPL44, MTFMT, and TIPIN (Figure 13).
Figure 12.
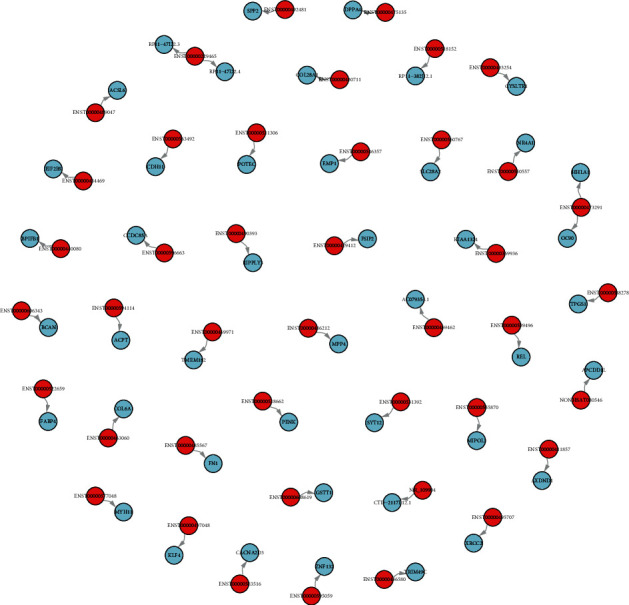
The cis-regulated target gene network diagram of differentially expressed lncRNAs. Red represented lncRNA and blue represented the target gene.
Figure 13.
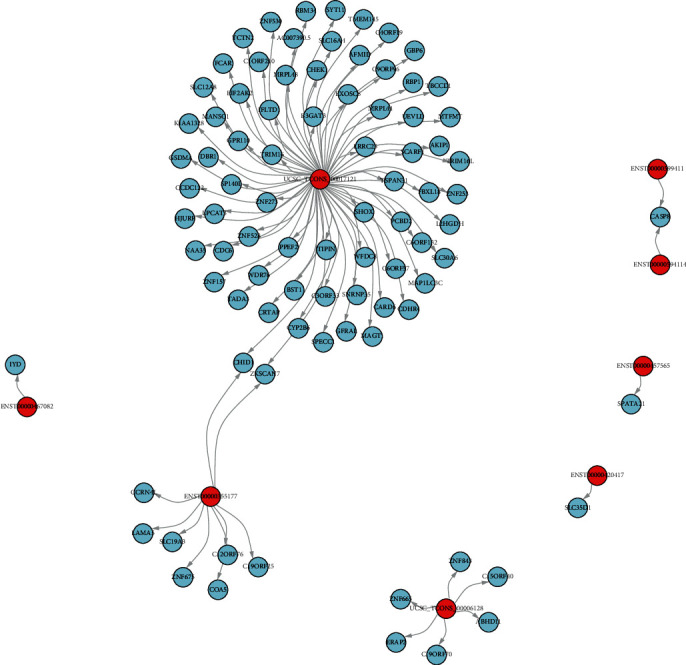
The trans-regulated target gene network diagram of differentially expressed lncRNAs. Red represented lncRNA and blue the represented target gene.
4. Discussion
With the development of sequencing technology, transcriptome sequencing has been used to understand a variety of diseases [25, 26]. Wei et al. used an miRNA expression profile of bone nonunion and union tissues to find nine upregulated and nine downregulated miRNAs [27]. Long et al. reported 557 differentially expressed miRNAs in bone nonunion tissues and further explored that miR-381 can modulate human bone mesenchymal stromal cell osteogenesis [28]. The results obtained in different transcriptome sequencing studies may vary greatly, which may be related to different sequencing technologies, samples, and sequencing methods. Previous studies indicated that lncRNAs achieve their functions in tumors through a wide range of mechanisms [29–31]. However, lncRNAs have been rarely studied in orthopedics, especially with respect to bone nonunion [32], thus limiting the detection and treatment of bone nonunion to a certain extent.
In this study, transcriptome sequencing was performed on bone tissue samples collected from long bones (tibia, femur, and humerus) of patients with bone nonunion and normal bone union. We detected and analyzed 179 DELs and 415 DEGs. GO analysis showed that DELs were primarily enriched in carbohydrate derivative transporter activity in MF, CD95 death-inducing signaling complex in CC, and regulation of peptidase activity in BP. The DEGs were mainly involved in MHC class II receptor activity for MF, cell surface, and developmental processes for CC and BP. The KEGG pathway enrichment of the DELs showed the ECM-receptor interaction pathway and viral carcinogenesis pathway. The KEGG pathway enrichment in DEGs showed the S. aureus infection pathway and rheumatoid arthritis pathway. The ECM-receptor interaction pathway primarily functions through three ECM proteins, including collagen, fibronectin, and laminin. Laminin is involved in osteogenesis and promotion of bone defect repair [33, 34]. Studies have suggested that collagen type XV may be involved in ECM organization early in the osteogenesis process, a prerequisite for promoting subsequent mineral matrix deposition [35]. Immunohistochemical and transcriptomic studies have shown the expression and dynamic regulation of fibronectin in several stages of fracture healing [35, 36]. Single-cell RNA sequencing of the injury site revealed an early increase in mesenchymal progenitor cell (MPC) genes associated with cell adhesion pathways and ECM receptor interactions. The ECM creates a microenvironment with a MPC differentiation bias closer to a specific stiffness role in tissues [37–40]. For example, a rigid environment that mimics the natural bone favors differentiation into osteoblasts [41], whereas a softer matrix promotes the development of adipocyte fate [42, 43].
lncRNAs can cis-regulate the transcription of adjacent protein-coding genes, thereby regulating the expression of such genes and participating in developmental and other biological processes associated with them. Cis-regulation refers to the transcriptional activation and expression regulation of noncoding RNAs to adjacent mRNAs. In this study, we found that lncRNA ENST00000453060 may cis-regulate COL6A1. Previous studies have indicated that genetic deletion of COL6A1 impairs osteoblast connections and communication [44]. COL6A1 plays a substantial role in osteoblasts, and lncRNA ENST00000453060 may regulate osteoblasts via cis-regulation of COL6A1. Additionally, our previous study confirmed that lncRNA ENST00000563492 could promote the osteogenesis-angiogenesis coupling process in bone marrow stromal cells [45].
lncRNA trans-regulation is the regulation of distal mRNA transcription. lncRNAs can regulate the expression of distant genes by binding to enhancers and promoters. lncRNAs regulate the activity of bound proteins or RNAs in the cytoplasm or nucleus in a dose-dependent manner. The lncRNA UCSC_TCONS_00017121 trans-regulates RBP1. Previous studies have shown that RBP1 promotes differentiation of osteoblasts [46]. The lncRNA UCSC_TCONS_00017121 may also regulate osteoblasts via cis-regulating COL6A1.
There were certain limitations in the present study. First, no validation assays, including qPCR and histological analysis, were performed to confirm the differential expression, thereby demanding the need for further experimental studies. Second, patient matching, including differences in ages of enrolled patients and differences involving sites of sample collection from bone nonunion tissues, was not well handled. Third, only 6 patients were enrolled in this study, the results from which need to be confirmed in a further study with greater numbers of samples. Fourth, the sample size of this study was relatively small and the results need to be interpreted with caution.
5. Conclusions
A total of 179 DELs and 415 DEGs were identified between bone nonunion and bone union tissue samples. All of these lncRNAs and mRNAs may be related to the occurrence and development of bone nonunion. GO, KEGG, and regulatory analysis for these lncRNAs and mRNAs were performed to detect their potential functions. This study identified potential biomarkers for bone nonunion, but a validation cohort is still essential to confirm the applicability of these biomarkers.
Acknowledgments
This work was supported by the National Natural Science Foundation of China (Grant nos. 82072441, 81871783, and 81672176), Hunan Province Outstanding Youth Fund (Grant no. 2022JJ10095), and Natural Science Foundation of Hunan Province (Grant no. 2021JJ30954).
Contributor Information
Cheng Tao, Email: chengtaocsu@163.com.
Tang Liu, Email: liutang1204@csu.edu.cn.
Data Availability
The datasets used and/or analyzed during the current study are available from the corresponding author upon reasonable request.
Ethical Approval
This study was approved by the Second Xiangya Hospital of Central South University Committee for Clinical Research, and all of the methods were in accordance with the Declaration of Helsinki. All of the methods were performed in accordance with the relevant guidelines and regulations.
Consent
All studies included in this study got informed consent from each study participant, and each study was approved by the ethics committee or institutional review board.
Disclosure
The study funders/sponsors had no role in the design and conduct of the study; collection, management, analysis, and interpretation of the data; preparation, review, or approval of the manuscript; and decision to submit the manuscript for publication.
Conflicts of Interest
The authors declare that they do not have any competing interests.
Authors' Contributions
JZ and TL conceived and designed the study. JZ and TL conducted the study and drafted the manuscript. JZ, RW, QT, ZW, ZL, WW, CT, and TL contributed to the revision of the manuscript. All of the authors have read and approved the final manuscript. Jian Zhou, Rongjun Wan, and Qunyan Tian had equal contribution. Jian Zhou, Rongjun Wan and Qunyan Tian were co-first authors.
Supplementary Materials
Figure S1: annotation and classification of the lncRNAs obtained. Table S1: statistical results of original and preprocessed sequences. Table S2: statistical results of reference genome alignment analysis of reads.
References
- 1.Court-Brown C. M., McBirnie J. The epidemiology of tibial fractures. Journal of Bone and Joint Surgery. British Volume (London) . 1995;77:417–421. [PubMed] [Google Scholar]
- 2.Zura R., Braid-Forbes M. J., Jeray K., et al. Bone fracture nonunion rate decreases with increasing age: a prospective inception cohort study. Bone . 2017;95:26–32. doi: 10.1016/j.bone.2016.11.006. [DOI] [PubMed] [Google Scholar]
- 3.Wang Z., Bhattacharyya T. Trends of non-union and prescriptions for non-steroidal anti-inflammatory drugs in the United States, 1993-2012. Acta Orthopaedica . 2015;86(5):632–637. doi: 10.3109/17453674.2015.1028860. [DOI] [PMC free article] [PubMed] [Google Scholar]
- 4.Tzioupis C., Giannoudis P. V. Prevalence of long-bone non-unions. Injury . 2007;38(Supplement 2):S3–S9. doi: 10.1016/S0020-1383(07)80003-9. [DOI] [PubMed] [Google Scholar]
- 5.Mundi R., Axelrod D., Heels-Ansdell D., et al. Nonunion in patients with tibial shaft fractures: is early physical status associated with fracture healing. Cureus . 2020;12:p. e7649. doi: 10.7759/cureus.7649. [DOI] [PMC free article] [PubMed] [Google Scholar]
- 6.Flierl M. A., Smith W. R., Mauffrey C., et al. Outcomes and complication rates of different bone grafting modalities in long bone fracture nonunions: a retrospective cohort study in 182 patients. Journal of Orthopaedic Surgery and Research . 2013;8(1):p. 33. doi: 10.1186/1749-799X-8-33. [DOI] [PMC free article] [PubMed] [Google Scholar]
- 7.Khatkar H., See A. Stem cell therapy in the management of fracture non-union-evaluating cellular mechanisms and clinical progress. Cureus . 2021;13:p. e13869. doi: 10.7759/cureus.13869. [DOI] [PMC free article] [PubMed] [Google Scholar]
- 8.Rupp M., Popp D., Alt V. Prevention of infection in open fractures: where are the pendulums now? Injury . 2020;51(Supplement 2):S57–S63. doi: 10.1016/j.injury.2019.10.074. [DOI] [PubMed] [Google Scholar]
- 9.Yin P., Zhang L., Li T., et al. Infected nonunion of tibia and femur treated by bone transport. Journal of Orthopaedic Surgery and Research . 2015;10(1):p. 49. doi: 10.1186/s13018-015-0189-5. [DOI] [PMC free article] [PubMed] [Google Scholar]
- 10.Ouyang Z., Tan T., Zhang X., et al. CircRNA hsa_circ_0074834 promotes the osteogenesis-angiogenesis coupling process in bone mesenchymal stem cells (BMSCs) by acting as a ceRNA for miR-942-5p. Cell Death & Disease . 2019;10(12):p. 932. doi: 10.1038/s41419-019-2161-5. [DOI] [PMC free article] [PubMed] [Google Scholar]
- 11.Dai Y., Huang L., Zhang H., et al. Differentially expressed microRNAs as diagnostic biomarkers for infected tibial non-union. Injury . 2021;52(1):11–18. doi: 10.1016/j.injury.2020.09.016. [DOI] [PubMed] [Google Scholar]
- 12.Xiong D. H., Liu X. G., Guo Y. F., et al. Genome-wide association and follow-up replication studies identified ADAMTS18 and TGFBR3 as bone mass candidate genes in different ethnic groups. American Journal of Human Genetics . 2009;84(3):388–398. doi: 10.1016/j.ajhg.2009.01.025. [DOI] [PMC free article] [PubMed] [Google Scholar]
- 13.Han X. G., Wang D. K., Gao F., Liu R. H., Bi Z. G. Bone morphogenetic protein 2 and decorin expression in old fracture fragments and surrounding tissues. Genetics and Molecular Research . 2015;14(3):11063–11072. doi: 10.4238/2015.September.21.19. [DOI] [PubMed] [Google Scholar]
- 14.Panteli M., Vun J. S., Pountos I., J Howard A., Jones E., Giannoudis P. V. Biological and molecular profile of fracture non-union tissue: a systematic review and an update on current insights. Journal of Cellular and Molecular Medicine . 2022;26(3):601–623. doi: 10.1111/jcmm.17096. [DOI] [PMC free article] [PubMed] [Google Scholar]
- 15.Zhang Y., Wang X., Huang X., et al. Transcriptome sequencing profiling identifies miRNA-331-3p as an osteoblast- specific miRNA in infected bone nonunion. Bone . 2021;143:p. 115619. doi: 10.1016/j.bone.2020.115619. [DOI] [PubMed] [Google Scholar]
- 16.Peng W. X., Koirala P., Mo Y. Y. LncRNA-mediated regulation of cell signaling in cancer. Oncogene . 2017;36(41):5661–5667. doi: 10.1038/onc.2017.184. [DOI] [PMC free article] [PubMed] [Google Scholar]
- 17.Jarroux J., Morillon A., Pinskaya M. History, discovery, and classification of lncRNAs. Advances in Experimental Medicine and Biology . 2017;1008:1–46. doi: 10.1007/978-981-10-5203-3_1. [DOI] [PubMed] [Google Scholar]
- 18.Li D., Li L., Chen X., Gao Y., Cao Y., Hao B. LncRNA GHET1 promotes osteoblast proliferation and differentiation by inhibiting PTEN. Panminerva Medica . 2021;63(3):393–394. doi: 10.23736/S0031-0808.19.03701-7. [DOI] [PubMed] [Google Scholar]
- 19.Xiong Y., Chen L., Yan C., Endo Y., Mi B., Liu G. The lncRNA Rhno1/miR-6979-5p/BMP2 Axis modulates osteoblast differentiation. International Journal of Biological Sciences . 2020;16(9):1604–1615. doi: 10.7150/ijbs.38930. [DOI] [PMC free article] [PubMed] [Google Scholar]
- 20.Liu S. C., Sun Q. Z., Qiao X. F., et al. LncRNA TUG1 influences osteoblast proliferation and differentiation through the Wnt/β-catenin signaling pathway. European Review for Medical and Pharmacological Sciences . 2019;23(11):4584–4590. doi: 10.26355/eurrev_201906_18035. [DOI] [PubMed] [Google Scholar]
- 21.Zhang R. F., Liu J. W., Yu S. P., et al. LncRNA UCA1 affects osteoblast proliferation and differentiation by regulating BMP-2 expression. European Review for Medical and Pharmacological Sciences . 2019;23(16):6774–6782. doi: 10.26355/eurrev_201908_18715. [DOI] [PubMed] [Google Scholar]
- 22.Shao Y., Hu X., Wu X. LncRNA X inactive-specific transcript promotes osteoclast differentiation through Tgif2 by acting as a ceRNA of miR-590-3p in a murine model. Regenerative Medicine . 2021;16(7):643–653. doi: 10.2217/rme-2020-0174. [DOI] [PubMed] [Google Scholar]
- 23.Zhang Y., Chen X. F., Li J., He F., Li X., Guo Y. lncRNA Neat1 stimulates osteoclastogenesis via sponging miR-7. Journal of Bone and Mineral Research . 2020;35(9):1772–1781. doi: 10.1002/jbmr.4039. [DOI] [PubMed] [Google Scholar]
- 24.Li W., Zhu H. M., Xu H. D., Zhang B., Huang S. M. CRNDE impacts the proliferation of osteoclast by estrogen deficiency in postmenopausal osteoporosis. European Review for Medical and Pharmacological Sciences . 2018;22(18):5815–5821. doi: 10.26355/eurrev_201809_15907. [DOI] [PubMed] [Google Scholar]
- 25.Gao L., Zhao Y., Ma X., Zhang L. Integrated analysis of lncRNA-miRNA-mRNA ceRNA network and the potential prognosis indicators in sarcomas. BMC Medical Genomics . 2021;14(1):p. 67. doi: 10.1186/s12920-021-00918-x. [DOI] [PMC free article] [PubMed] [Google Scholar]
- 26.Bridges M. C., Daulagala A. C., Kourtidis A. LNCcation: lncRNA localization and function. The Journal of Cell Biology . 2021;220(2) doi: 10.1083/jcb.202009045. [DOI] [PMC free article] [PubMed] [Google Scholar]
- 27.Wei J., Chen H., Fu Y., et al. Experimental study of expression profile and specific role of human microRNAs in regulating atrophic bone nonunion. Medicine (Baltimore) . 2020;99(36):p. e21653. doi: 10.1097/MD.0000000000021653. [DOI] [PMC free article] [PubMed] [Google Scholar]
- 28.Long H., Zhu Y., Lin Z., et al. miR-381 modulates human bone mesenchymal stromal cells (BMSCs) osteogenesis via suppressing Wnt signaling pathway during atrophic nonunion development. Cell Death & Disease . 2019;10(7):p. 470. doi: 10.1038/s41419-019-1693-z. [DOI] [PMC free article] [PubMed] [Google Scholar] [Retracted]
- 29.Cao H. L., Liu Z. J., Huang P. L., Yue Y. L., Xi J. N. lncRNA-RMRP promotes proliferation, migration and invasion of bladder cancer via miR-206. European Review for Medical and Pharmacological Sciences . 2019;23(3):1012–1021. doi: 10.26355/eurrev_201902_16988. [DOI] [PubMed] [Google Scholar]
- 30.Gutschner T., Diederichs S. The hallmarks of cancer: a long non-coding RNA point of view. RNA Biology . 2012;9(6):703–719. doi: 10.4161/rna.20481. [DOI] [PMC free article] [PubMed] [Google Scholar]
- 31.Henry J. A., Nicholson S., Hennessy C., Lennard T. W., May F. E., Westley B. R. Expression of the oestrogen regulated pNR-2 mRNA in human breast cancer: relation to oestrogen receptor mRNA levels and response to tamoxifen therapy. British Journal of Cancer . 1990;61(1):32–38. doi: 10.1038/bjc.1990.8. [DOI] [PMC free article] [PubMed] [Google Scholar]
- 32.Ross N. T., Lohmann F., Carbonneau S., et al. CPSF3-dependent pre-mRNA processing as a druggable node in AML and Ewing’s sarcoma. Nature Chemical Biology . 2020;16(1):50–59. doi: 10.1038/s41589-019-0424-1. [DOI] [PMC free article] [PubMed] [Google Scholar]
- 33.Dennis J. E., Haynesworth S. E., Young R. G., Caplan A. I. Osteogenesis in marrow-derived mesenchymal cell porous ceramic composites transplanted subcutaneously: effect of fibronectin and laminin on cell retention and rate of osteogenic expression. Cell Transplantation . 1992;1(1):23–32. doi: 10.1177/096368979200100106. [DOI] [PubMed] [Google Scholar]
- 34.Tang Y., Luo K., Chen Y., et al. Effect of demineralized bone matrix modified by laminin α4 chain functional peptide on H-type angiogenesis and osteogenesis to promote bone defect repair. Zhongguo Xiu Fu Chong Jian Wai Ke Za Zhi . 2020;34(12):1594–1601. doi: 10.7507/1002-1892.202006081. [DOI] [PMC free article] [PubMed] [Google Scholar]
- 35.Lisignoli G., Lambertini E., Manferdini C., et al. Collagen type XV and the ‘osteogenic status’. Journal of Cellular and Molecular Medicine . 2017;21(9):2236–2244. doi: 10.1111/jcmm.13137. [DOI] [PMC free article] [PubMed] [Google Scholar]
- 36.Colucci S. C., Buccoliero C., Sanesi L., et al. Systemic administration of recombinant irisin accelerates fracture healing in mice. International Journal of Molecular Sciences . 2021;22(19):p. 10863. doi: 10.3390/ijms221910863. [DOI] [PMC free article] [PubMed] [Google Scholar]
- 37.DuFort C. C., Paszek M. J., Weaver V. M. Balancing forces: architectural control of mechanotransduction. Nature Reviews. Molecular Cell Biology . 2011;12(5):308–319. doi: 10.1038/nrm3112. [DOI] [PMC free article] [PubMed] [Google Scholar]
- 38.Hynes R. O. The extracellular matrix: not just pretty fibrils. Science . 2009;326(5957):1216–1219. doi: 10.1126/science.1176009. [DOI] [PMC free article] [PubMed] [Google Scholar]
- 39.Lu P., Weaver V. M., Werb Z. The extracellular matrix: a dynamic niche in cancer progression. The Journal of Cell Biology . 2012;196(4):395–406. doi: 10.1083/jcb.201102147. [DOI] [PMC free article] [PubMed] [Google Scholar]
- 40.Guilak F., Cohen D. M., Estes B. T., Gimble J. M., Liedtke W., Chen C. S. Control of stem cell fate by physical interactions with the extracellular matrix. Cell Stem Cell . 2009;5(1):17–26. doi: 10.1016/j.stem.2009.06.016. [DOI] [PMC free article] [PubMed] [Google Scholar]
- 41.Fried A., Shamay A., Wientroub S., Benayahu D. Phenotypic expression of marrow cells when grown on various substrata. Journal of Cellular Biochemistry . 1996;61(2):246–254. doi: 10.1002/(SICI)1097-4644(19960501)61:2<246::AID-JCB8>3.0.CO;2-U. [DOI] [PubMed] [Google Scholar]
- 42.Engler A. J., Sen S., Sweeney H. L., Discher D. E. Matrix elasticity directs stem cell lineage specification. Cell . 2006;126(4):677–689. doi: 10.1016/j.cell.2006.06.044. [DOI] [PubMed] [Google Scholar]
- 43.Discher D. E., Mooney D. J., Zandstra P. W. Growth factors, matrices, and forces combine and control stem cells. Science . 2009;324(5935):1673–1677. doi: 10.1126/science.1171643. [DOI] [PMC free article] [PubMed] [Google Scholar]
- 44.Izu Y., Ezura Y., Koch M., Birk D. E., Noda M. Collagens VI and XII form complexes mediating osteoblast interactions during osteogenesis. Cell and Tissue Research . 2016;364(3):623–635. doi: 10.1007/s00441-015-2345-y. [DOI] [PMC free article] [PubMed] [Google Scholar]
- 45.Ouyang Z., Tan T., Zhang X., et al. LncRNA ENST00000563492 promoting the osteogenesis-angiogenesis coupling process in bone mesenchymal stem cells (BMSCs) by functions as a ceRNA for miR-205-5p. Cell Death & Disease . 2020;11(6):p. 486. doi: 10.1038/s41419-020-2689-4. [DOI] [PMC free article] [PubMed] [Google Scholar]
- 46.Monroe D. G., Hawse J. R., Subramaniam M., Spelsberg T. C. Retinoblastoma binding protein-1 (RBP1) is a Runx2 coactivator and promotes osteoblastic differentiation. BMC Musculoskeletal Disorders . 2010;11(1):p. 104. doi: 10.1186/1471-2474-11-104. [DOI] [PMC free article] [PubMed] [Google Scholar]
Associated Data
This section collects any data citations, data availability statements, or supplementary materials included in this article.
Supplementary Materials
Figure S1: annotation and classification of the lncRNAs obtained. Table S1: statistical results of original and preprocessed sequences. Table S2: statistical results of reference genome alignment analysis of reads.
Data Availability Statement
The datasets used and/or analyzed during the current study are available from the corresponding author upon reasonable request.


