Abstract
Diabetic retinopathy is a pathological change of the retina that occurs for long-term diabetes. The patients become symptomatic in advanced stages of diabetic retinopathy resulting in severe non-proliferative diabetic retinopathy or proliferative diabetic retinopathy stages. There is a need of an automated screening tool for the early detection and treatment of patients with diabetic retinopathy. This paper focuses on the segmentation of red lesions using nested U-Net Zhou et al. (Deep Learning in Medical Image Analysis and Multimodal Learning for Clinical Decision Support, Springer, 2018) followed by removal of false positives based on the sub-image classification method. Different sizes of sub-images were studied for the reduction in false positives in the sub-image classification method. The network could capture semantic features and fine details due to dense convolutional blocks connected via skip connections in between down sampling and up sampling paths. False-negative candidates were very few and the sub-image classification network effectively reduced the falsely detected candidates. The proposed framework achieves a sensitivity of , precision of , and F1-Score of for the DIARETDB1 data set Kalviainen and Uusutalo (Medical Image Understanding and Analysis, Citeseer, 2007). It outperforms the state-of-the-art networks such as U-Net Ronneberger et al. (International Conference on Medical Image Computing and Computer-Assisted Intervention, Springer, 2015) and attention U-Net Oktay et al. (Attention u-net: Learning where to look for the pancreas, 2018).
Keywords: Diabetic retinopathy, Fundus images, Segmentation of red lesions, Nested U-Net, Sub-image classification
Introduction
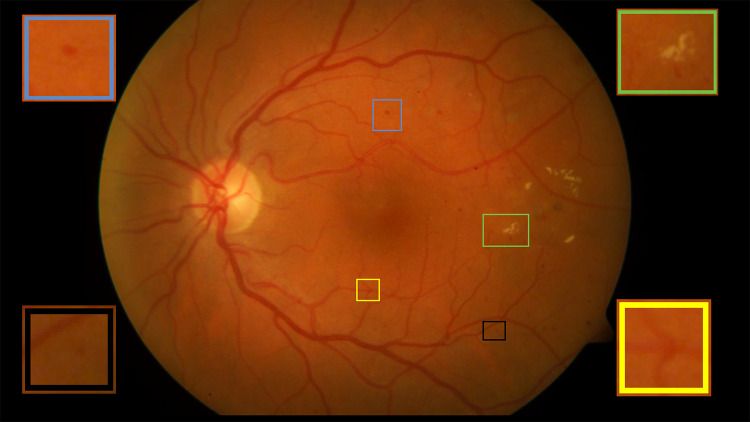
Diabetic retinopathy (DR) has become one of the most vulnerable eye diseases that cause blindness [5]. It is observed that one out of every three diabetic patients suffers from DR [6], and one out of every ten suffers from the severity of the disease. In the USA, blindness within the age of 20 to 70 is caused mostly due to DR [6]. DR shows no early symptoms of vision difficulty and blindness can occur even before the age of 50 [5]. Blindness due to DR can be avoided if detected in an early stage [6]. The significant risk factors for the onset and progression of DR are the duration of diabetes and degree of diabetic control. The pathological findings in DR are red lesions and white lesions. The red lesions include micro-aneurysms and haemorrhages and white lesions include soft and hard exudates [7]. Micro-aneurysms indicate the primary stage of DR which resemble tiny red circular spots as shown in Fig. 1. Haemorrhages are different sized red patches that determine the severity of the disease [8].
Fig. 1.
Blue box represents haemorrhage, yellow box represents vessel crossover, black box represents micro-aneurysm, and green box depicts excudates
Detection of micro-aneurysms and haemorrhages are usually done manually by the ophthalmologists, who measure the haemorrhage size and determine the severity of DR. Differences in image contrast, variation in image quality, variation in size, colour, and shapes of red lesions are the challenges for automatic detection or segmentation of red lesions. Ambiguity often arises between small red lesions and the vessel junctions. The characteristic of small red lesions that hinders the most in its accurate detection or segmentation is the variation of shape and size (25 to 100 ). The variation in size and shapes considerably increases the possibility of false detection of pixel candidates and chances of missing out on small lesions. Manual segmentation is time-consuming, prone to error, and challenging for clinical practice. The number of ophthalmologists in India is limited compared to the increasing rate of DR cases. An automatic screening tool for DR would reduce the burden on the clinicians and help in accurate and effective diagnosis.
Micro-aneurysms are only of few pixels. The reported works mainly focussed on detection of red lesions rather than segmentation. The classical approaches primarily include mathematical morphological methods and template matching techniques to automate the classification, detection, and segmentation of red lesions. The classical approaches follow common steps like preprocessing, initial candidate detection, feature extraction, and classification. The preprocessing is essential for enhancing the red lesions from the background [9]. The shade correction method and normalization of green channel [10] were performed as preprocessing techniques. Watershed transform was also applied to distinguish micro-aneurysms from other dot-like structures [9]. Red lesions were detected using diameter closing, automatic threshold followed by classification. The classification of candidates was accomplished using kernel density estimation with variable bandwidth [10]. Template matching was used [7] for extraction of different shaped haemorrhages. The Radon Cliff operator [11] was applied for the successful detection of circular structures irrespective of their size. Wavelet transform [12] and support vector machine (SVM) [13] were also used for detection of red lesions. Lazar et al. constructed a score map on micro-aneurysms and extracted the micro-aneurysms by thresholding operation [14]. Rocha et al. avoided the need for preprocessing or postprocessing [15] and built a visual word dictionary for detecting the points of interest within the lesions. Directional cross-section profiles were estimated on the local maxima pixels of the images, followed by peak detection with the calculation of size, shape, and height of the peaks to detect micro-aneurysms [16]. Circular Hough transform with feature extraction method was used for successful detection of microaneurysms [17]. Kar et al. implemented a curvelet-based enhancement method to separate the red lesion from the background. The information of matched filter along with Laplacian and Gaussian filters were maximized jointly for detection of red lesion [18]. Zhou [19] used an unsupervised classification method for micro-aneurysms detection. Wang [20] localized the candidates using a dark object filtering process, with singular spectrum analysis to process their cross-sections.
The classical methods for detection and segmentation of red lesions mostly rely on hand crafted features based on low-level information. The morphological methods also suffer from the dependency of several parameters which are determined empirically. Fully convolutional networks (FCN) were introduced for pixel-level segmentation [21] and were applied for medical image segmentation [6, 22, 23]. The U-Net [3] is very popular for medical image segmentation. The proposed network is based on U-Net++ [1] network with dense convolution layers connected through skip connections in between the up sampling and down sampling paths. The decoder provides the high-level feature maps, whereas the encoder provides the low-level feature maps. It shows that with the dense convolution layers, the feature maps captured from the background and foreground improved compared to that of U-Net [3] and attention U-Net [4]. The segmentation results are further refined by sub-image classification with ResNet-18 [24]. The falsely detected candidates for the proposed architecture are less than results obtained using U-Net [3] and attention U-Net [4]. The novelty of this work lies in exploring an improved version of U-Net++ [1] with a postprocessing method for further reduction in false positives based on a sub-image classification approach. An ablation study of U-Net++ [1] was performed to determine its depth. The proposed framework is robust and effective for fast segmentation of red lesions with an improved performance.
Materials and Methods
Materials
Publicly available MESSIDOR data set [25] was used for initial training of the network from scratch. MESSIDOR data set [25] consists of 1200 colour fundus images, captured using a non-mydriatic camera with a 45 degree field of view. Images were of , or pixels. Out of 1200 images of the MESSIDOR data set [25], 742 images belonging to grade-1, grade-2, and grade-3 categories were selected. Five hundred and seventy-two were for training, and one hundred and seventy were for validation. The ground truths for MESSIDOR data set [25] are not publicly available. The annotations of red lesions in MESSIDOR [25] images were done under the supervision of ophthalmologists.
DIARETDB1 data set [2] consists of 89 colour fundus images, where 84 images contain at least mild or non-proliferative signs and five are normal. These images were captured using a 50 degree field of view. The course ground truths of DIARETDB1 [2] images are publicly available which can be used only for detection. Four medical experts had done the annotations. We redefined the boundaries of red lesions under the supervision of ophthalmologists.
Methods
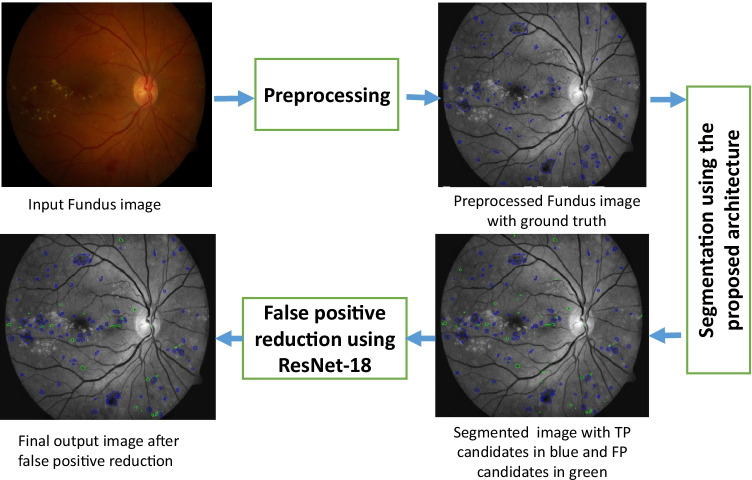
The proposed method has two stages: initial segmentation using Nested U-Net [1] of red lesions and subsequent reduction in false-positives candidates based on sub-image classification. The block diagram of the proposed method is shown in Fig. 2, and the methodology is explained in subsequent sections.
Fig. 2.
Block diagram of the proposed methodology
Preprocessing
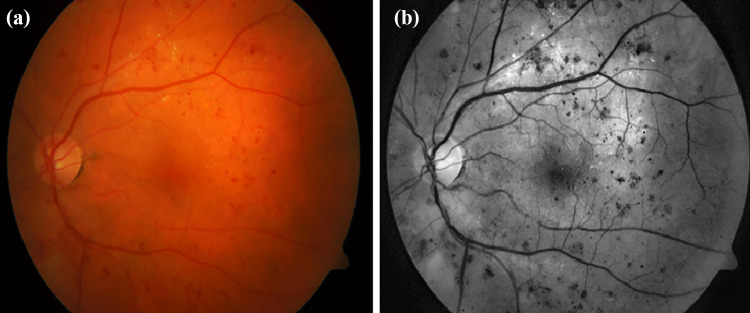
Retinal fundus images often suffer from uneven illumination and poor contrast. It is observed that illumination is maximum near the optic disc and gradually decreases towards the periphery. The red lesions have the maximum contrast in the green channel. To cope with GPU memory, the large-sized retinal fundus images were divided into small pieces of pixels so that semantic information is not lost and high resolution is maintained. Contrast limited adaptive histogram equalization (CLAHE) [5, 26, 27] was performed to improve the visibility of red lesions as shown in Fig. 3.
Fig. 3.
(a) Normal fundus image and (b) preprocessed fundus image
Network Architecture for Red Lesions Segmentation
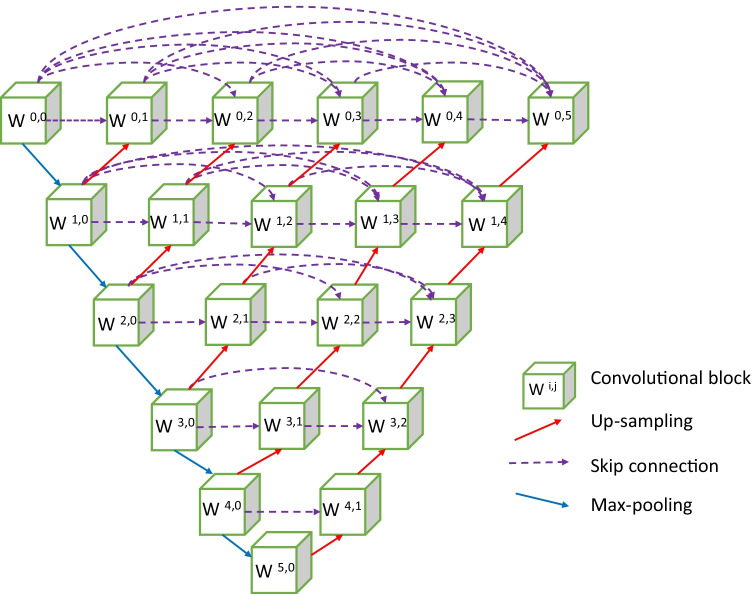
The state-of-the-art networks for the segmentation of medical images are composed of encoders and decoders. The decoder provides the semantic, high level, and course feature maps, and the encoder provides the low level and fine feature maps. The proposed network has an encoder and decoder paths connected through several dense convolutional blocks. An encoder–decoder model based on U-Net++ [1] is proposed for segmentation of red lesions. The proposed network is a fully convolutional neural network and its purpose is to use the high-level and shallow-level information of an object for better segmentation. The network consists of a main up-sampling and down-sampling paths as shown in Fig. 4. The encoder and decoder are connected via skip connections with a series of convolution blocks. There are twenty-one convolutional blocks, and each block has two convolutional layers. The encoder path has six convolutional blocks with kernel size of and padding of 1. Maxpooling operation with a filter size of and stride 2 is performed after each encoder block except the last block. The size of feature map increases from 64 to 2048 along the down sampling path. Along the encoder path, image size reduces from to . The decoder path has five convolutional blocks following a sequence of up-sampling and concatenation after each block. Feature map size increases from 2048 to 64 along the decoder path and image size increases from to . There is padding with dense convolutional blocks along the horizontal line between encoder and decoder. Four dense convolutional blocks are present between the topmost encoder and decoder blocks, and these blocks decrease by unity as we go downwards along with the network. Along the horizontal paths of the network, every block is connected to the other through skip connections. The convolutional blocks parallel to the main decoder path, undergo up-sampling. Thus, each convolutional block of the dense layer is preceded by a concatenation operation that adds the output from the previous dense convolutional blocks with the up sampled output from the lower dense convolutional block. Essentially, the dense blocks bring together the feature maps of the encoder and decoder such that both the feature maps are semantically similar. This network aims to segment the red lesions with minimum false-negative candidates.
Fig. 4.
Architecture of the network for segmentation of red lesions
Here, denotes each convolutional block and is its output, where i denotes convolutional blocks downwards along the encoder and j depicts the dense convolutional blocks with the skip connections. All blocks with receive the output from its preceding block of the encoder following max pooling. All block with receives two inputs; one from the block preceding it along the skip connection path and the other from the block below along the encoder path following up-sampling. For , the convolutional blocks receive a j number of inputs from the preceding dense convolutional blocks along the skip path and one from the dense layer below after up-sampling. Thus each block receives the feature maps from all its previous blocks. The input image data propagates along all possible paths of the network and produces the feature maps at the end of the network.
| 1 |
| 2 |
where denotes convolution, denotes max pooling, [.] denotes concatenation and denotes upsampling.
Sub-image Classification for False-Positive Reduction
ResNet is one of the most common convolutional neural networks used for classification. The ResNet-18 [24] is used to classify the sub-images with and without red lesions. The optimal sub-image size is . The ResNet-18 [24] has 18 convolutional layers each of kernel size is . The feature map size increases from 64 to 512 down the network. The last layer is a fully connected one. Leaving the first convolutional layer, skip connections are there at an interval of two convolutional layers; this structure is called the residual block [24]. The residual block is shown in Fig. 5, where the curved arrow denotes the skip connection. The equations that define the residual block are as follows:
| 3 |
| 4 |
where x and H(x) are the input and output of the residual block. Each residual block has two weighted layers, as shown in Fig. 5. The skip connections help to retain the information before the previous layer. The residual blocks decrease the network’s distortions caused by the increased number of convolutional layers. It is known that shallow layers learn low-level features like object edges, object structure, or texture features, whereas deep layers learn high-level features like spatial and semantic features. Thus if the networks are made deeper, low-level features are often lost. Residual blocks in ResNet-18 [24] restrain the loss of low-level features and it works better than other networks.
Fig. 5.
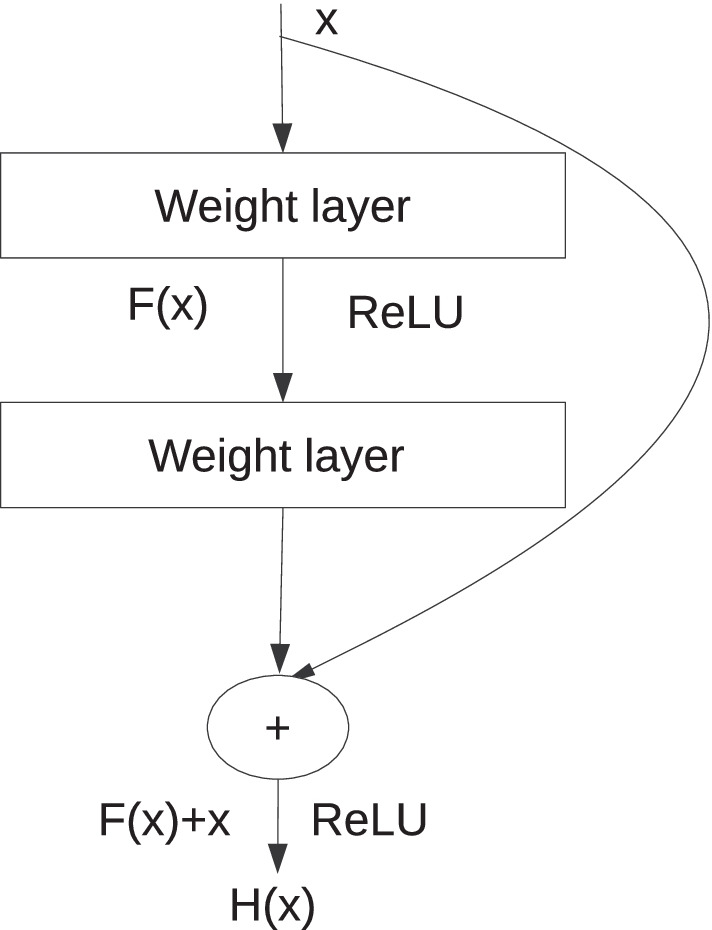
Residual block
Training
The proposed network was trained with images of MESSIDOR data set [25]. Each image of the MESSIDOR data [25] set was divided into eight pieces and re-sized to pixels. The network was trained up to 75 epochs. ADAM [28] optimizer was used with a learning rate of 0.00001 for 1 to 50 epochs. The learning rate was decreased to 0.000001 for 51 to 75 epochs. Patches of size were extracted to update the weights of the pre-trained network. The total number of epochs for training was 60. Stochastic gradient descent (SGD) [29] was used with a learning rate of 0.01 and momentum 0.6. The learning rate decreased by 0.0001 after every 15 epochs.
Results and Discussions
Metric
The performance of the proposed method and competing methods were evaluated using conventional metrics like sensitivity, specificity, precision, accuracy, and F1-score as mentioned below.
| 5 |
| 6 |
| 7 |
| 8 |
| 9 |
Connected component level validation was done inspired from the following method [22, 30]. In Fig. 6, the red-coloured contours represent the ground truth lesions and the green-coloured contours represent the predicted lesions. Instead of counting the truly classified pixels, only the true-positive pixels of connected components, overlapping with the ground truth by a minimal ratio of 0.2, are considered. Suppose the predicted lesion does not overlap the ground truth by a minimal ratio of 0.2. In that case, the non-overlapping portion of the predicted lesion is considered false-positive pixels. The non-overlapping part of the ground truth is regarded as the false-negative pixels. The rest of the pixels are true negatives. The boundaries of red lesions are not clearly defined and therefore, connected component level validation is used for calculating the performance metrics.
Fig. 6.
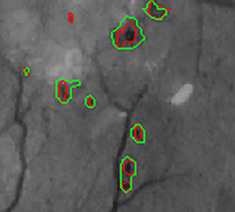
Overlapping of ground truth and predicted lesions
Segmentation Results
The performance of the proposed and competing methods were evaluated on DIARETDB1 data set [2]. The 89 images of DIARETDB1 data set [2] were divided into two parts. Twenty-eight images were used for fine-tuning the pre-trained model, and results were reported on the rest of the 61 images. The state-of-the-art networks (U-Net [3], attention U-Net [4]) were also trained on 28 images, and the results were reported on 61 images of DIARETDB1 data set [2]. It is observed that there is an improvement in sensitivity and precision (Table 1) with the proposed architecture. Improvement in sensitivity is over U-Net [3], and precision has increased by in comparison with the results obtained using attention U-Net [4].
Table 1.
Performance evaluation for red lesion segmentation
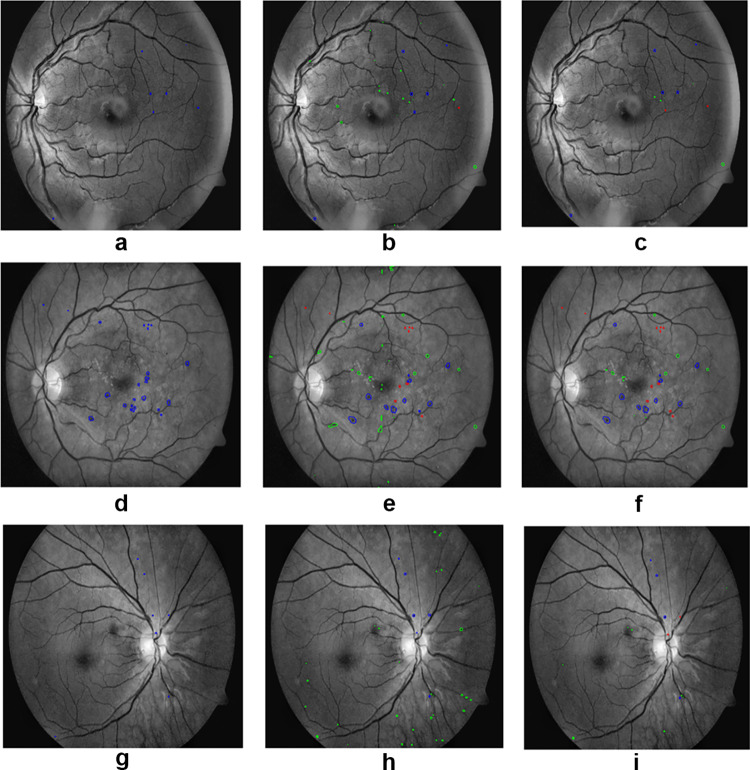
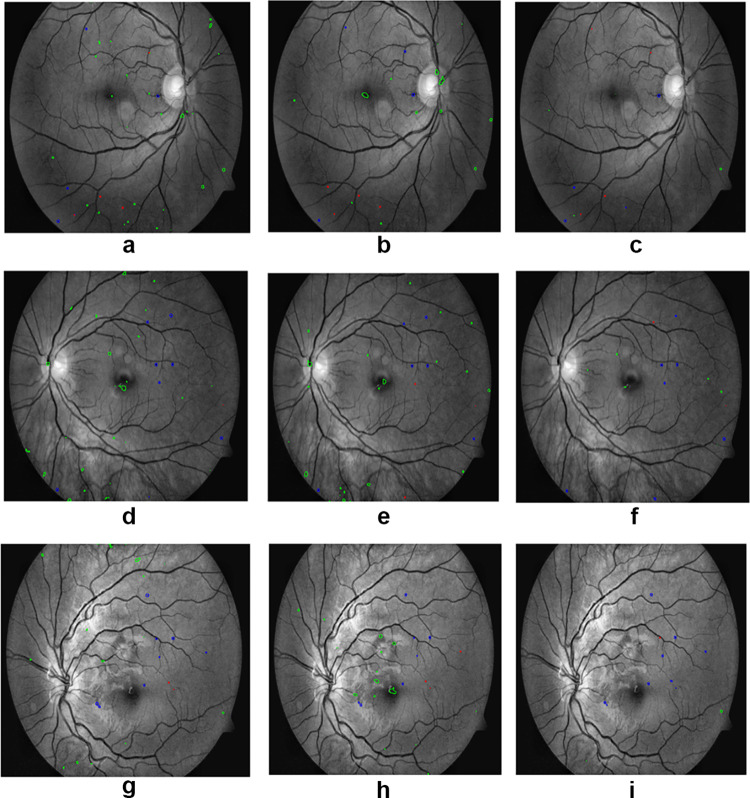
In Fig. 7, the first column represents the ground truths for the red lesions, the second column represents the initial segmentation results of the proposed method, and the third column shows the results after false-positive reduction. The proposed method could segment red lesions of poor contrast and small size. It is robust enough to segment tiny as well as large sized red lesions. In Fig. 8, the first column, second column, and third column represent the segmentation of red lesions using U-Net [3], attention U-Net [4], and proposed method, respectively. False-positive false-negative candidates were sufficiently low in the proposed method compared to the other competing techniques.
Fig. 7.
(a), (d) and (g) are the ground truths, (b), (e) and (h) are the segmentation of red lesions using nested U-Net, (c), (f) and (i) are the final results after false-positive removal. Blue represents the true-positive candidates, green represents the false-positive candidates, and red represents the false-negative candidates
Fig. 8.
(a), (d) and (g) are the results of U-Net, (b), (e) and (h) are the results of attention U-Net, and (c), (f) and (i) are the results of proposed method. Blue represents the true-positive candidates, green represents the false-positive candidates, and red represents false-negative candidates
Conclusion
An architecture based on convolutional neural network is developed for the segmentation of red lesions in fundus images. The architecture uses minimum and informative training images and has the potential to assist ophthalmologists in diagnosing diabetic retinopathy with high accuracy. The proposed architecture could segment red lesions with very few false-negative candidates. False-positive candidates were also reduced to a large extent. More work is still needed to minimize false-negative and false-positive candidates further. There is a scope of improvement in the preprocessing technique for better visualization of small pathologies in fundus images that are difficult to segment.
This article purely focused on the segmentation of red lesions (micro-aneurysms and haemorrhages) for non-proliferative diabetic retinopathy diagnosis. The limitation of this article is that segmentation and detection of neovascularization were not addressed. The method used in this article can successfully segment micro-aneurysms with a minimum number of false positives. The method would be helpful in the early screening of DR and can prevent vision loss as well as the cost of treatment. The proposed method can be useful for computer-aided diagnosis of non-proliferative diabetic retinopathy and assist ophthalmologists while taking clinical decisions.
Author Contributions
The authors contributed to an improved version of U-Net++ with a postprocessing method for further reduction of false positives by sub-image classification approach. Ablation study of nested U-Net was performed to determine its depth. A robust, fast, improved, and effective segmentation of red lesion could be achieved.
Funding
The study was not funded by anyone.
Data Availability
The study was done using two publicly available datasets MESSIDOR and DIARETDB1.For this type of study, formal consent is not required.
Code Availability
Codes for U-Net++ and ResNet-18are available publicly. For this work, code of UNet ++ was modified.
Declarations
Conflicts of Interest
The authors declare that they have no conflict of interest.
Footnotes
Publisher’s Note
Springer Nature remains neutral with regard to jurisdictional claims in published maps and institutional affiliations.
Contributor Information
Swagata Kundu, Email: swagatakundu2103@gmail.com.
Vikrant Karale, Email: vicky753@gmail.com.
Goutam Ghorai, Email: goutamghorai@rediffmail.com.
Gautam Sarkar, Email: sgautam63@gmail.com.
Sambuddha Ghosh, Email: sambuddhaghosh@gmail.com.
Ashis Kumar Dhara, Email: ashis.dhara@ee.nitdgp.ac.in.
References
- 1. Zongwei Zhou, Md Mahfuzur Rahman Siddiquee, Nima Tajbakhsh, and Jianming Liang. Unet++: A nested u-net architecture for medical image segmentation. In Deep Learning in Medical Image Analysis and Multimodal Learning for Clinical Decision Support, pages 3–11. Springer, 2018. [DOI] [PMC free article] [PubMed]
- 2. RVJPH Kälviäinen and H Uusitalo. Diaretdb1 diabetic retinopathy database and evaluation protocol. In Medical image understanding and analysis, volume 2007, page 61. Citeseer, 2007.
- 3. Olaf Ronneberger, Philipp Fischer, and Thomas Brox. U-net: Convolutional networks for biomedical image segmentation. In International Conference on Medical image computing and computer-assisted intervention, pages 234–241. Springer, 2015.
- 4. Ozan Oktay, Jo Schlemper, Loic Le Folgoc, Matthew Lee, Mattias Heinrich, Kazunari Misawa, Kensaku Mori, Steven McDonagh, Nils Y Hammerla, Bernhard Kainz, et al. Attention u-net: Learning where to look for the pancreas. arXiv preprint arXiv:1804.03999, 2018.
- 5. Lama Seoud, Thomas Hurtut, Jihed Chelbi, Farida Cheriet, and JM Pierre Langlois. Red lesion detection using dynamic shape features for diabetic retinopathy screening. IEEE transactions on medical imaging, 35(4):1116–1126, 2015. [DOI] [PubMed]
- 6.Dai Ling, Fang Ruogu, Li Huating, Hou Xuhong, Sheng Bin, Qiang Wu, Jia Weiping. Clinical report guided retinal microaneurysm detection with multi-sieving deep learning. IEEE transactions on medical imaging. 2018;37(5):1149–1161. doi: 10.1109/TMI.2018.2794988. [DOI] [PubMed] [Google Scholar]
- 7. Jang Pyo Bae, Kwang Gi Kim, Ho Chul Kang, Chang Bu Jeong, Kyu Hyung Park, and Jeong-Min Hwang. A study on hemorrhage detection using hybrid method in fundus images. Journal of digital imaging, 24(3):394–404, 2011. [DOI] [PMC free article] [PubMed]
- 8.Cao Wen, Czarnek Nicholas, Shan Juan, Li Lin. Microaneurysm detection using principal component analysis and machine learning methods. IEEE transactions on nanobioscience. 2018;17(3):191–198. doi: 10.1109/TNB.2018.2840084. [DOI] [PubMed] [Google Scholar]
- 9. Alan D Fleming, Sam Philip, Keith A Goatman, John A Olson, and Peter F Sharp. Automated microaneurysm detection using local contrast normalization and local vessel detection. IEEE transactions on medical imaging, 25(9):1223–1232, 2006. [DOI] [PubMed]
- 10.Walter Thomas, Massin Pascale, Erginay Ali, Ordonez Richard, Jeulin Clotilde, Klein Jean-Claude. Automatic detection of microaneurysms in color fundus images. Medical image analysis. 2007;11(6):555–566. doi: 10.1016/j.media.2007.05.001. [DOI] [PubMed] [Google Scholar]
- 11. Luca Giancardo, Fabrice Mériaudeau, Thomas P Karnowski, Kenneth W Tobin, Yaqin Li, and Edward Chaum. Microaneurysms detection with the radon cliff operator in retinal fundus images. In Medical Imaging 2010: Image Processing, volume 7623, page 76230U. International Society for Optics and Photonics, 2010.
- 12. Gwénolé Quellec, Mathieu Lamard, Pierre Marie Josselin, Guy Cazuguel, Béatrice Cochener, and Christian Roux. Optimal wavelet transform for the detection of microaneurysms in retina photographs. IEEE transactions on medical imaging, 27(9):1230–1241, 2008. [DOI] [PMC free article] [PubMed]
- 13. Kedir M Adal, Peter G Van Etten, Jose P Martinez, Kenneth W Rouwen, Koenraad A Vermeer, and Lucas J van Vliet. An automated system for the detection and classification of retinal changes due to red lesions in longitudinal fundus images. IEEE transactions on biomedical engineering, 65(6):1382–1390, 2017. [DOI] [PubMed]
- 14. Istvan Lazar and Andras Hajdu. Microaneurysm detection in retinal images using a rotating cross-section based model. In 2011 IEEE international symposium on biomedical imaging: from nano to macro, pages 1405–1409. IEEE, 2011.
- 15. Anderson Rocha, Tiago Carvalho, Herbert F Jelinek, Siome Goldenstein, and Jacques Wainer. Points of interest and visual dictionaries for automatic retinal lesion detection. IEEE transactions on biomedical engineering, 59(8):2244–2253, 2012. [DOI] [PubMed]
- 16.Lazar Istvan, Hajdu Andras. Retinal microaneurysm detection through local rotating cross-section profile analysis. IEEE transactions on medical imaging. 2012;32(2):400–407. doi: 10.1109/TMI.2012.2228665. [DOI] [PubMed] [Google Scholar]
- 17. Sarni Suhaila Rahim, Chrisina Jayne, Vasile Palade, and James Shuttleworth. Automatic detection of microaneurysms in colour fundus images for diabetic retinopathy screening. Neural computing and applications, 27(5):1149–1164, 2016.
- 18. Sudeshna Sil Kar and Santi P Maity. Automatic detection of retinal lesions for screening of diabetic retinopathy. IEEE Transactions on Biomedical Engineering, 65(3):608–618, 2017. [DOI] [PubMed]
- 19.Zhou Wei, Chengdong Wu, Chen Dali, Yi Yugen, Wenyou Du. Automatic microaneurysm detection using the sparse principal component analysis-based unsupervised classification method. IEEE access. 2017;5:2563–2572. doi: 10.1109/ACCESS.2017.2671918. [DOI] [Google Scholar]
- 20. Su Wang, Hongying Lilian Tang, Yin Hu, Saeid Sanei, George Michael Saleh, Tunde Peto, et al. Localizing microaneurysms in fundus images through singular spectrum analysis. IEEE Transactions on Biomedical Engineering, 64(5):990–1002, 2016. [DOI] [PubMed]
- 21. Jonathan Long, Evan Shelhamer, and Trevor Darrell. Fully convolutional networks for semantic segmentation. In Proceedings of the IEEE conference on computer vision and pattern recognition, pages 3431–3440, 2015. [DOI] [PubMed]
- 22.Playout Clément, Duval Renaud, Cheriet Farida. A novel weakly supervised multitask architecture for retinal lesions segmentation on fundus images. IEEE transactions on medical imaging. 2019;38(10):2434–2444. doi: 10.1109/TMI.2019.2906319. [DOI] [PubMed] [Google Scholar]
- 23. Mark JJP Van Grinsven, Bram van Ginneken, Carel B Hoyng, Thomas Theelen, and Clara I Sánchez. Fast convolutional neural network training using selective data sampling: Application to hemorrhage detection in color fundus images. IEEE transactions on medical imaging, 35(5):1273–1284, 2016. [DOI] [PubMed]
- 24.Xianfeng Ou, Yan Pengcheng, Zhang Yiming, Bing Tu, Zhang Guoyun, Jianhui Wu, Li Wujing. Moving object detection method via resnet-18 with encoder–decoder structure in complex scenes. IEEE Access. 2019;7:108152–108160. doi: 10.1109/ACCESS.2019.2931922. [DOI] [Google Scholar]
- 25. Feedback on a publicly distributed database: the messidor database. 33.
- 26. PN Sharath Kumar, R Rajesh Kumar, Anuja Sathar, and V Sahasranamam. Automatic detection of red lesions in digital color retinal images. In 2014 International Conference on Contemporary Computing and Informatics (IC3I), pages 1148–1153. IEEE, 2014.
- 27. Wei Zhou, Chengdong Wu, Dali Chen, Zhenzhu Wang, Yugen Yi, and Wenyou Du. A novel approach for red lesions detection using superpixel multi-feature classification in color fundus images. In 2017 29th Chinese Control and Decision Conference (CCDC), pages 6643–6648. IEEE, 2017.
- 28. Diederik P Kingma and Jimmy Ba. Adam: A method for stochastic optimization. arXiv preprint arXiv:1412.6980, 2014.
- 29. Sebastian Ruder. An overview of gradient descent optimization algorithms. arXiv preprint arXiv:1609.04747, 2016.
- 30.Zhang Xiwei, Thibault Guillaume, Decencière Etienne, Marcotegui Beatriz, Laÿ Bruno, Danno Ronan, Cazuguel Guy, Quellec Gwénolé, Lamard Mathieu, Massin Pascale, et al. Exudate detection in color retinal images for mass screening of diabetic retinopathy. Medical image analysis. 2014;18(7):1026–1043. doi: 10.1016/j.media.2014.05.004. [DOI] [PubMed] [Google Scholar]
Associated Data
This section collects any data citations, data availability statements, or supplementary materials included in this article.
Data Availability Statement
The study was done using two publicly available datasets MESSIDOR and DIARETDB1.For this type of study, formal consent is not required.
Codes for U-Net++ and ResNet-18are available publicly. For this work, code of UNet ++ was modified.


