Abstract
The performance of rat liver and HEp-2 in the detection of antinuclear antibodies (ANA) was studied by two independent sites and compared against an ANA enzyme immunoassay (EIA) screen and EIA systems for the measurement of antibodies to double-stranded DNA (dsDNA) and ENA. Sixty-two sera from patients with connective tissue disease (CTD) and 398 from controls suffering from other disorders were included. The level of agreement was, for HEp-2 and rat liver (within one site), 82.0% (ANA positive/ANA negative) and 51.0% (ANA pattern); and for HEp2- and HEp-2 (between sites), 71.8 and 86.5%. On sera with the ANA homogeneous pattern, the measurement of anti-ENA EIA added little to the detection rate with anti-dsDNA EIA alone. On ANA speckled sera, the EIA reactivity depended on the reaction of the mitotic cells: while sera with positive mitoses reacted similarly to ANA homogeneous sera, in those with negative mitoses the measurement of anti-ENA added about 10% to the detection rate achieved with anti-dsDNA alone. The measurement of anti-Scl-70 and anti-Jo-1 did not markedly improve the positive rate with classical ENA (anti-SSA, -SSB, -Sm, and -RNP) alone, raising doubts about the cost efficiency of including these measurements in unselected sera. The ANA EIA identified patients with CTD at a rate similar to that for rat liver and HEp-2. However, up to 98% of the sera found to be negative by ANA EIA but positive by use of rat liver and HEp-2 were from controls. Thus, the ANA EIA may possible be used as an alternative screen, particularly in laboratories with a high frequency of sera from patients not suffering from CTD.
The measurement of autoantibodies against antigens of the nucleus (antinuclear antibodies [ANA]) is commonly used for screening, diagnosis, and monitoring of connective tissue diseases (CTD) such as systemic lupus erythematosus (SLE), progressive systemic sclerosis (PSS), mixed connective tissue disease (MCTD), Sjögren syndrome (SS), and polymyositis (PM). The preferred technique is indirect immunofluorescence (IIF) with rodent tissue sections or HEp-2, a human epithelial cell line, as an antigen source (3, 8). The popularity of this technique is explained by the simple and robust test procedure and the modest cost of materials. However, reading the slides is time-consuming, and the validity of the results depends largely on the skill and knowledge of the microscopist.
More recently, enzyme immunoassays (EIA) have been introduced for the detection and measurement of ANA. They differ mainly by the antigen composition used in each well: while screening tests use whole HEp-2 nuclei, an extract thereof, or a mixture of defined nuclear antigens, diagnostic tests use a single defined antigen, allowing the qualitative assessment of four to six different antibodies, i.e., an antibody profile, in one run.
Compared to IIF, the EIA technique is objective, is less labor-intensive, and has the potential for automation. At the same time, however, it is more expensive. It provides results in optical densities (ODs) rather than titers and gives the antibody specificity rather than the ANA pattern, i.e., it has an impact both on the logistics of clinical laboratories performing the ANA test and on the thinking of the clinician ordering it. No doubt, this technique has been put on the market in the hope that it will supplement the existing IIF technique or even replace it.
Whether this hope will be realized will, apart from political issues (e.g., reimbursement), depend on the clinical performance of the new assays.
Some studies have already been devoted to this subject (1, 2, 7). They are all similar in design. Our study is no different in this respect. However, our results are based on a fairly large number of consecutively collected, clinically defined sera, and the data were obtained at two independent sites, one a routine laboratory and one an industrial service laboratory. In addition, we provide an extensive validation of the IIF technique as such, with one of the laboratories comparing rat liver and HEp-2 and both laboratories comparing the same HEp-2 preparation, and against an ANA screen EIA.
MATERIALS AND METHODS
Patients.
The samples included in this study were obtained for diagnostic purposes and routine testing from consecutive outpatients and inpatients of the Medical Center, University Hospitals of Ulm, Ulm, Germany. Blood was collected by venipuncture in tubes without anticoagulants. The tubes were sent to the laboratory at the Section of Infectious Diseases and Clinical Immunology, University Hospitals of Ulm (site 1), where the nonhemolytic serum was separated, coded, and divided into two aliquots. One was used for immediate routine testing; the other was frozen and sent in dry ice to an industrial quality assessment laboratory (site 2).
Clinical diagnoses.
The clinical diagnoses were obtained in the majority of cases from the medical charts and, in a few cases, from the test request form accompanying the samples. Based on the clinical information in these documents, the patients were allocated to one of the following three groups.
Group 1 consisted of 62 patients with connective tissue disease. The gender ratio (female/male) was 3:1; the median age was 38 years (range, 13 to 78 years). The clinical diagnoses were SLE (38 patients; gender ratio, 3.7:1, median age, 32 years; range, 13 to 78 years); MCTD (8 patients; gender ratio, 8:0; median age, 46.5 years; range, 21 to 55 years); PSS, CREST syndrome, PM, and SS (7 patients; gender ratio, 2.5:1; median age, 51 years; range, 41 to 58 years); and unspecified CTD (9 patients; gender ratio, 2:1; median age, 39 years; range, 19 to 73 years).
Group 2 consisted of 132 patients affected by conditions commonly associated with a higher-than-normal incidence of (falsely) positive ANA levels. The gender ratio was 1.5:1; the median age was 42 years (range, 12 to 79 years). The clinical diagnoses included infectious and chronic inflammatory disease (n = 47), rheumatoid arthritis (n = 20), Wegener's granulomatosis and related vascular diseases (n = 11), Raynaud syndrome (n = 10), viral hepatitis (n = 10), chronic active hepatitis (n = 8), autoimmune hemolytic disease (n = 10), primary biliary cirrhosis (n = 6), uveitis and other eye conditions commonly associated with an increased ANA (n = 6), and autoimmune thyroid disease (n = 4).
Group 3 included 266 patients with conditions less commonly associated with increased ANA. The gender ratio was 1.2:1; the median age was 47 years (range, 3 to 85 years). The clinical diagnoses included cardiovascular disorders (n = 51), degenerative disorders of the muscles and the skeleton (n = 36), lymphoma and leukemia (n = 18), nonmalignant disorders of the erythro- and lymphopoietic system (n = 18), the kidneys (n = 15), the thyroid (n = 10), the intestines and stomach (n = 11), noninfectious hepatic disease (n = 12), diabetes (n = 12), seronegative spondylarthritis (n = 10), carcinoma (n = 9), various other conditions (n = 32), and 32 patients with no clinical evidence of disease.
For 35 patients, no clinical diagnosis was available. The corresponding 35 sera were, therefore, excluded from this study.
Tests.
Site 1 determined ANA levels and ANA patterns by IIF by using rat liver sections (manufactured in-house) and/or HEp-2 cells (Kallestad Quantafluor HEp-2; Sanofi Diagnostics Pasteur, Inc., Chaska, Minn.). A total of 333 sera (53 from group 1, 86 from group 2, and 194 from group 3) were assayed with both rat liver and HEp-2, a total of 120 sera (8, 33, and 79, sera, respectively) were assayed with rat liver alone, and a total of 8 sera (1, 1, and 5, respectively) were assayed with HEp-2 alone. All sera were diluted 1:40 with phosphate-buffered saline; those positive for ANA were diluted further to 1:160 or 1:640. Titers between these dilutions were estimated from the staining intensities. Microscopy was performed by one technician. In those cases where both rat liver and HEp-2 were assayed, the readings on one tissue were done without reference to the results obtained with the other tissue. In addition, all results were obtained without knowledge of the corresponding data collected at site 2. Depending on the clinical request, sera were analyzed further with commercially available EIAs (Synelisa; Elias Medizintechnik, Freiburg, Germany) for the presence of autoantibodies against double-stranded DNA (dsDNA) by using recombinant dsDNA (250 of 283 sera reacting positively and 20 of 178 sera reacting negatively with rat liver and/or HEp-2) and/or autoantibodies against ENA (including anti-SSA, -SSB, -Sm, -RNP, -Scl-70, and -Jo-1 by using recombinant antigens (162 of 283 sera and 39 of 178 sera, respectively). With all EIAs, a patient sample with an OD higher or equal to that of the corresponding cutoff serum was considered positive.
At site 2, all sera were investigated in parallel with IIF (Kallestad Quantafluor HEp-2) and with EIA (Kallestad; Sanofi Diagnostics Pasteur) for ANA and anti-dsDNA. The ANA EIA uses a nuclear extract of HEp-2 as antigen; the anti-dsDNA EIA uses purified dsDNA from calf thymus. With both assays, a patient sample with an OD of at least 0.5 times that of the corresponding cutoff serum was considered positive. The ANA pattern and staining intensity (graded from 1+ to 4+) were determined by one person, who was blinded with regard to clinical and laboratory results. ANA-positive sera (≥1+) were not further diluted. Of the 181 sera found to be positive by ANA IIF and/or ANA EIA, the majority were randomly investigated further by EIA (Kallestad) for the presence of autoantibodies against ENA (anti-SSA, -SSB, -Sm, and -RNP; n = 132), Scl-70 (n = 143), and Jo-1 (n = 157) by using extracted and purified native antigens. Of the 283 sera found to be negative by ANA IIF and/or ANA EIA, the corresponding figures were as follows: for anti-ENA, n = 98; for anti-Scl-70, n = 117; and for anti-Jo-1, n = 132. A patient sample with an OD higher than or the same as that of the corresponding cutoff serum was considered positive.
For evaluation of fluorescence intensity and pattern, both sites used an inverted fluorescence microscope (Axioskop; Carl Zeiss, Jena, Germany) at a ×400 magnification.
RESULTS
Comparison between rat liver and HEp-2.
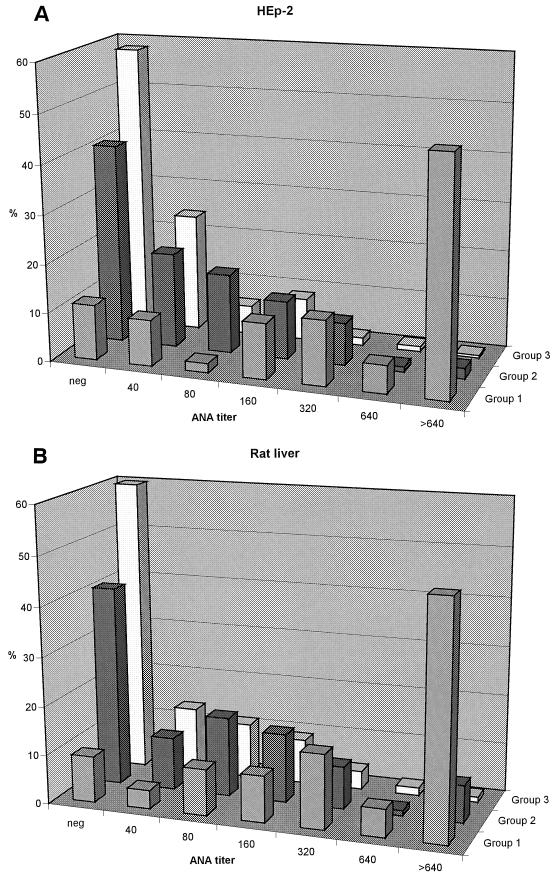
Figure 1 shows the distribution of ANA levels determined in parallel with rat liver and HEp-2. The overall agreement was 75.4% within ±1 titer for both tissues. There is a clear trend toward higher ANA levels proceeding from group 3 through group 2 to group 1, a trend also reflected by the increasing frequency of serum titers of 1:40 and higher (rat liver, 40.1, 59.1, and 90.6%, respectively; HEp-2, 41.7, 59.1, and 88.7%, respectively). Agreement of positive versus negative between the two tissues was 82.0% for all sera and 94.3, 76.3, and 81.3% for the sera of groups 1, 2, and 3, respectively.
FIG. 1.
Distribution of ANA levels determined with HEp-2 (A) and rat liver (B) at site 1 in sera from groups 1, 2, and 3.
The ANA patterns of the 149 sera that reacted as ANA positive with both HEp-2 and rat liver agreed to 51.0% (Table 1). The ANA homogeneous pattern was more often seen with HEp-2 than with rat liver (63 versus 29 sera), while the ANA speckled and ANA nucleolar patterns were more common with rat liver (81 versus 58 sera and 13 versus 7 sera, respectively).
TABLE 1.
ANA pattern comparison in site 1a
| Rat liver pattern | HEp-2 pattern (no. of sera)
|
||||||||
|---|---|---|---|---|---|---|---|---|---|
| Ho | Ho Spe | Spe | Spe, Nu | Ho, Spe, Nu | Ho, Nu | Nu | Aca | Total | |
| Ho | 23 | 1 | 4 | 0 | 1 | 0 | 0 | 0 | 29 |
| Ho, Spe | 10 | 2 | 4 | 0 | 0 | 1 | 0 | 0 | 17 |
| Spe | 25 | 2 | 43 | 5 | 0 | 3 | 1 | 2 | 81 |
| Spe, Nu | 2 | 0 | 4 | 1 | 0 | 0 | 0 | 0 | 7 |
| Ho, Spe, Nu | 0 | 0 | 0 | 0 | 0 | 0 | 0 | 0 | 0 |
| Ho, Nu | 1 | 0 | 0 | 0 | 0 | 1 | 0 | 0 | 2 |
| Nu | 2 | 0 | 3 | 1 | 0 | 1 | 6 | 0 | 13 |
| Aca | 0 | 0 | 0 | 0 | 0 | 0 | 0 | 0 | 0 |
| Total | 63 | 5 | 58 | 7 | 1 | 6 | 7 | 2 | 149 |
Overall pattern agreement (boldface values) was 76 of 149 (51.0%). Abbreviations: Ho, homogeneous; Spe, speckled; Nu, nucleolar; Aca, centromere.
These differences were also retained for all patterns with a homogeneous (75 versus 48 sera) or a speckled component (105 versus 71 sera), but not for all patterns with a nucleolar component (22 versus 21 sera).
Comparison between HEp-2 values at the two sites.
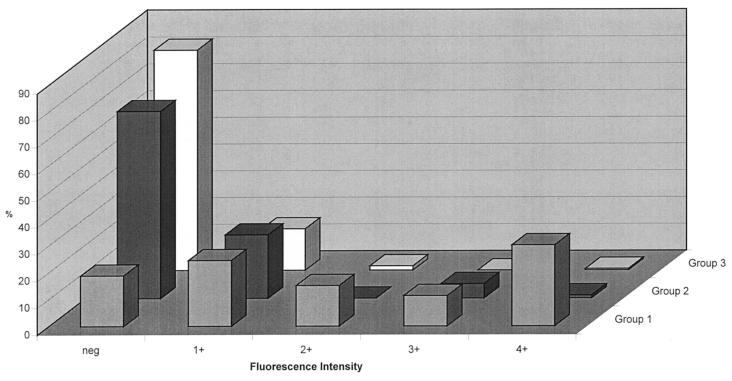
Figure 2 shows the distribution of the ANA fluorescence intensity, determined on the same sera as used for the data in Fig. 1. The frequency of sera graded 1+ or higher was lowest in group 3 (17.6%), increased to 30.1% in group 2, and reached 81.1% in group 1. For 342 sera, data on ANA determined with HEp-2 at both study sites were available. Overall agreement of positive versus negative was 71.8%, being highest for group 1 (88.9%) and lower for the other groups, i.e., 67.4% (group 2) and 69.3% (group 3). While sera from patients in group 1 were detected at a slightly higher rate at site 1 than at site 2 (48 and 44 of 54, respectively), sera from the other groups showed a (correct) negative reaction markedly more often at site 2 than at site 1 (group 2, n = 95, 70.5 versus 42.1%; group 3, n = 192, 82.8 versus 58.3%). Of the 86 discrepant sera (i.e., ANA negative at site 2 but ANA positive at site 1), 53 had a titer of 1:40, 23 had a titer of 1:80, 9 had a titer of 1:160, and 1 was classified as 1:320.
FIG. 2.
Distribution of ANA fluorescence intensities determined with HEp-2 at site 2 in sera from groups 1, 2, and 3.
The ANA patterns of the 96 sera that reacted as ANA positive with HEp-2 at both study sites agreed to 86.5% (data not shown). The number of sera showing the ANA homogeneous, speckled, and nucleolar patterns was nearly the same at the two sites: 43 versus 41, 35 versus 38, and 16 versus 14, respectively, for site 1 versus site 2.
Comparison of ANA by EIA and IIF.
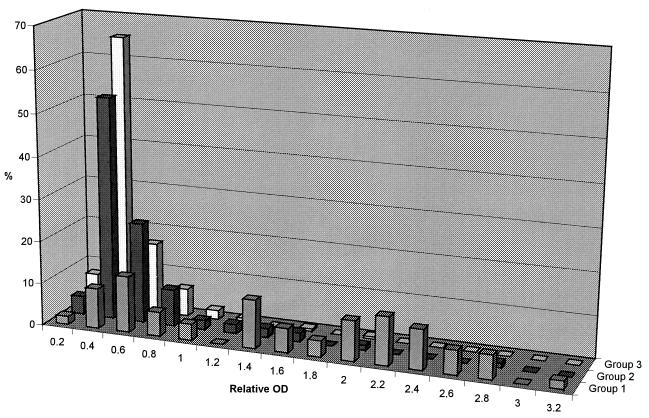
The distribution of the relative ODs, determined with an ANA EIA on the same sera as used for the data in Fig. 1 and 2, is shown in Fig. 3. The frequency of sera above the cutoff (relative OD, >0.5) was lowest in group 3 (14.4%), higher in group 2 (26.9%), and highest in group 1 (83.0%). Markedly elevated ANA levels (relative OD, >1.0) were seen in 66.0% of the sera from group 1 compared to 8.6 and 2.1% of the sera from groups 2 and 3, respectively. Agreement between EIA and IIF regarding positive and negative ANA levels was highest at site 2, reaching 79.6% overall and 94.7, 68.9, and 82.0% for groups 1, 2, and 3, respectively. Of the 94 discrepant sera, 46 were EIA positive (40 borderline with relative OD values between 0.5 and 1.0)-IIF negative and 48 EIA negative-IIF positive (45 at an intensity of 1+).
FIG. 3.
Distribution of relative ODs determined with ANA EIA at site 2 in sera from groups 1, 2, and 3.
The agreement between the corresponding IIF data generated at site 1 and the ANA EIA data at site 2 was as follows. For HEp-2 the overall agreement was 64.2% (n = 341) and agreements were 87.0% (n = 54), 55.8% (n = 95), and 62.0% (n = 192) for the sera of groups 1, 2, and 3, respectively. For rat liver the results were comparable: the overall agreement was 62.2% (n = 453), and the agreements were 88.5% (n = 61), 50.4% (n = 131), and 62.1% (n = 261) for the sera of groups 1, 2, and 3, respectively. Of the 122 EIA HEp-2 discrepant sera, 20 were EIA positive (18 borderline) and HEp-2 negative, and 102 were EIA negative and HEp-2 positive (78 with a titer of ≤1:80). Conversely, of the 171 EIA rat liver discrepant sera, 26 were EIA positive (22 borderline) and rat liver negative, and 145 were EIA negative and rat liver positive (93 with a titer of ≤1:80).
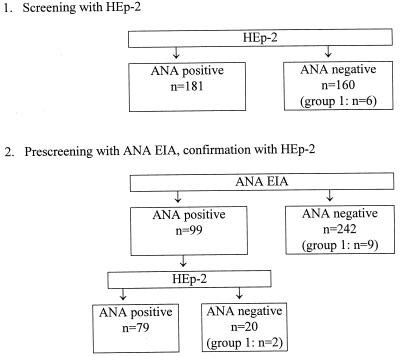
These data were used to estimate the efficiency of the ANA EIA, had it been used as a prescreen on the same sera. At site 2 (Fig. 4), screening with HEp-2 missed 10 group 1 sera compared to 12 with the hypothetical EIA prescreen plus HEp-2 confirmation procedure. However, since the EIA prescreen would have classified 71% of the sera as ANA negative, only 133 sera (instead of all 460) would have needed confirmation testing with HEp-2 and, of these, 65.4% would have been ANA positive compared to 29.3% when all sera were screened with HEp-2 alone.
FIG. 4.
Rationale for using ANA EIA as an ANA prescreen and HEp-2 for confirmation (site 2). Data are based on HEp-2 results obtained at site 2.
At site 1, the EIA prescreen plus HEp-2 confirmation procedure (Fig. 5) would have missed 11 group 1 sera compared to 6 with HEp-2 alone. At the same time, only 99 sera would have needed testing with HEp-2 (29.0% compared to all 341 sera) and, of these, 79.8% would have been positive compared to 53.1% when all sera were screened with HEp-2 alone. The EIA prescreen plus rat liver confirmation procedure (data not shown) would have missed 10 group 1 sera compared to 4 missed with rat liver alone. At the same time, only 132 sera would have needed testing with HEp-2 (29.1% compared to all 453 sera) and, of these, 80.3% would have been found to be positive compared to 43.7% when all sera were screened with rat liver alone.
FIG. 5.
Rationale for using ANA EIA as an ANA prescreen and HEp-2 for confirmation (site 1). Data are based on HEp-2 results obtained at site 1.
The data shown in Fig. 1 to 3 were also used to calculate the sensitivity, specificity, positive predictive value (PPV), negative predictive value (NPV), and diagnostic efficiency (DE) for the IIF and ANA EIA procedures (Table 2). For all of these parameters, the performance of ANA EIA and HEp-2 (site 2) was comparable, displaying a markedly higher specificity, PPV, and DE at a slightly lower sensitivity and a similar NPV compared to the IIF procedures at site 1.
TABLE 2.
Percent sensitivity, specificity, PPV, NPV, and DE calculated on the basis of the data presented in Fig. 1 to 3
| Method | % Sensitivity | % Specificity
|
% PPVa | % NPVa | % DEa | ||
|---|---|---|---|---|---|---|---|
| Groups 2 and 3 | Group 2 | Group 3 | |||||
| Rat liver | 90.6 | 53.6 | 40.9 | 59.9 | 27.0 | 96.8 | 59.4 |
| HEp-2 | |||||||
| Site 1 | 88.7 | 52.5 | 40.9 | 58.3 | 26.1 | 96.1 | 58.3 |
| Site 2 | 88.1 | 78.2 | 69.9 | 82.4 | 41.3 | 95.6 | 78.7 |
| ANA EIA | 83.0 | 81.4 | 73.1 | 85.6 | 45.8 | 96.2 | 81.7 |
Group 1 compared to groups 2 and 3.
Anti-dsDNA EIA and anti-ENA EIA in relation to ANA pattern by HEp-2.
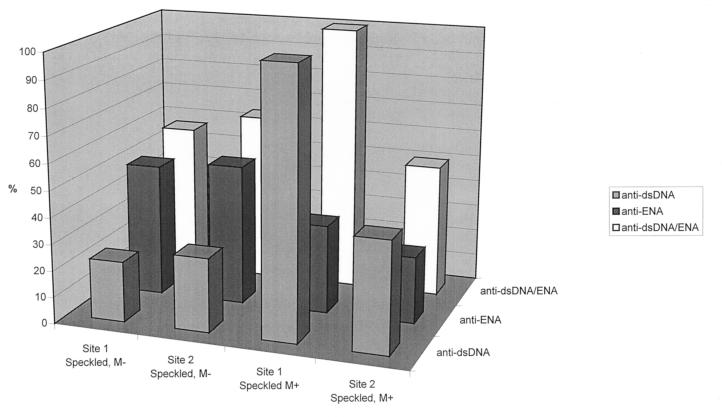
There was an excellent association between ANA pattern, determined with HEp-2, and the frequency of autoantibodies against dsDNA or ENA (SSA/Ro, SSB/La, Sm, and RNP), determined with EIA. Thus, in ANA homogeneous sera, the frequency of anti-dsDNA antibodies was markedly higher than that of autoantibodies against ENA, the difference being particularly marked at site 2, when we used the Kallestad EIAs (Fig. 6). In ANA speckled sera, the frequency of anti-dsDNA and anti-ENA depended on the reaction of the mitotic cells (Fig. 7). In sera with negative mitoses, autoantibodies against ENA were markedly more frequent than anti-dsDNA autoantibodies. In contrast, the relative frequency of anti-dsDNA and anti-ENA in sera with mitotic phases staining positive was similar to that seen with the ANA homogeneous pattern.
FIG. 6.
Incidence of anti-dsDNA and anti-ENA, determined alone or in combination, with Synelisa EIA (site 1) or Kallestad EIA (site 2) on sera showing the ANA homogeneous pattern on HEp-2.
FIG. 7.
Incidence of anti-dsDNA and anti-ENA, determined alone or in combination, with Synelisa EIA (site 1) or Kallestad EIA (site 2) on sera showing the ANA speckled pattern on HEp-2. M−, sera with negative mitoses; M+, sera with positive mitoses.
Anti-Scl-70 and anti-Jo-1.
Scl-70 and Jo-1 are commonly included in commercially available ENA tests. To estimate the relevance of determining the corresponding autoantibodies in unselected clinical sera, we compared the positivity rates by using the classical ENA (i.e., SSA, SSB, Sm, and RNP) to those obtained when Scl-70 and Jo-1 were included and observed only a minor increase from 24.1 to 28.6% and from 14.7 to 19.9% with the Synelisa and Kallestad EIA tests, respectively (data not shown).
DISCUSSION
This study illustrates the limitation and principal use of the ANA test by IIF. Whereas as in our hospital patient mix, with a prevalence of systemic autoimmune diseases of ∼10%, the positive predictive value usually stayed well below 50%, thereby limiting significantly the value of ANA as a diagnostic marker, the negative predictive value here was high enough to practically exclude systemic autoimmune disease in a patient with a negative ANA (1, 9). Our data also illustrate some critical issues of this test, particularly pertaining to the interpretation of fluorescence pattern and intensity. Thus, ANA patterns determined with rat liver and HEp-2 in one laboratory and by one technician agreed to only about 50%, and the positive-to-negative rate determined on the same tissue (HEp-2) in two different laboratories agreed to only about 70%. The difference in ANA pattern was neither related to ANA titer nor to the results with the anti-dsDNA and anti-ENA EIAs (data not shown). This result has, to the best of our knowledge, not been shown before and is possibly due to differences in pattern expression inherent to the two tissues used (3). Indeed, when ANA patterns were compared with the same tissue (HEp-2), an 86.5% agreement was obtained.
The difference in ANA detection rate between the two sites can most likely be attributed to one laboratory (i.e., the one with the lower detection rate [site 2]) reading the slides in near daylight and the other in artificial darkness. The vast majority of the discrepant sera, i.e., ANA negative at site 2 but ANA positive at the other site, had a low titer of 1:40 or 1:80 and none had titers of higher than 1:320. This observation should alert laboratories to the possibility that determination of ANA by IIF in a dark environment can be associated with an overestimation of positive findings due to weak fluorescences that are particularly prevalent in patients that do not suffer from systemic autoimmune disease (Fig. 1 and 2).
If another technique is to replace IIF as a screen for ANA, then it will have to show a high negative predictive value. The ANA EIA investigated in this study seems to meet this requirement, since a negative result excluded systemic autoimmune disease to more than 95% (Table 2). But how should a laboratory treat a positive ANA EIA result? Follow-up with the IIF test and determination of the ANA titer and pattern have been suggested (7). No doubt, an EIA prescreen plus IIF follow-up approach would reduce the total hands-on time versus screening all samples by IIF, and the technician reading the slides would be faced with the stimulating challenge of significantly more positive images (Fig. 4 and 5). On the other hand, it would be more expensive in terms of materials. The question of how to deal with the discrepant, i.e., the EIA-positive, IIF-negative, results would not seem to be a major concern. In the present study, between 95 and 98% of the discrepant sera were from patients with disorders other than systemic autoimmune disease (Fig. 4 and 5).
Samples found to be positive for ANA by IIF are usually investigated further for ANA titer and pattern (5). Both investigations increase the specificity of the ANA test and the clinical information compared to a qualitative ANA result. On the other hand, in routine laboratory procedures, ANA titer and pattern are often not considered when deciding upon follow-up testing with EIA although, as shown in the present study, both the titer and the pattern can be used to direct this decision. Thus, in our hospital patient mix, the probability of a positive anti-dsDNA or anti-ENA result with EIA was 20% or less for sera that had titers of 1:160 or lower by IIF (data not shown). From a cost efficiency point of view, the testing with EIA of sera with a low ANA titer can, therefore, be questioned, particularly also in view of the fact that the diagnoses of systemic autoimmune diseases are largely made clinically. The ANA pattern can also be used to guide the follow-up testing with EIA. In ANA homogeneous sera, the parallel investigation of anti-ENA EIA and anti-dsDNA EIA only marginally increased the positive rate compared to use of anti-dsDNA alone (Fig. 6) and, again from a cost efficiency point of view, it does not seem justified to investigate such sera with both of these EIAs, in particular since there is little additional clinical information in a result found to be positive for both anti-dsDNA and ENA than in one found to be positive for anti-dsDNA alone. The situation is a little different with sera showing the ANA speckled pattern. Here, the investigation of both anti-dsDNA and anti-ENA results in an approximately 10% higher detection rate compared to the use of anti-ENA alone (Fig. 7). There is additional clinical information in a result found to be positive for both anti-ENA and anti-dsDNA compared to anti-ENA alone. Therefore, with ANA speckled sera it would seem justified to follow up with both of these EIAs. A possible exception are sera that show a positive mitotic reaction on HEp-2. In our study such sera behaved very similar to ANA homogeneous sera in their anti-dsDNA and anti-ENA reactivities (Fig. 7).
It is a common practice to include Scl-70 and Jo-1 in commercially available ENA tests. Autoantibodies against these antigens are rather specific for progressive systemic sclerosis (4) and polymyositis (4), respectively, i.e., diseases with a low prevalence and in which anti-ENA are rarely found (6). In agreement with this, in the present study the positive rate for anti-Scl-70 and anti-Jo-1 was low, and the determination of these autoantibodies in addition to the determination of anti-ENA increased the positive rate by only approximately 5%. Therefore, the determination of anti-Scl-70 and anti-Jo-1 in a general hospital population does not seem justified from a cost efficiency point of view.
ACKNOWLEDGMENTS
The excellent technical assistance of Petra Gebert and Ulrike Knoll is gratefully acknowledged.
REFERENCES
- 1.Emlen W, O'Neill L. Clinical significance of antinuclear antibodies. Arthr Rheum. 1997;40:1612–1618. doi: 10.1002/art.1780400910. [DOI] [PubMed] [Google Scholar]
- 2.Gniewek R A, Stites D P, McHugh T M, Hilton J F, Nakagawa M. Comparison of antinuclear antibody testing methods: immunofluorescence assay versus enzyme immunoassay. Clin Diagn Lab Immunol. 1997;4:185–188. doi: 10.1128/cdli.4.2.185-188.1997. [DOI] [PMC free article] [PubMed] [Google Scholar]
- 3.Hansson H, Trowald-Wigh G, Karlsson-Parra A. Detection of antinuclear antibodies by indirect immunofluorescence in dog sera: comparison of rat liver tissue and human epithelial-2 cells as antigenic substrate. J Vet Intern Med. 1996;10:199–203. doi: 10.1111/j.1939-1676.1996.tb02050.x. [DOI] [PubMed] [Google Scholar]
- 4.Haug L M, Nakamura R M. Current concepts and advances in clinical laboratory testing for autoimmune disease. Crit Rev Clin Lab Sci. 1997;34:275–311. doi: 10.3109/10408369708998095. [DOI] [PubMed] [Google Scholar]
- 5.Homburger H A. Cascade testing for autoantibodies in connective tissue diseases. Mayo Clin Proc. 1995;70:183–184. doi: 10.4065/70.2.183. [DOI] [PubMed] [Google Scholar]
- 6.Jacobsen S, Halberg P, Ullman S, Van Venrooij W J, Hoier-Madsen M, Wiik A, Petersen J. Clinical features and serum antinuclear antibodies in 230 Danish patients with systemic sclerosis. Br J Rheumatol. 1998;37:39–45. doi: 10.1093/rheumatology/37.1.39. [DOI] [PubMed] [Google Scholar]
- 7.Jaskowski T D, Schroder C, Martins T B, Mouritsen C L, Litwin C M, Hill H R. Screening for antinuclear antibodies by enzyme immunoassay. Am J Clin Pathol. 1996;105:468–473. doi: 10.1093/ajcp/105.4.468. [DOI] [PubMed] [Google Scholar]
- 8.Prost A C, et al. Comparing HEp-2 cell line with rat liver in routine screening test for antinuclear and antinucleolar antibodies in autoimmune disease. Ann Biol Clin. 1987;45:610–617. [PubMed] [Google Scholar]
- 9.Slater C A, Davis R B, Shmerling R H. Antinuclear antibody testing. A study of clinical utility. Arch Intern Med. 1996;156:1421–1425. [PubMed] [Google Scholar]


