The authors of “Expression and activity of phosphodiesterase isoforms during epithelial mesenchymal transition: The role of phosphodiesterase 4” (Mol Biol Cell [2009] 20, 4751-4765; 10.1091/mbc.e09-01-0019) wish to correct three of the figures in the article. The corrected figures are shown here.
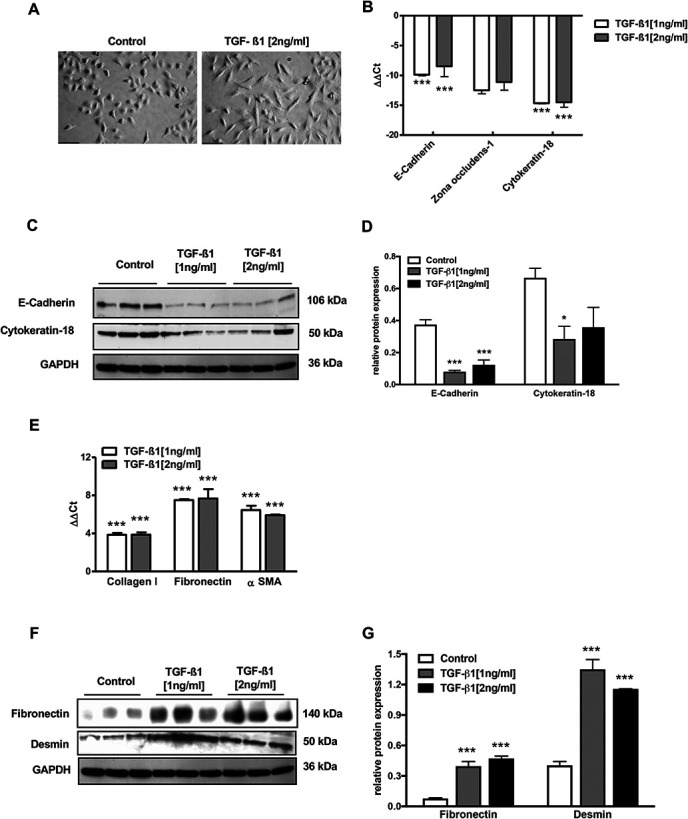
The image in Figure 1A has a missing scale bar and identical cell morphology. The cytokeratin Western blot in the original Figure 1C contained eight panels instead of nine as shown for E-cadherin and GAPDH. Further, identical GAPDH Western blot images were placed in Figures 5B and 6E and in Figures 10B and 10G.
Based on the original data sets, the authors were able to correct all the above figure panels. New images with better morphological representation and scale bar are provided in Figure 1A. They found the corresponding cytokeratin-18 blot for Figure 1C and conducted a new densitometric analysis, which is shown in panel D of the corrected Figure 1.
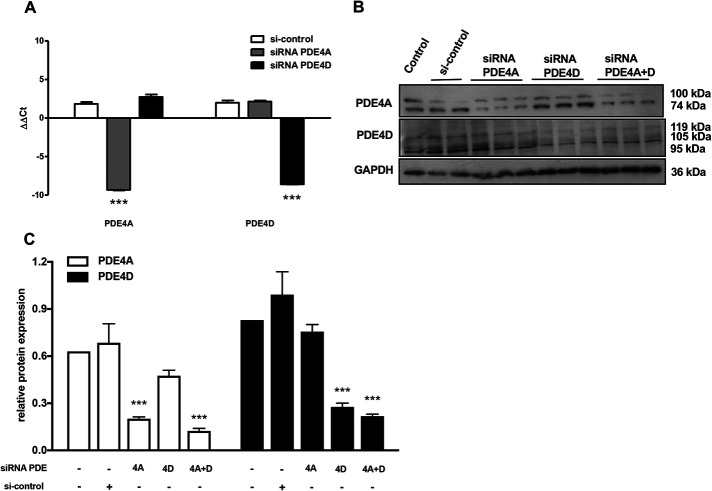
The authors also found the correct GAPDH loading control (erroneously used from Figure 6E in the original figure) and corrected Figure 5B correspondingly. Again, the densitometric analysis confirmed the siRNA-mediated down-regulation of the target genes and a new panel is now shown in Figure 5C.
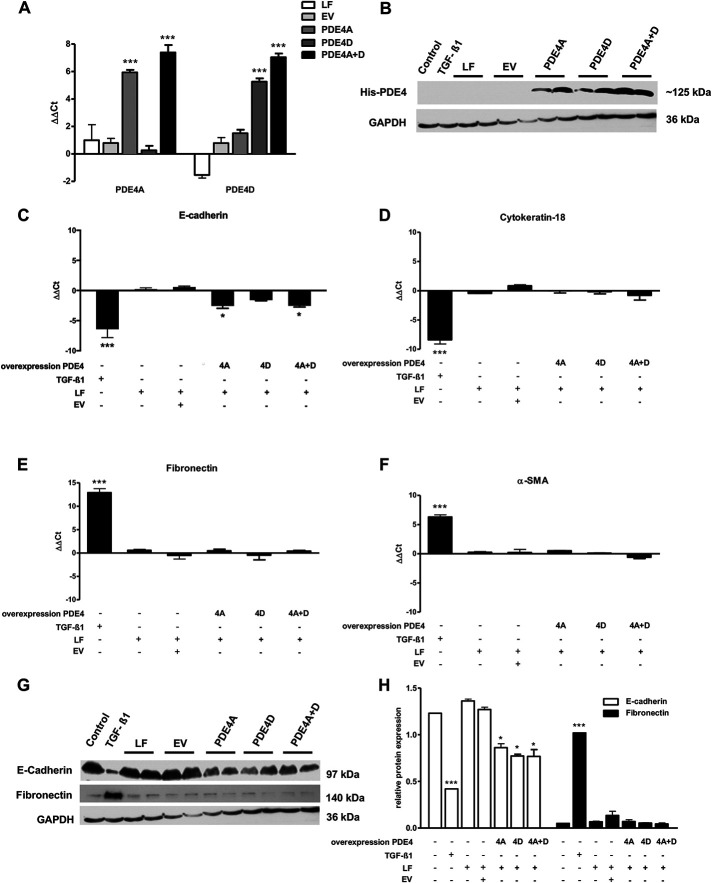
The authors state that the GAPDH loading control from Figures 10B and 10G are identical because after confirming the overexpression of PDE4A and PDE4D on the Western blot with His tag, the same Western blot was stripped and reincubated with an antibody against E-cadherin/fibronectin. The labeling of the bands in Figure 10B was not correct. Similarly to Figure 10G, the first lane was control and the second lane was TGF-β stimulation. The labeling of Figure 10B is now corrected in the revised version of the figure.
The authors are deeply sorry for these mistakes and would like to clarify that all the data reported in the Results section of the article remains unaffected. Accordingly, this is also true for the Discussion of these results and the general message of the article.
FIGURE 1:

Effect of TGF-β1 stimulation on cell morphology and epithelial phenotype marker expression. (A) A549 cells were stimulated with TGF-β1 (2 ng/ml) for 24 h. Cell morphology was examined using phase contrast microscopy. Scale bar 100 µm. (B) mRNA expression as analyzed by real-time RT-PCR of the epithelial phenotype markers E-cadherin, zona occludens-1, and cytokeratin-18 in TGF-β1 (1 and 2 ng/ml)-stimulated (24 h) and control cells. (C) Protein expression as analyzed by immunoblotting. (D) Subsequent densitometric quantification of epithelial phenotype markers (E-cadherin and cytokeratin-18) in TGF-β1 (1 and 2 ng/ml)-stimulated (24 h) and control cells are indicated. (E) mRNA expression as analyzed by real-time RT-PCR of mesenchymal phenotype markers, collagen I, fibronectin, and α-SMA in TGF-β1 (1 and 2 ng/ml)-stimulated (24 h) and control cells. (F) Protein expression as analyzed by immunoblotting. (G) Subsequent densitometric quantification of mesenchymal phenotype markers (fibronectin and desmin) in TGF-β1 (1 and 2 ng/ml)-stimulated (24 h) and control cells. All values are given as the mean ± SEM (n = 4) and are normalized to PBGD (B and E) or GAPDH (D and G). *p < 0.05, and ***p < 0.001 versus control.
FIGURE 5:
siRNA-mediated knockdown of PDE4A and PDE4D. A549 cells were transiently transfected with 100 nM control siRNA (si-control) or 100 nM PDE4A siRNA, PDE4D siRNA, or both (PDE4A+PDE4D) siRNAs for 24 h (mRNA expression) or 48 h (protein expression). (A) mRNA expression of PDE4A and PDE4D as analyzed by real-time RT-PCR. (B) Protein expression as analyzed by immunoblotting. (C) Subsequent densitometric quantification of PDE4A and PDE4D in the above-mentioned treated cells. All values are given as the mean ± SEM (n = 4) for mRNA and are normalized to PBGD (A) and n = 3 for protein and are normalized to GAPDH (C). ***p < 0.001 versus si-control.
FIGURE 10:
Effects of PDE4 overexpression in inducing epithelial mesenchymal transition. A549 cells were treated with TGF-β1 (2 ng/ml) for 24 h or transiently transfected with 2 μg empty vector (EV), PDE4A clone, PDE4D clone, or both (PDE4A+PDE4D). Lipofectamine (LF) was used as a transfection reagent. (A) mRNA expression of PDE4A and PDE4D as analyzed by real-time RT-PCR. (B) Protein expression of His tag as analyzed by immunoblotting in transfected cells. mRNA expression of E-cadherin (C), cytokeratin-18 (D), fibronectin (E), and α-SMA (F) as analyzed by real-time RT-PCR. (G) Protein expression as analyzed by immunoblotting. (H) Subsequent densitometric quantification of E-cadherin and fibronectin in above-mentioned transfected cells. *p < 0.05, and ***p < 0.001 versus EV-transfected cells.
The HTML and PDF versions were corrected on the Molecular Biology of the Cell website on August 1, 2022. These corrections may not appear on copies of the article that reside on other websites.


